A Simplified Look at the Complex World of Fish Population Dynamics

I have a simplified approach in analyzing fish population dynamics from which I review the status of populations of smelt and salmon. It looks at the dynamics of the relationship between the number of spawning adults and their returning adult recruits one to several years later (Figure 1). In the fish science vernacular, it is sometimes referred to as the “spawner-recruit curve” or “stock-recruitment relationship” or simply “S/R relationship”. The major features of a S/R relationship are shown in Figure 1 (A, B, and C):

A. The blue and red curves show a standard spawner-recruit relationship, with higher spawners bringing more recruits – more eggs, more young, more smolts, more returning spawners, etc. It tails off when too many adults result in competition for food or spawning habitat, or higher rates of communicable disease – density-dependent effects.

B. The variability around the blue and red curves, shown by the vertical lines through the curves, is caused by density-independent effects such as drought, fishing harvest, or pollution that vary from year to year.

C. The difference between the blue and red curves, shown in the example as a yellow arrow, is a shift in the S/R curve that is a result in a fundamental shift in the relationship. Examples of such changes are the amount or quality of habitat from a dam being built, watershed destruction from a fire, loss of streamflow from new water diversions, loss of prey base, etc. The blue curve shows the S/R relationship before a fundamental shift; the red curve shows the S/R relationship after the fundamental shift.

Some environmental factors can affect one or more of the three features. For example, hatcheries can increase recruits (A and B), or they can cause a fundamental shift in the relationship (C) by imposing genetic changes in the population. Hatcheries benefit egg viability and fry survival, producing more smolts to the ocean per spawner in salmon populations, but may alter the wild component’s genetic viability.

The winter-run salmon population’s S/R relationship (Figure 2) exhibits these features, as well as the overall complexity in the relationship. Hatchery smolt introductions have propped up the population over the past two decades and increased its variability (red curve and vertical line), especially during periods of drought.

For longfin smelt, a state-listed species, there is a strong S/R relationship (Figure 3) to the features described in A-C above. There is a strong positive S/R relationship (A). There is a strong effect of the climate (B). And there appears to be a fundamental shift in recent years (C).

For Delta smelt (Figure 4), a state- and federally-listed species, which I consider nearly extinct at least in the wild, there was a strong S/R relationship (A), a climate effect (B), and a fundamental shift (C). The latter proved simply not sustainable, leading to a population crash that is not recoverable without supplementation (hatchery inputs) or drastic changes In environmental conditions.1 Note that 2016 is the last year in this figure, because the population since 2017 has been too close to zero to evaluate.

The largest salmon population, the Sacramento fall-run salmon, long sustained by hatchery inputs, is mainly controlled by feature B (Figure 5). Climate and water management are the dominant control of survival of hatchery and naturally-produced smolts reaching the ocean.

In conclusion, I recognize that S/R relationships represent a simplified view of extremely complex and changing relationships in the real world. Estimates of the number of spawners and recruits are often crude. But the relationships are real and statistically significant. It is up to us to interpret them by relating causal factors and developing hypotheses that can be tested with further scientific study and experiments. Unfortunately, managing fishery resources in the face of complex ecology, difficulty monitoring, natural variability, and statistical measurement errors is inherently difficult, even before political and economic factors get into the mix.

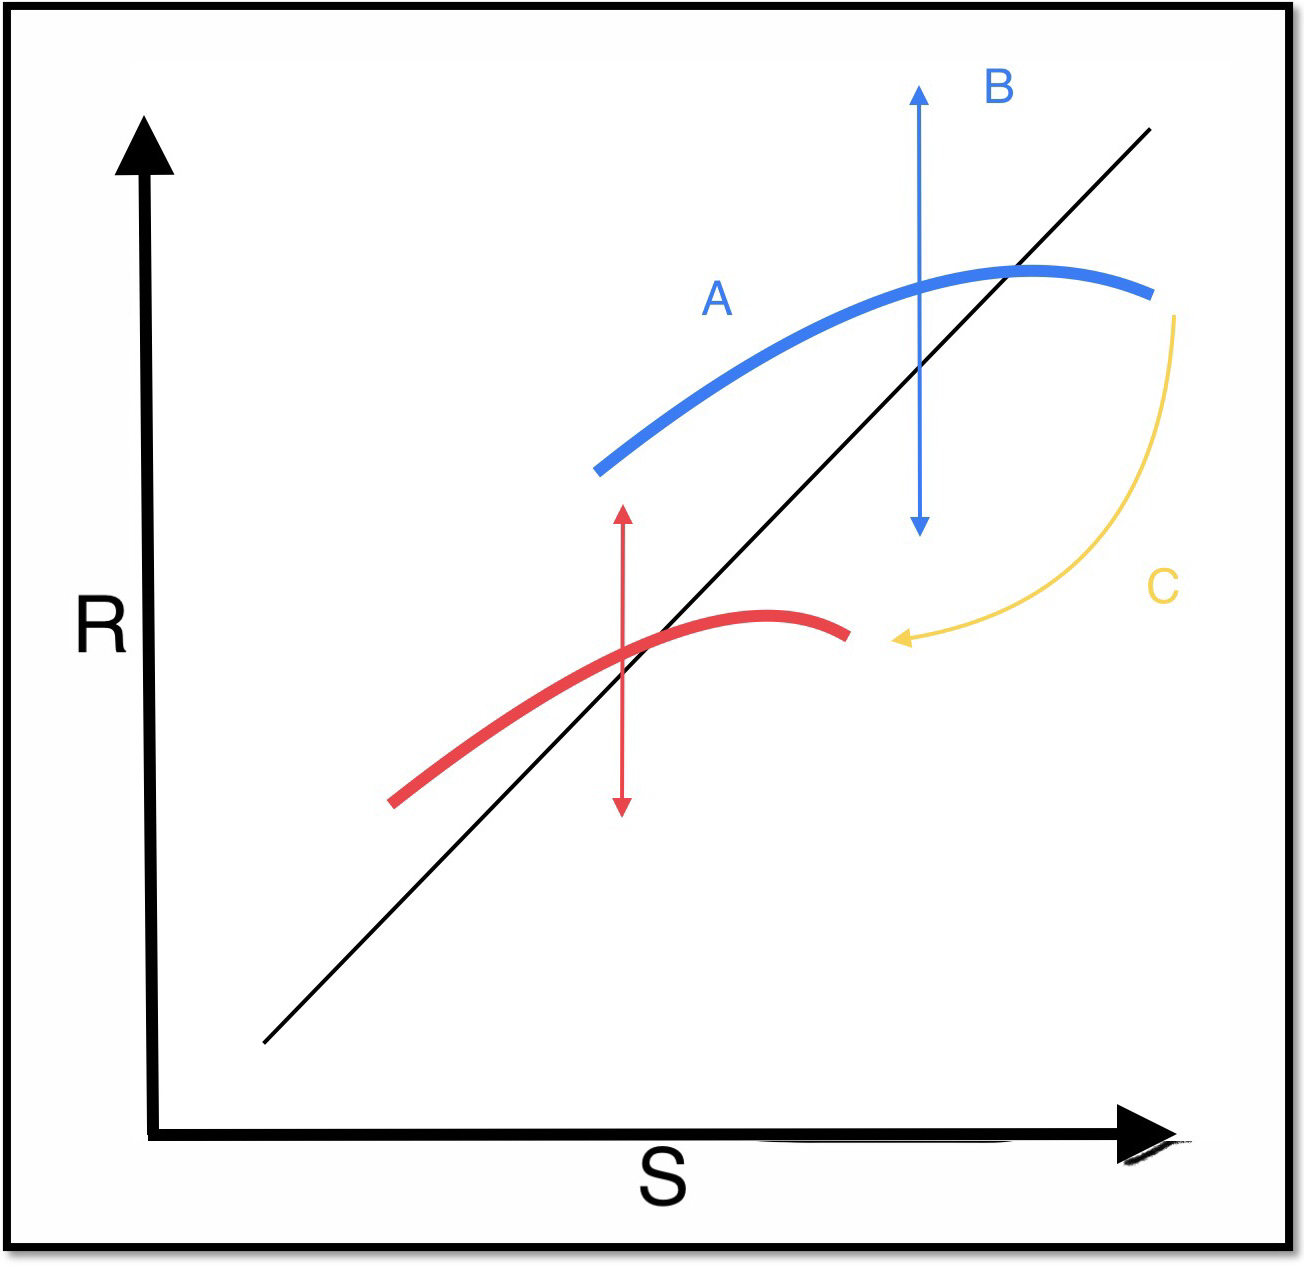
Figure 1. Spawner-Recruit relationships with three main features (A-C). See text for explanation of the features. In figures 2-4 below, the blue curve represents the historical S/R relationship. The red curve represents the new historical S/R relationship following a fundamental shift in the relationship, including long-term drought. The vertical lines through the curves show the range of the annual variability of the S/R relationship attached to each curve, excluding the density-dependent variability that is incorporated into the curve. In this example figure, the yellow curve tracks a fundamental shift in the S/R relationship. Spawners are shown on the x-axis; recruits are shown on the y-axis. The numbers on the axes are log transformed in order to make size of the figures manageable; log transformation does not alter the statistical relationships.

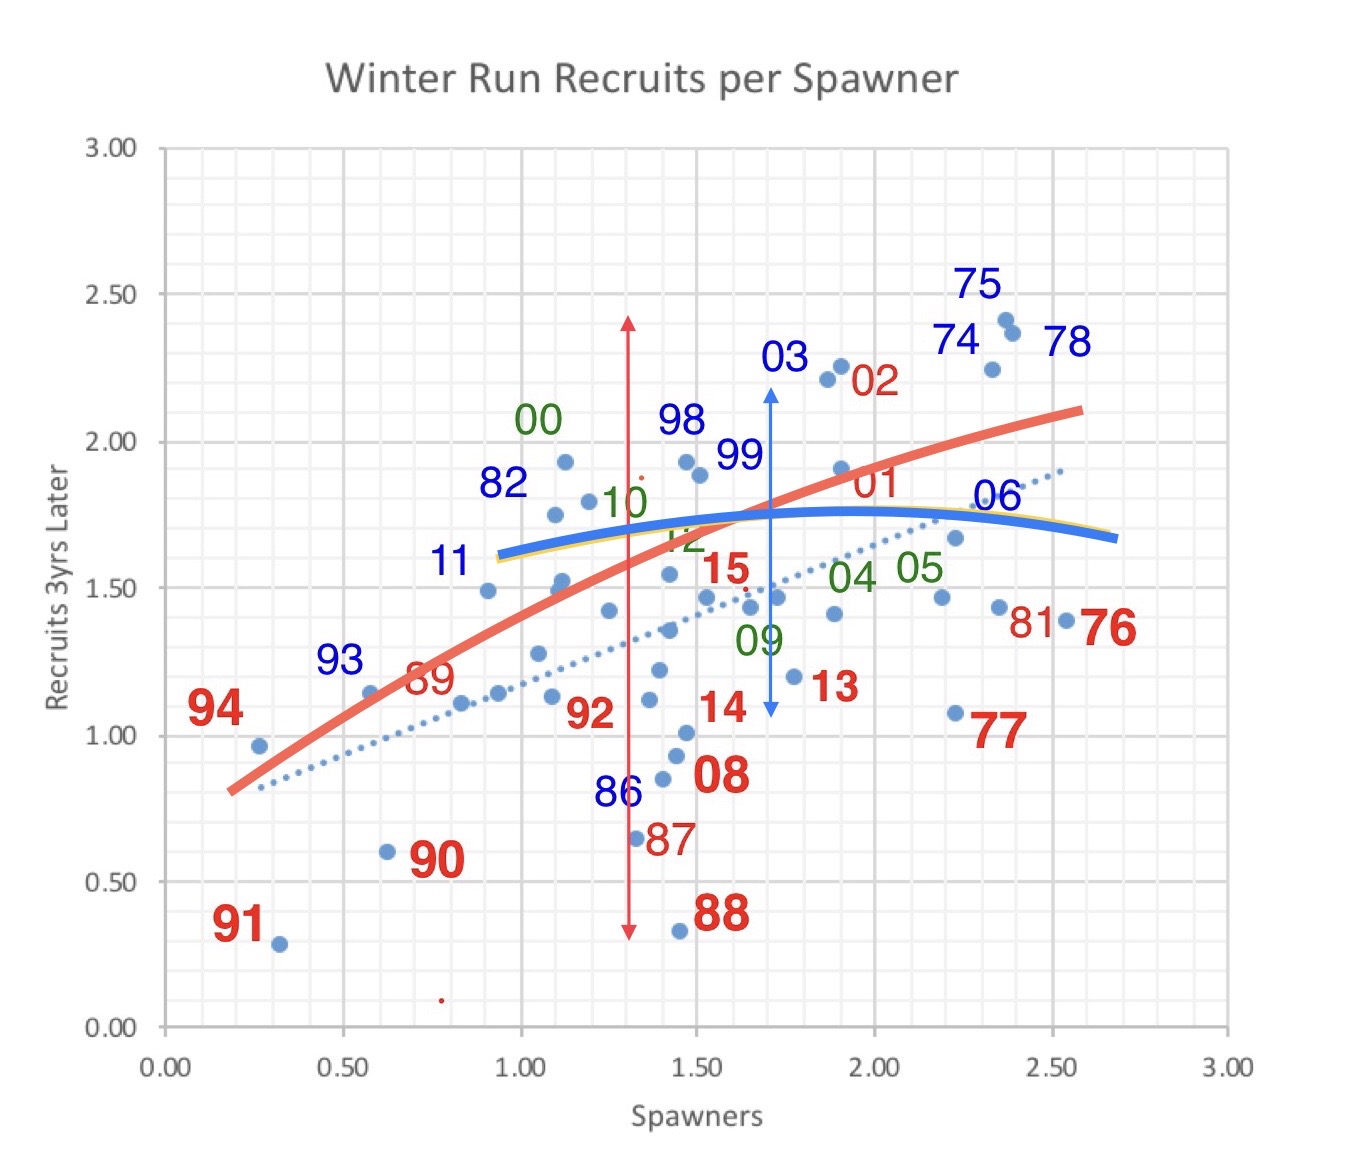
Figure 2. Spawner-Recruit relationship for winter-run Chinook salmon in the Sacramento River. Numbers shown represent the brood year of recruits (number of returning adults) for year displayed. For example, “11” represents fish produced in wet year 2011. The color of the number shows the conditions when brood was spawned and reared in the upper Sacramento River below Shasta Dam before emigrating to the ocean. A red number shows a dry year during spawning and early rearing. A blue number designates wet year spawning and rearing conditions. A green number designates normal water year conditions. For example, 15 represents brood-year 2015 recruits that returned in 2018, while its red color designates drought conditions in 2015. In this figure, numbers on axes are log-2 transformed.

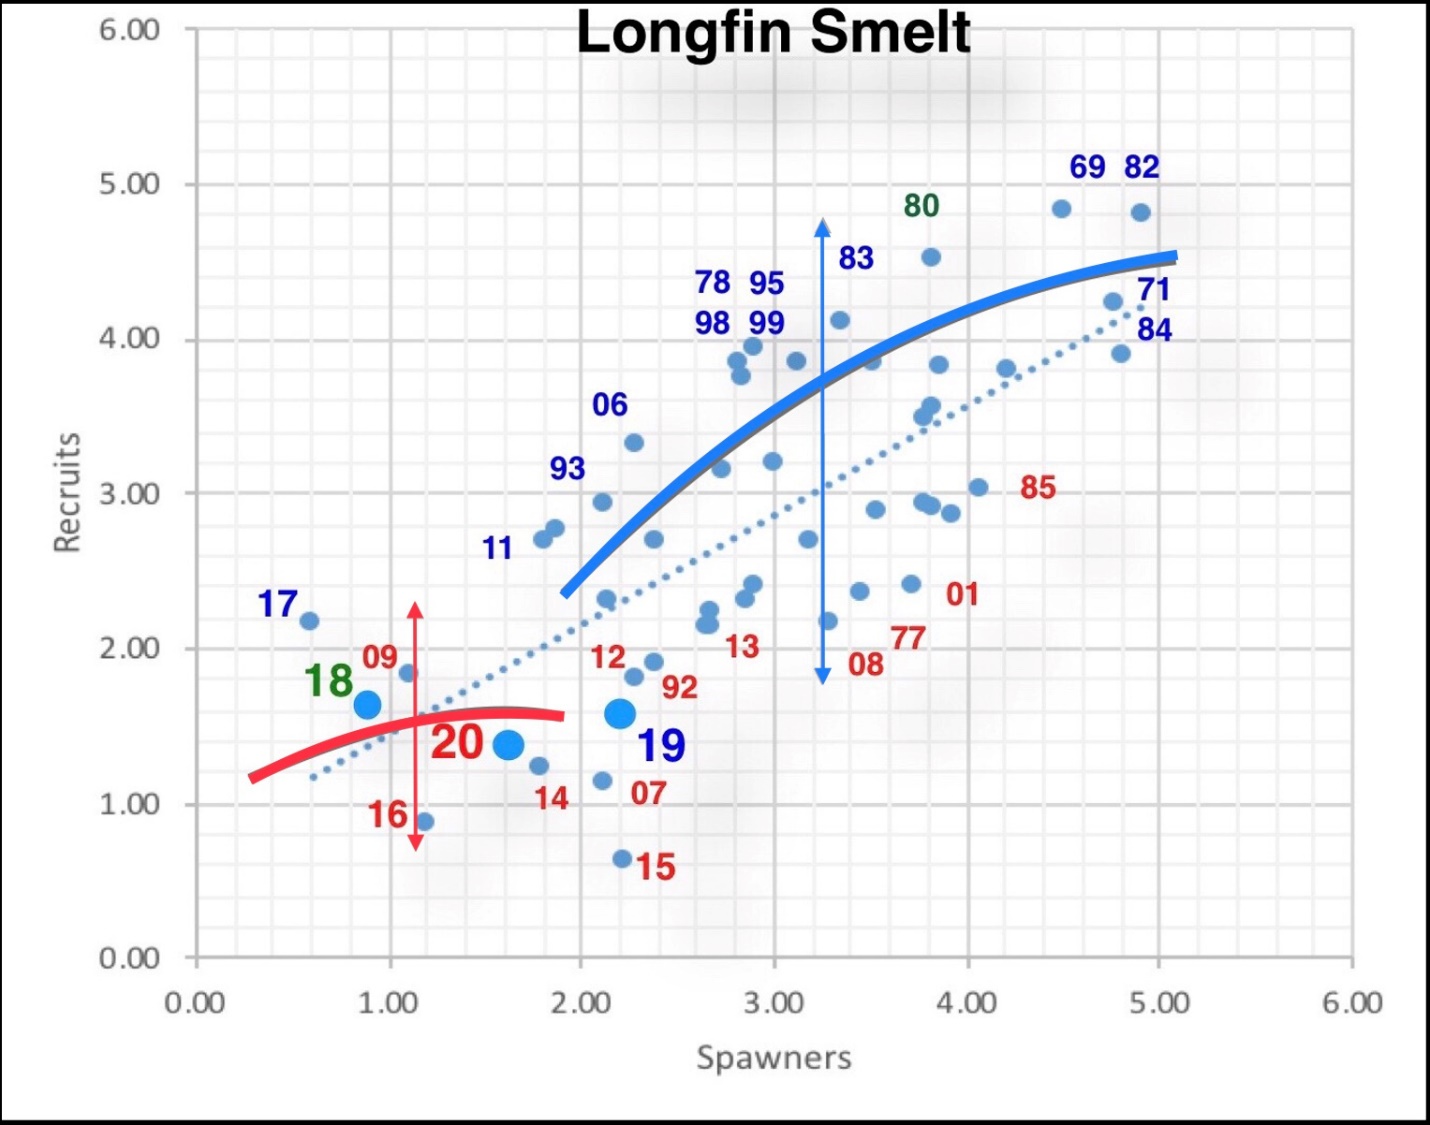
Figure 3. The longfin smelt S/R relationship. The number and color represents the brood year’s fall index (recruits) and its water year type during its spawning run and first year of rearing. The spawners are the index from two years earlier. For example, the red number 15 represents the fall index for brood-year 2015 under water-year 2015 drought conditions, with spawners being the recruits from 2013. In this figure, numbers on axes are log-log transformed.

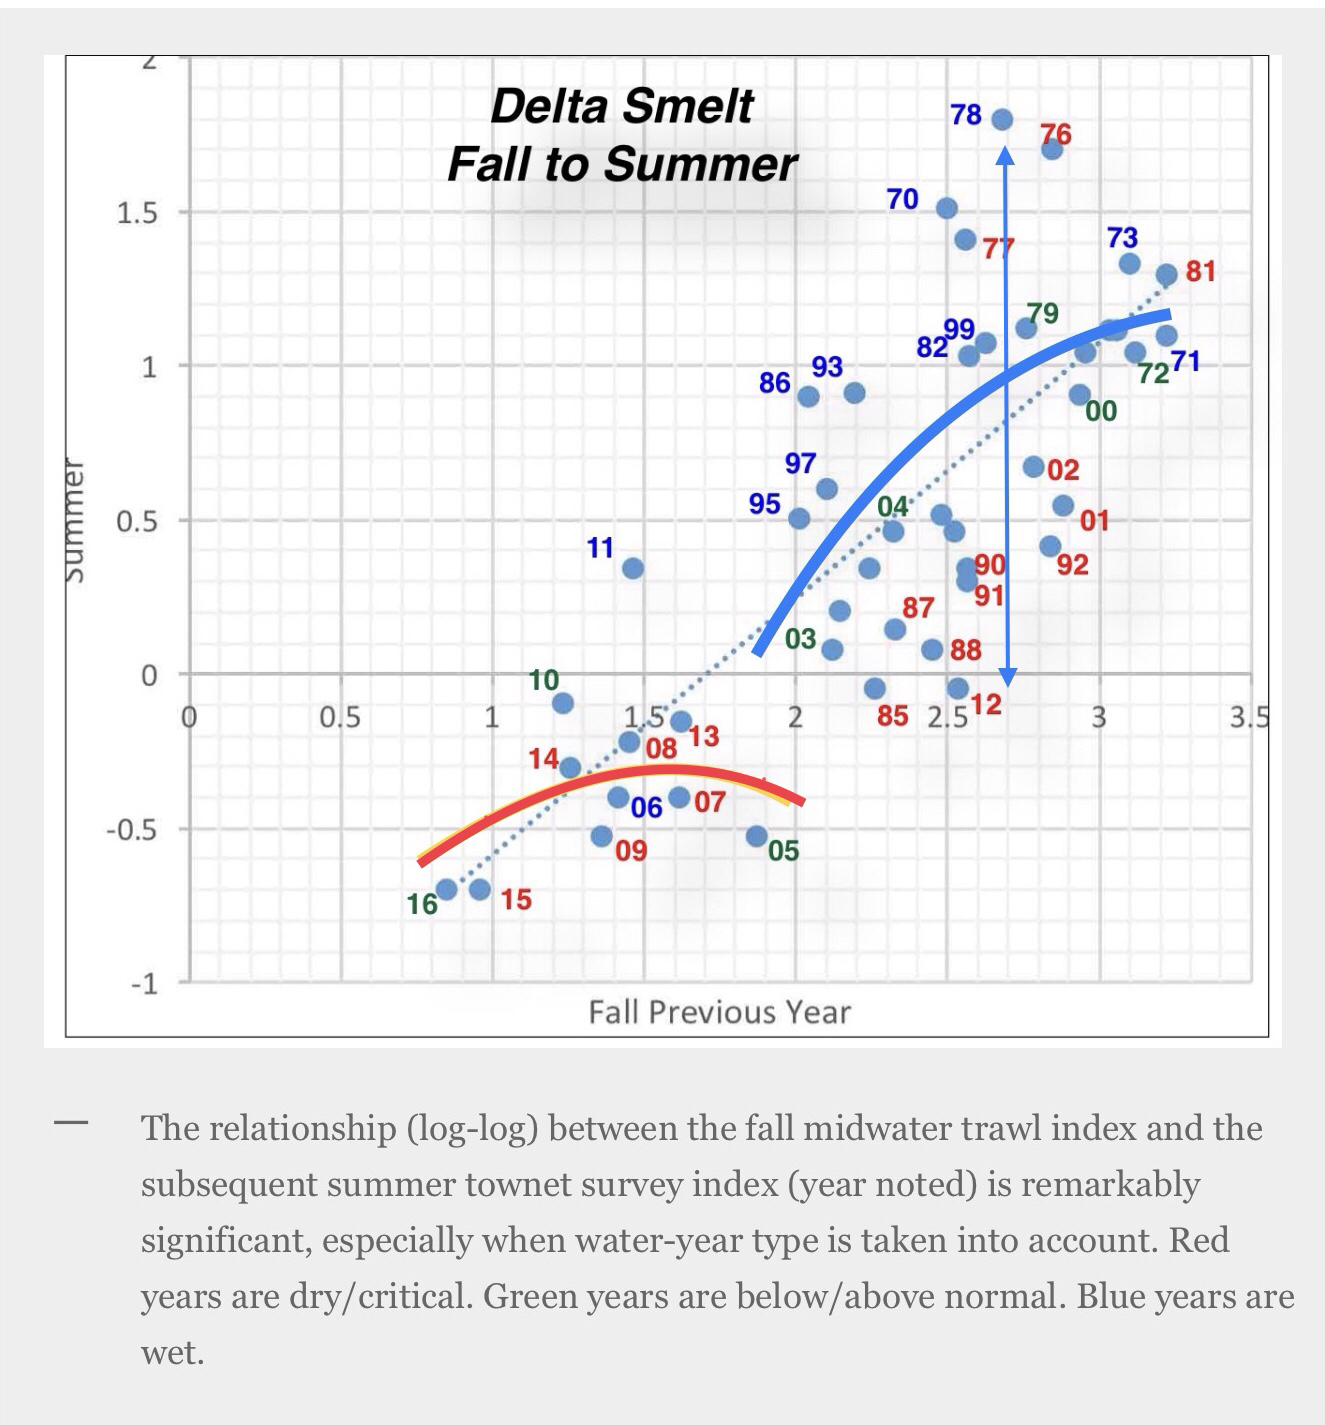
Figure 4. The Delta Smelt S/R relationship. I added two curves and a vertical line to an original figure to show the hypothesized S/R relationship; there is too little variability in the red curve for a vertical line to be meaningful.

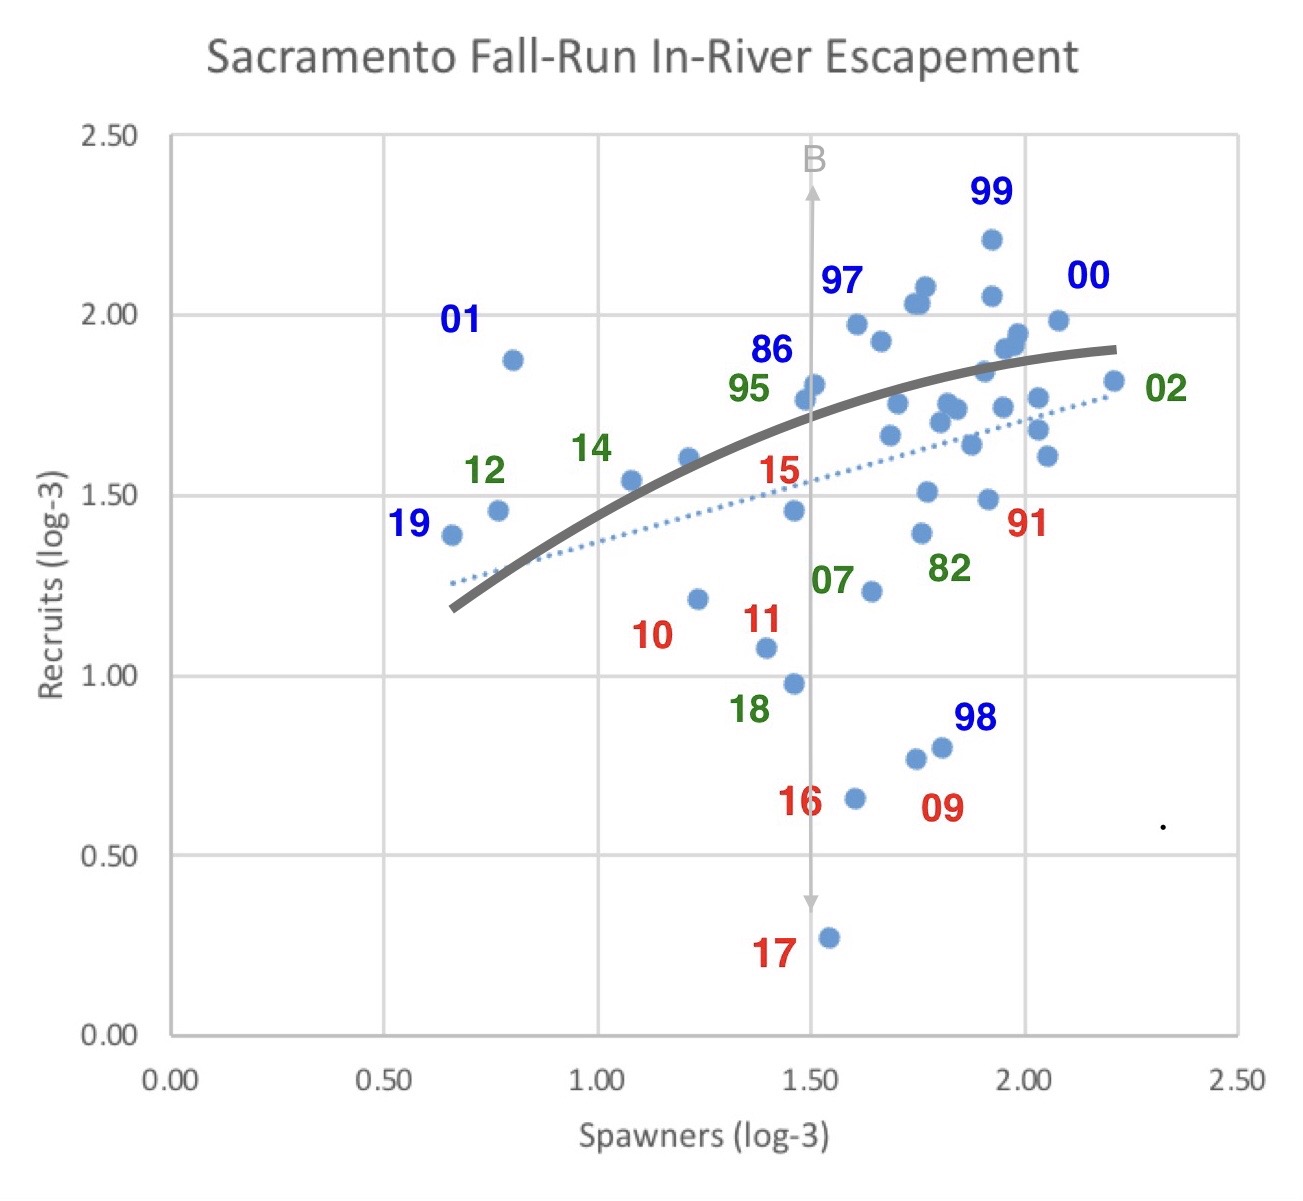
Figure 5. Spawner-Recruit relationship for upper Sacramento River mainstem fall-run Chinook salmon. Number is recruitment year (escapement). Spawners are recruits from three years prior. Numbers are log minus 3 transformed. A red number shows a dry water year two years prior during rearing and emigration. A blue number shows a wet year two years prior. A green number shows for a normal water year two years prior. For example: red 17 represents 2017 run that reared in drought year 2015, with spawners (parents) being the 2014 green run number. Note that only one curve is shown. in gray, for this run of salmon, which is almost entirely dependent on hatchery production.

Delta Pumps Throttled Back – December 2021

A January 1 article in the Bee noted federal and state Delta pumping plants were “throttled back” in late December to protect the nearly extinct Delta smelt and other fish.  Exports had reached 9000 cfs from December 17-19, 2021, and then cut to 2000 cfs on December 20, despite high Delta inflows from the Sacramento River (Figure 1).  With the Delta Cross Channel closed in December and the False River Barrier in place, exports were drawing from the interior Delta via the Old and Middle River channels (Figure 2).  Most of that water was replaced via Georgianna Slough from the Sacramento River (7000 cfs) and San Joaquin River (1000 cfs).  The overall pattern from December 19 is shown in the map below.

Map of daily average flow conditions in the Delta, December 19, 2021.

Export cutbacks in December were prompted by the federal ESA biological opinions to protect Delta smelt, as well as winter-run and spring-run salmon from the Sacramento River.  Adult smelt move up into the interior Delta from the Bay with the first late-fall, early-winter runoff events.  Juvenile salmon move downstream to the Delta during these same early storm events and move into the interior Delta via Georgianna Slough.

Historically, exports were maxed-out near 11,000 cfs during December storm flows to refill San Luis Reservoir in the San Joaquin Valley after the irrigation season.  But such high exports resulted in heavy losses of smelt and salmon at the south Delta pumping plants (Figures 3 and 4), prompting the mandates in the biological opinions for export reductions.

San Luis Reservoir at the end of December 2021 was only at 30% of its 2 million acre-feet capacity; when the historical average for December has been 60%.  There is strong pressure to refill the reservoir.  On the other hand, the smelt and salmon are endangered species on the verge of extinction after several multi-year droughts in the past 15 years.  The smelt and salmon are in the Delta now, and need protection, whereas San Luis still has a chance of filling this winter under the allowed exports if 2022 continues normal or wet.  Because Federal and state laws mandate protecting the endangered fish and the biological opinions specify priority be given to the fish under these specific circumstances, export restrictions are the appropriate prescription.

Figure 1. Delta inflow from the Sacramento River at Freeport (FPT) and San Joaquin River at Mossdale (MSD) November-December 2021.

Figure 2. Internal Delta tidally-filtered flows in Old and Middle River en route to south Delta export pumps in December 2021.

Figure 3. Exports and salvage of winter-run salmon at export pumps from December 1, 2002 to February 1, 2003.

Figure 4. Exports and salvage of Delta smelt at export pumps from December 1, 2002 to February 1, 2003.

A Ridiculous Premise

A recent post from the Center for California Water Resources Policy and Management (Center) discusses the extinction of the Delta smelt.  The post starts by saying, “To be sure, the delta smelt’s numbers are in decline.”  That is a real understatement, but it contains some acknowledgement of the facts.

The author goes on to say, “It might fairly be argued that prime contributors to the delta smelt’s distressed status are California’s resource agencies.”  The ostensible rationale for this attribution is, first, that the resource agencies don’t look for smelt in the right places in the right way.  Second, because the agencies can’t find the smelt, “they have resisted managing the species ‘adaptively’” based on the monitoring that they don’t do.

This ridiculous premise suggests the decline has not been caused by excessive exports of water from the Bay-Delta watershed over the past five decades, but by the resource agencies who don’t know where to find and thus protect the smelt.

The author argues: “The agencies persist in mobilizing trawler-based open-water fish surveys, originally intended to census juvenile striped bass, as their primary means of monitoring delta smelt and the Delta’s other protected fish species.”  This statement is simply untrue.  To provide better coverage of “open-water” pelagic smelt, the Interagency Ecological Program (IEP) in recent decades added the Larval Survey, the 20-mm Survey, the Kodiak Trawl Survey, and most recently the Enhanced Delta Smelt Monitoring Program (EDSM).   All of these surveys, plus the historic Fall Midwater Trawl and Summer Townet Surveys (and 50 years of Delta Export Fish Salvage Surveys), show the smelt’s catastrophic decline and march toward extinction.

But the author insists that the smelt are out there somewhere.  “The surveys sample neither the relevant habitat strata used by those fishes nor the extent of their ‘closed’ populations, which would allow for estimates of the sizes of their populations.”  If the smelt are out there in “closed populations” whose numbers would change the conclusions about the smelt’s catastrophic downward trend, then surely the author and the water purveyors who have a vested interest in finding those populations can muster some evidence and show the agencies and the rest of the world where to look.

Basic review and analyses of the available information show the decline of Delta smelt is highly associated with increasing exports and associated factors (see my many posts on this subject).  The partial truth in the notion that the resource agencies have been complicit in the decline of Delta smelt stems from agency inaction to cut back those exports consistent with biological sustainability.  Agency managers don’t lack information and scientific method.  They lack the political courage to deploy them.

Delta Smelt Status 2021

The Enhanced Delta Smelt Monitoring (EDSM) caught only 1 Delta smelt in 2200 smelt-targeted net tows in 2021.  This compares to 49 captured in 2020 and hundreds in prior years.  None were captured in the Spring Kodiak Trawl 2021 survey (Figure 1).  This year’s results indicate that Delta smelt are likely virtually extinct in the wild.

Figure 1. Spring Kodiak Trawl survey index of Delta smelt (2004-2021), in which none were caught in 2021. Only one was captured in 2020. (source)

Longfin Smelt 2021

In a 6/15/21 post, I had a grim outlook for longfin smelt for the summer of critical drought year 2021.  My concern has proven warranted.

The June Townet Survey (6/7-6/10) found longfin juveniles concentrated in the Sacramento River channel of the western Delta (Figure 1) in water temperatures of 19-21ºC (Figure 2), very close to stressful, low growth, poor survival conditions for longfin (>20ºC).  The area was within the low salinity zone, where juvenile smelt concentrate in spring.  In conditions of low Delta outflow in drought years like 2021, the low salinity zone encroaches into the western Delta, where the zone is prone to warming without the cooler Bay air temperatures.  The zone remained in the western Delta through the summer of 2021, with sustained water temperatures of 21-23ºC.

The September Midwater Trawl Survey collected only one longfin smelt, a minimum catch for that survey (Figure 3).  This catch total was similar to those observed in late summer of other drought years (07-08, 15, and 20).

A 2017 paper by UC Davis scientists concluded that extinction of Delta smelt and longfin smelt was not inevitable if the necessary recovery actions were soon implemented.  The paper’s recommended actions have as yet not been implemented, and conditions have even become worse in recent years, especially in the 2021 drought.  Delta smelt are now virtually extinct in the wild, with longfin smelt likely to follow soon.

Figure 1. Catch per unit effort of longfin smelt in survey #1 of CDFW/IEP Townet Survey in June 2021.

Figure 2. Water temperature in lower Sacramento River channel in western Delta in early June 2021.