Recently the San Francisco Estuary & Watershed Science journal published a special issue that included a paper on Delta Smelt. The paper is an excellent summary of the present state of Delta smelt. The discussion section on p. 18 of the paper provides an excellent description of the whole of Delta Smelt science. The paper is comprehensive with a litany of scientific references on Delta science and the decline of the Bay-Delta estuary and the Delta Smelt. It also provides an outlook and prescription for the future, though bleak.
In this post I offer slightly more optimism with focused solutions, based on a somewhat different take on several key issues. Bear with me as I go through each issue and my usual array of diagnoses and recommended treatments that could bring smelt back from the brink.
Population Dynamics – What drives smelt numbers
“The role of density dependence has been an area of emphasis for these population dynamic studies. An apparent decrease in the carrying capacity of the estuary in the 1980s resulted in an increase in density-dependent mortality from the juvenile stage in late summer through the adult stage in fall (i.e., between the TNS and FMWT indices) (Sweetnam and Stevens 1993; Bennett 2005; Maunder and Deriso 2011).” p. 9.
Density-dependent mortality means that fish get so abundant that it reduces their growth and survival through competition. There is no evidence of this dynamic in the Delta smelt population indices (Figure 1). The number of smelt in fall is simply related to summer flow and exports, and most importantly to the starting number of summer juveniles, which is most certainly related to flow and exports (Figure 2). The latter is density independent – survival was not lower at higher initial numbers or vice versa. Density dependence might be expected in conditions of very, very high abundance of juveniles that competed amongst each other for food, possibly even driving down their food supply. That is simply not possible at the extremely low population levels that exist at present and that have existed in the recent past.
“In general, the relationship between sub-adult (spawner) abundance indices and juvenile abundance in the following year is poor (i.e., between the FMWT and TNS indices).” p. 9.
No, the relationship between spawner abundance and juvenile abundance is strong (Figure 2). The number of young smelt produced is much reduced in most dry years because of their lower flows and higher exports. Low exports in the wetter years 2010 and 2011 from restrictions in the 2008 Smelt Biological Opinion really helped. Those restrictions were not in place in red-circled 2005.
“This suggests that inter-generational abundance is driven more by environmental conditions, rather than by density-dependent factors.” (Id.)
What they are saying is that the number of young produced each summer is determined by environmental factors, which is true. But the most important factor remains the number of adult spawners at the beginning of the year, as represented by the fall index. It is a vicious circle, with environmental factors (flow and exports) driving the population down to the point that production even in good environmental conditions (2010, 2011) is low because of the depressed population (low number of eggs produced). This defining problem is important, because under the paper’s conclusion, the population can come back under good conditions. That is not possible with the stock size low. The authors seem to recognize this:
“Given the annual life cycle, any episodic salvage event may undermine population resilience by keeping numbers low, even when environmental conditions are good.” (p. 14).
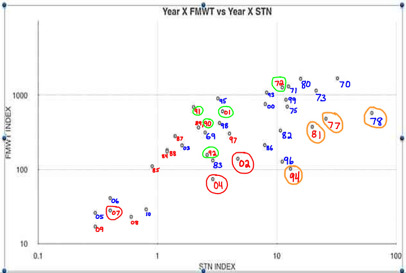
Figure 1. Strong Stock Recruitment relationship. Summer to fall abundance plotted using log of numbers. Summer Townet (STN) Index in June. Fall Midwater Trawl (FMWT) Index in Sep-Dec. Lower survival in high export/low outflow dry summers like 77, 78, 81, 94, 02, and 04. Lower survival in flood years 82, 83, 86, 96. Higher survival in low export summers 90-92 when they ran out of water for export, and 72 when Andrus Island levee broke. (Source: http://calsport.org/fisheriesblog/?p=810 )
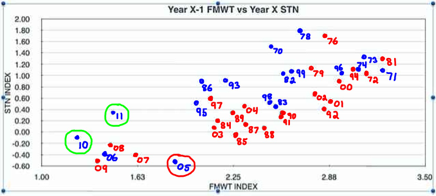
Figure 2. Strong Stock Recruitment relationship. Fall to next summer abundance plotted using log of numbers. Summer Townet (STN) Index in June. Fall Midwater Trawl (FMWT) Index in Sep-Dec. Blue years – wet; red years – dry. Year 05 suffered from low number of spawners and high exports. Years 2010 and 2011 (green circles) were wetter with low exports under OMR restrictions – gave us some hope, but operations in following 4 years of drought ended that, as the past several years points have been at bottom left. (Source: http://calsport.org/fisheriesblog/?p=810 )
Predation
“Presently, Mississippi silverside is probably the most important predator of Delta Smelt larvae because of their ability to prey on eggs and larvae and their high abundance in shallow areas where Delta Smelt spawn (Bennett and Moyle 1996; Bennett 2005; Baerwald et al. 2012).” p. 14.
“Although Delta Smelt remained abundant in the Delta and Suisun Bay through the 1970s, long after most introduced fish predators and competitors had established populations (Grossman, this volume), smelt began rapidly declining after the invasions of overbite clam and Mississippi Silverside in the 1980s.” p.7.
Silversides were also abundant in the late 70’s (no 80’s invasion), but were in my opinion suppressed by very abundant juvenile striped bass. This effect persisted until the striped bass population crashed at the beginning of the new century. Note the relative abundance of silversides (smelt predator and competitor), threadfin shad (competitor), and yellowfin goby (predator and competitor) in the western Delta in 2006 (Figure 3), and the low density of striped bass. Next, note the depressed relative abundance of these same species in the western Delta in late summer and fall of 1978 (Figures 4-7). Note also the much greater abundance of juvenile striped bass and even some Delta smelt in 1978. While such evidence may be circumstantial, it clearly shows the role that striped bass once played as the dominant predator in the Delta. Now I have to ask the questions: (1) what caused the “invasion” of silversides in the 80s; and, (2) what was the role of striped bass?
“Largemouth Bass will consume Delta Smelt in mesocosms (Ferrari et al. 2014), but are unlikely to be a major predator in the wild because of limited habitat overlap between the two species.” p. 15.
There really is no proof of this. Largemouth are found pretty much throughout the Delta, including areas where juvenile smelt are found in summer and fall. With largemouth far more abundant than smelt, it is likely that smelt come across largemouth frequently. I have caught both species in the same seine in the fall, on several occasions.
Habitat Change – water temperature and salinity
“While Delta Smelt have a fairly broad salinity tolerance; they were historically most abundant in the low salinity zone (LSZ) of the estuary, the position of which is determined by outflow (Moyle et al. 1992; Kimmerer et al. 2013; Sommer and Mejia 2013). Moderate hydrological conditions in late winter and spring place the LSZ in the Grizzly Bay region of Suisun Bay (Jassby et al. 1995). These conditions were beneficial to the Delta Smelt population at least partly because of high food abundance. At present, there is little evidence of the benefit of summer and fall occupancy in the LSZ (IEP MAST 2015).” p. 16.
Occupancy of the low salinity zone is a benefit to smelt in those wetter years when the water temperatures in the LSZ are not lethal to smelt. The LSZ (roughly 0.5 to 6 ppt salt) and its internal focal point X2 (2 ppt) are indeed critical to the summer-fall success of smelt in the Delta. Food is generally more abundant and water temperature is generally lower in the LSZ than in fresher upstream waters. Lower temperature and slightly brackish water allow lower energy consumption (smelt blood serum is approximately 2 ppt). Smelt are adapted to X2, prefer X2, and are found primarily at X2. X2 and the LSZ are a major ecological theme for many estuarine species around the world. In 2014 and 2015, X2 was located too far upstream in the Delta because the State Water Board weakened Delta water quality requirements, resulting in lethal water temperatures for smelt in summer and fall. The smelt had no place to go. X2 belongs further west under the protection of the “Delta Breeze” and away from the influence of the South Delta export pumps. It really is that simple. [Note: on July 15, 2016, the State and Federal water projects bumped up Delta outflow from 7,000 cfs to 14,000 cfs by reducing exports while holding inflow (reservoir releases) constant in an effort to meet Delta salinity standards, pushing the few remaining smelt and X2 west of the Delta. Was this action beneficial to Delta smelt? We will have to see.]
“Warm water temperatures during summer exacerbate stress from low food availability and may explain reduced survival from summer to fall in some years (Bennett 2005; Bennett et al. 2008).” p. 14.
“In addition to moving the LSZ to a favorable location for smelt, increased outflow influences habitat quality through its effect on food supply, dilution of contaminants, and turbidity.” p. 16.
Water temperatures are a problem in most summers, especially when the LSZ is located in the Delta.
Hatchery
“Reintroductions will have to be done within a few years of loss of wild fish, into an environment with better capacity to sustain them.” p. 19.
The X2 location in fall offers good habitat in most years. The problem is that juveniles are unable to survive to get to LSZ. The carrying capacity of the LSZ in the fall is likely underutilized in most years. Adding hatchery fish now to surviving wild fish will be better than waiting for wild fish to be gone. It might be essential at this point.
Refuges
“If increasingly unfavorable temperatures for smelt occur, predicted as a result of climate change, then special refuges may have to be created that can take advantage of cooler water in the Sacramento River or from water that is piped in from some other source.” p. 20.
Existing refuges already need protection. The Ship Channel and lower Cache Slough refuges can take advantage of the cooler water exiting the American River near the Port of Sacramento River. Flow from the Fremont or Sacramento weirs could enhance Yolo Bypass flows and water temperatures. The LSZ-X2 refuge can be cooler if located west of the Delta and subject to the Bay breeze; maintaining x2 west of the Delta would require higher spring, summer and fall Delta outflow. Protection and enhancement of the Montezuma Slough refuge portion of the LSZ is possible through better Delta outflows and controls offered by the Montezuma Slough Weir.
Summary of Potential Recovery Actions
The following actions, if implemented soon, could lead to marked improvement in the population of Delta smelt.
- Limit entrainment. Minimize exports in spring, especially when pelagic larvae are found in the central Delta.
- Keep the LSZ out of the Delta, especially in warm, dry years. Use the Montezuma Salinity Control Weir to maintain Montezuma Slough in Suisun Marsh as part of the LSZ.
- Enhance the spring Delta inflows from the Yolo Bypass and San Joaquin River. Opening the Delta Cross Channel and installing the Head-of-Old-River and False River barriers will help. Closing the Knights Landing Outfall Gates in dry years will force more flow down the Yolo Bypass. Constructing the “Notch” in the Fremont Weir will increase flow through the Yolo Bypass. “Fixing” the entrance gate at the Port of Sacramento to the Ship Channel would allow additional Sacramento River flow input to the Ship Channel and lower Bypass.
- Stock hatchery-reared Delta smelt adults in the fall at X2 location, conditions permitting.
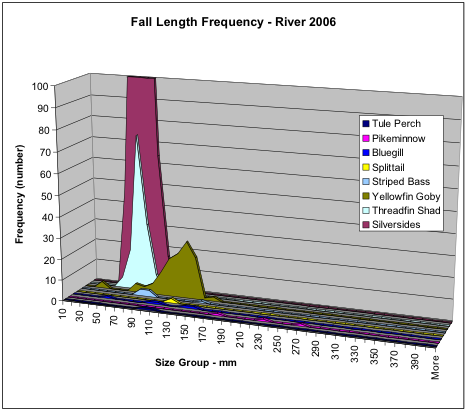
Figure 3. Numbers of fish collected in the fall of 2006 along San Joaquin River shoreline near Antioch by species and size. Note the extreme abundance of silversides, followed by threadfin shad and yellowfin goby. Note the very low numbers of striped bass.
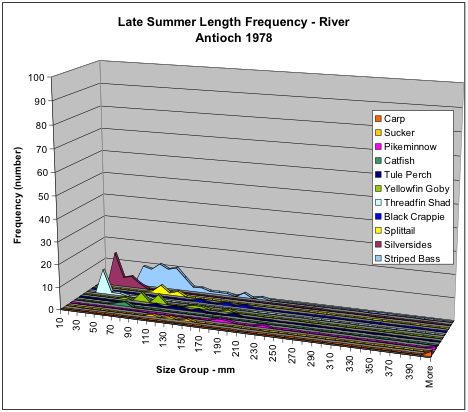
Figure 4. Numbers of fish collected in late summer 1978 along San Joaquin River shoreline near Antioch by species and size. Note the relatively high numbers of striped bass relative to silversides and threadfin shad.
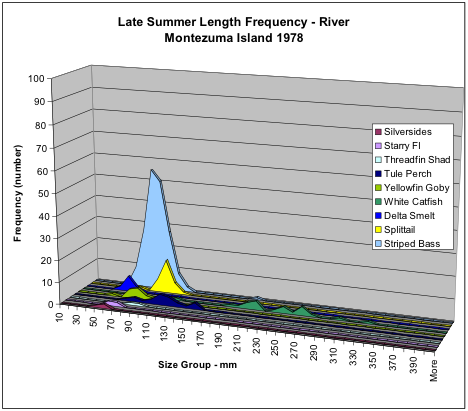
Figure 5. Numbers of fish collected in late summer 1978 in Sacramento River shoreline near Montezuma Island (adjacent to Collinsville) by species and size. Note the high relative abundance of striped bass young. Delta smelt were actually more abundant than silversides, yellowfin goby, or threadfin shad.
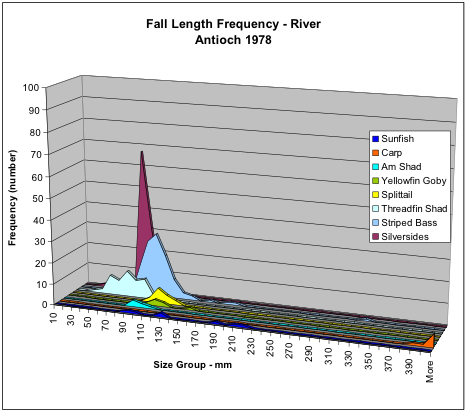
Figure 6. Numbers of fish collected in fall 1978 in San Joaquin River shoreline near Antioch by species and size. Note silversides were relatively abundant along with striped bass and threadfin shad.
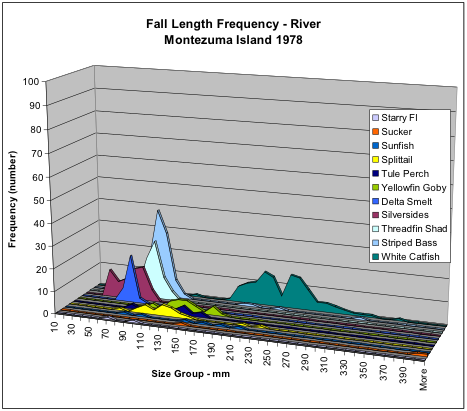
Figure 7. Numbers of fish collected in fall 1978 in Sacramento River shoreline near Montezuma by species and size.