Longfin Smelt Return from the Ocean

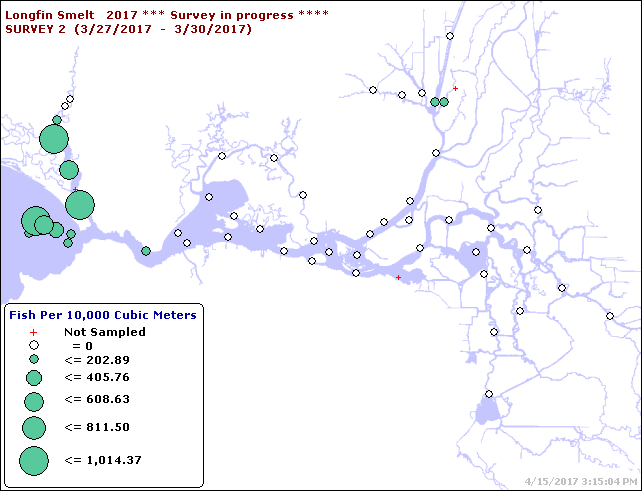
Back in December, I posted that longfin smelt may be gone.  Numbers were way down and early winter 2017 larvae surveys indicated a very poor spawn.  But suddenly in March, larval smelt began showing up in the CDFW 20-mm survey in San Pablo Bay and in the Napa River (Figure 1).  A bunch of adult longfin must have come in from the ocean and surrounding San Francisco Bay with this winter’s very high Delta outflows, and spawned in the Napa River.  While these larval densities are one or two orders of magnitude below previous wet year abundance (1999, 2006, and 2011), they are much higher than those observed in other years over the past decade.  Despite very low recruitment during the recent drought (2013-2015), they were able to muster enough 1-2 year-old adult spawners from around the Bay and nearby ocean to provide a decent spawn in the Napa River.  There appears to be some hope for longfin smelt after all.

Figure 1. Longfin smelt catch densities in March 2017 20-mm Survey. Source : CDFW 20-mm Survey.

Late-Fall-Run Salmon – Status

Late-fall-run Chinook salmon are unique to the Sacramento River. They migrate upstream to spawn below Shasta Reservoir in the Sacramento River in the late fall and early winter. Peak spawning is in the winter months. With emergence in the spring months, juveniles over-summer in the upper river above and below Red Bluff before commencing their smolt migration toward the ocean in the fall, when the lower river cools.

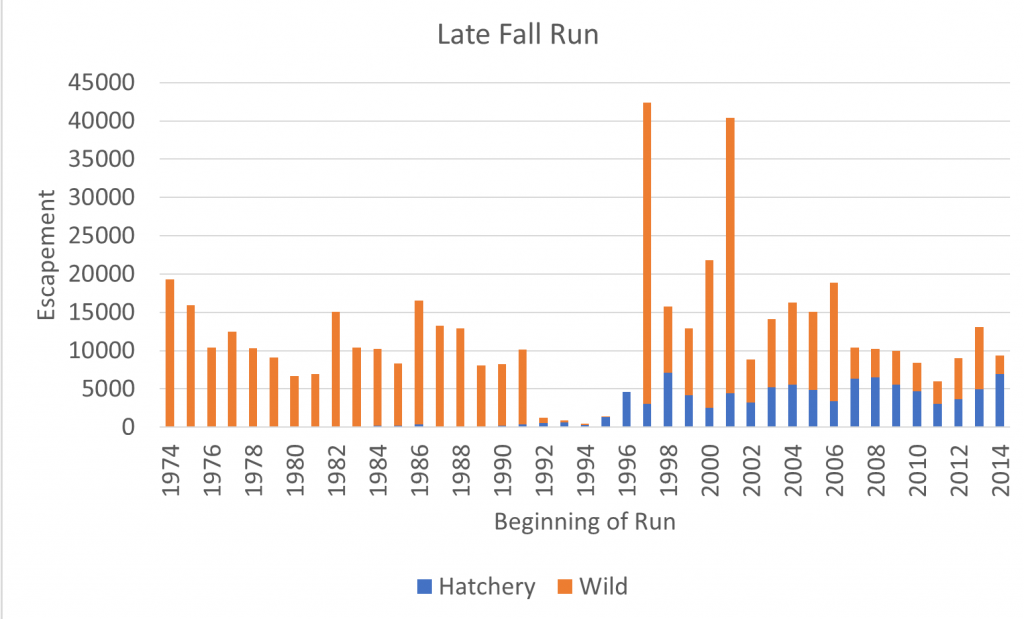
Numbers (escapement) of adults reaching the upper river spawning grounds have been estimated at the Red Bluff Diversion Dam (RBDD) fish ladders, in redd surveys, and in carcass surveys. The counts were accurate until 1991. Beginning in 1992 the RBDD gates were lifted in fall and winter, and ladder counts ceased. Accurate counts were obtained through other methods (aerial surveys, redd counts, and carcass surveys) beginning in 1998. A plot of escapement from CDFW’s GrandTab file (Figure 1) also shows the contribution of the Coleman hatchery returns in the escapement total. The inaccurate escapement estimates from the 1992-1993 fall/winter to the 1996-1997 fall/winter show clearly in Figure 1.

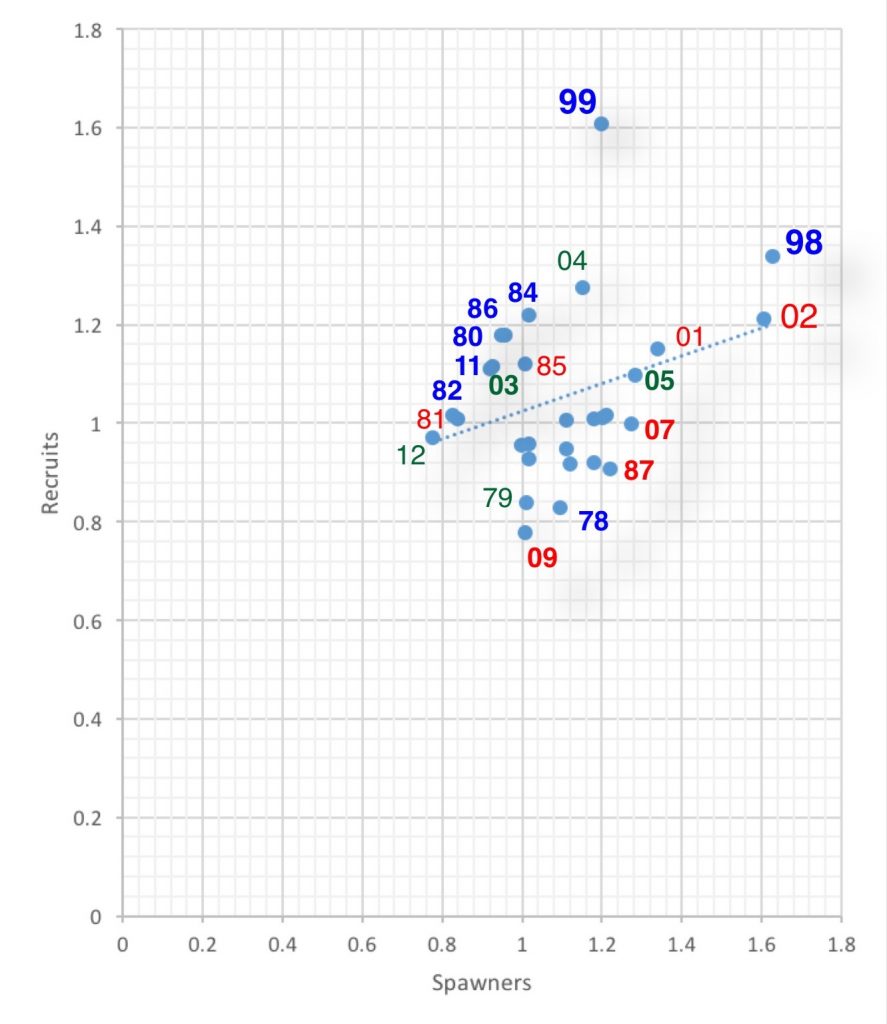
Keeping the accuracy of the counts (escapement estimates) in mind, I plotted recruits vs spawners (escapement vs escapement three years earlier) using the GrandTab totals for all years except 1992-1999, the years affected by the inaccurate estimates from 1992 to 1996. Figure 2 depicts the spawner recruit relationship with year labelled being the first rearing year (freshwater phase) for the recruits. A positive relationship between spawners and recruits is depicted with higher recruits per spawner in wetter rearing years. Wetter years generally have the following survival attributes:

  1. Better spawning conditions – higher flows, more gravel spawning habitat.
  2. Better incubation conditions – less redd stranding, better redd survival.
  3. More floodplain rearing habitat for fry.
  4. Less predation on juveniles from spring through fall.
  5. Better water temperatures spring through fall in rearing reach.
  6. Improved fall emigration conditions (flows, water temperatures, less predation, improved passage in the lower river and Bay-Delta).

Recruitment has been consistently low in recent drought years, which lacked the positive benefits I listed above. Removal of the RBDD gates after 1992, screening of large diversions, and more protective habitat conditions (flows and water temperatures) likely contributed to the population resurgence in the wetter year periods from 1995-2006. However, the droughts years from 2007-2015 have driven the population to such a low level that the run is now primarily sustained by hatchery production.

A recent assessment by CDFW1 recognizes the roles of these stressors on the late–fall-run salmon population. I quote from the assessment and comment below.

The effects of RBDD were more subtle. This dam apparently delayed passage to upstream spawning areas and also concentrated predators, increasing mortality on out- migrating smolts. Kope and Botsford (1990) documented that the overall decline of Sacramento River salmon was closely tied to the construction of RBDD. Raising the dam’s gates for much of the year to allow salmon passage apparently alleviated much of this problem. The gates are now open year-round, allowing uninhibited passage of adult and juvenile late fall-run Chinook salmon.

Comment: Eliminating the RBDD migration blockage and predator hotspot was important, but it also allowed predator access to the upper river in the spring-fall rearing period. The numbers of river spawners has continued to decline while the proportion of hatchery returns increases.

“Fish from Coleman National Fish Hatchery on Battle Creek are contributing at a low rate to the spawning population in the mainstem Sacramento River.”

Comment: The rate is no longer considered low. The population’s viability is in question with the large contribution by the hatchery.

Large pumping stations in the southern Sacramento-San Joaquin Rivers Delta (Delta) divert approximately 40% of the historic Delta flows, resulting in substantial modifications in flow direction (Nichols et al. 1986). Pumping also increases the likelihood of out-migrating smolts entering the interior delta, where longer migration routes, impaired water quality, increased predation, and entrainment result in higher mortality rates (Perry et al. 2010).

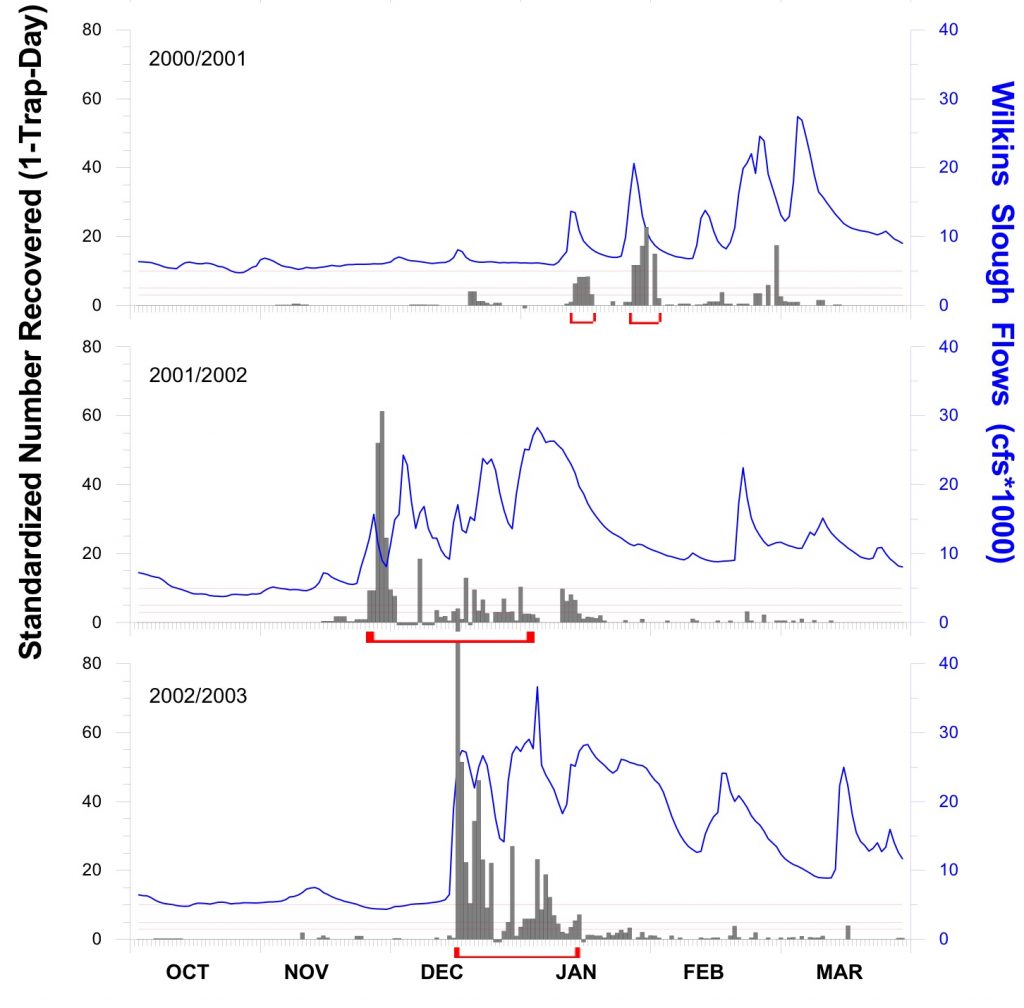
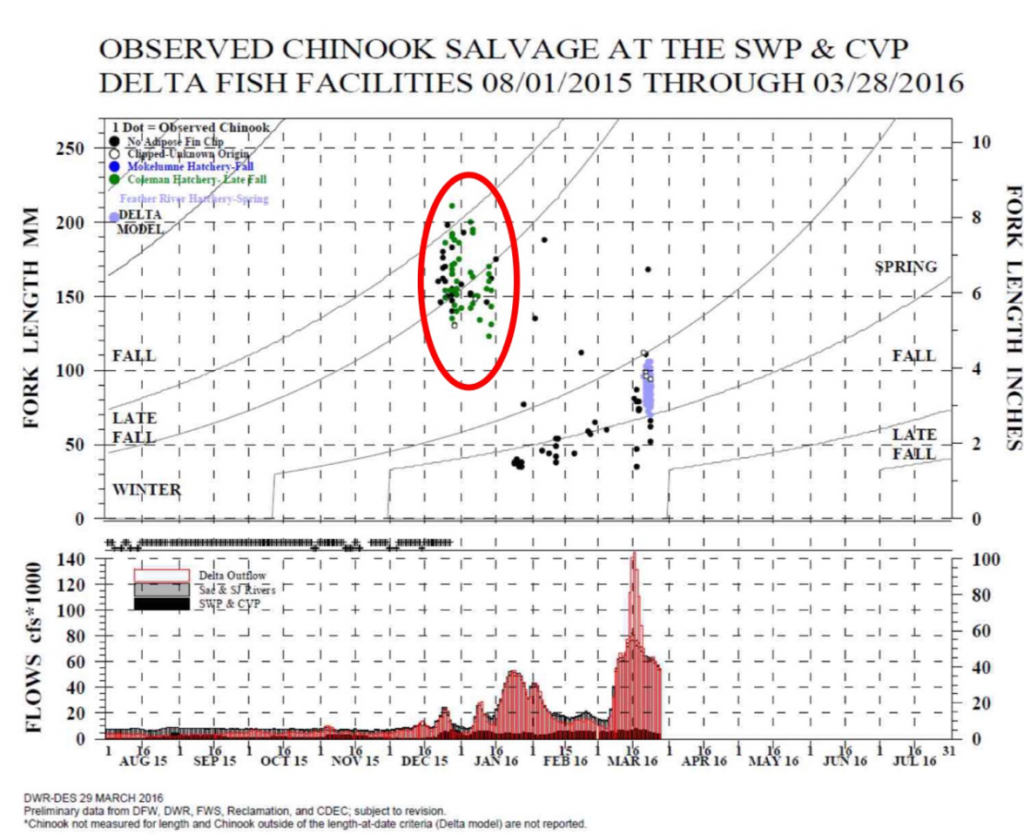
Comment: Wild and hatchery-released smolts move downstream toward the Delta with the first fall rains (Figure 3). Those that reach the Delta before the end of December are subject to an open Delta Cross Channel and high exports (Figure 4), and high rates of predation, which together likely contribute to the very low return rate of the late fall hatchery and wild smolts, especially from drier years.

Hatcheries. Late fall-run Chinook salmon have been reared at Coleman National Fish Hatchery on Battle Creek since the 1950s, even though the run was not formally recognized until 1973 (Williams 2006). The current production goal is one million smolts per year, which are released into Battle Creek from November through January (Williams 2006). Hatchery broodstock selection for late fall-run fish includes both fish returning to Coleman National Fish Hatchery and those trapped below Keswick Dam. Large numbers are needed because survival rates are low (0.78% at Coleman).

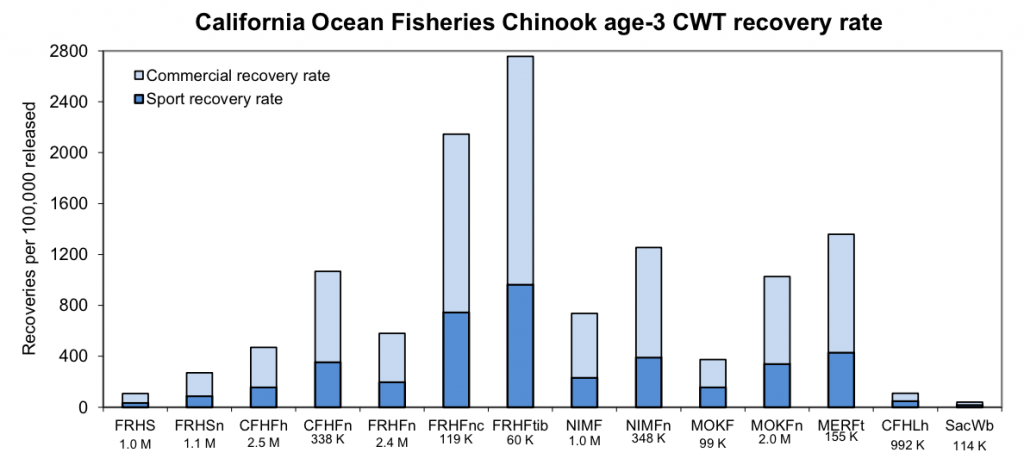
Comment: The return rate of late–fall-run smolts from Coleman as adults to sport and commercial fisheries is among the lowest from Central Valley salmon hatcheries (Figure 5), despite late–fall-run smolts being the largest hatchery smolts at release.

A wide array of actions have been prescribed for Central Valley listed winter-run and spring-run salmon and steelhead in recovery plans and biological opinions that will also benefit late fall salmon. Actions include improving spawning and rearing habitats, as well as river flows and water quality. Among these are a specific set of actions that would contribute most to the late-fall-run recovery:

  1. Do not release Coleman late fall hatchery smolts until after the first winter rains when the Delta Cross Channel is closed and Delta exports are limited by the NMFS OCAP biological opinion. (Present plans call for early January hatchery releases, whereas past releases were also made in November and December.)
  2. Provide a coincident flow pulse from Shasta Reservoir to the first downstream tributary rain pulse to stimulate wild late-fall-run smolt emigration from the Redding reach below Shasta/Keswick.
  3. In the event of significant natural fall flow pulses that stimulate emigration of wild late–fall-run smolts from the upper river, add releases of pulse flows from the Feather and American rivers, close the Delta Cross Channel, and reduce Delta exports to enhance passage to the Bay and Ocean.
  4. In drier years with minimal fall-winter rains, consider barging late–fall-run hatchery smolts from Knights Landing on the lower Sacramento River above the Feather River to the Bay. Straying problems identified for truck-transported late–fall-run hatchery smolts may be reduced with this approach, while markedly increasing smolt survival to the ocean. Maintaining the barge route to Sacramento water on the west side of the river may minimize imprinting (and subsequent straying) to the Feather and American rivers.

Figure 1. Late-fall-run Chinook salmon escapement estimates to upper Sacramento River 1974-2014. “Wild” means counted in the river not at the hatchery. Wild spawners may include a high proportion of hatchery origin adult salmon. Source: CDFW GrandTab.

Figure 2. Spawner-recruitment relationship for late-fall-run Chinook salmon in the upper Sacramento River below Shasta Reservoir. Numbers are Log10 -2 transformed. Year numbers are for rearing year in freshwater. For example: 99 dot represents rearing year when spawners from 1998-1999 returned as recruits in 2002-2003. Red bold designates critical water year. Red non-bold designates dry water year. Green bold is above-normal water year. Green non-bold is below-normal water year. Blue number is wet water year. Relationship is significantly positive with higher recruitment per spawner in wet years.

Figure 3. Screw trap large salmon smolt catch at Knights Landing fall-winter 2000-2001 to 2002-2003. Also shown is lower Sacramento River flow at Wilkins Slough gage. Source: CDFW

Figure 4. Salvage of young salmon at Delta export facilities from August 2015 to March 2016. Also shown is Delta inflow and outflow, and export rate. Red circle highlights late-fall-run salvage period with green dots being late–fall-run hatchery smolts. (Source: CDFW)

Figure 5. Return rate in sport and commercial fisheries of tagged Central Valley hatchery salmon. CFHLh denotes late fall releases at Coleman hatchery. Other release locations are Feather River (FRH), American River (NMF), Mokelumne River (MOK), Merced River (MER), and Sacramento River (Sac). W denotes winter-run, S spring-run, and F fall-run. tib denotes Tiburon, t denotes trucked, and h denotes hatchery site release. Source: CDFW.

Discussion on Delta Smelt

This past November’s science conference on the Bay-Delta included a discussion on Delta smelt.1 Some of the discussion points are presented in this post, with my comments.

The Delta smelt is adapted to an ecosystem that no longer exists. “Looking at the Delta smelt’s life history, their adaptations, their tolerances to different environmental conditions, and looking at the landscape of the Delta, that the state that the estuary is in now basically does not favor the continued existence of the species. Looking at its physiology or biology, it’s no longer adapted to this particular ecosystem, as we’ve progressively changed things through time.”

Comment: Delta smelt remain highly adapted to the Bay-Delta Estuary. However the habitats are so disturbed, especially during droughts, that little recruitment is possible, resulting in a long term decline in the adult spawning population that may not be reversible. Wet years and improved water management could possibly reverse this pattern and bring population recoveries, similar to those in 2010 and 2011.

There is no smoking gun. The proximate causes of the decline are interactions among multiple factors that have altered their habitat, making it increasingly unsuitable. “Looking at all the drivers that are associated with their population status, it doesn’t really appear to be a single smoking gun,” said Dr. Hobbs. “In each particular year, that there could be a series of different drivers that creep up that could basically lop off the population at any given time, and every year it could be somewhat different at different spatial and temporal scales, so it makes it really difficult to really point the finger at one particular driver, at least as the way the data was presented and analyzed in different papers.”

Comment: In nearly every case the “smoke” emanates from poor water management in dry and average water years, when Delta inflows, outflows, and exports are manipulated in ways that disturb the ecosystem. The other factors are simply secondary reactions to the gun’s discharge.

The population exhibited some resilience when in 2011, environmental conditions were good and abundance was at near historic levels, but unfortunately the current drought may have eroded such resilience. “In 2011, we saw good flows and cold temperatures, particularly through the summer and fall, and we got a pretty large return in adult abundance that year, so up through that time period, it appears that even though the population abundance was declined, the population still had the capacity to return, so there was still some resilience left in the population,” he said. “With this ongoing drought, we may be getting to the point where the population resilience is now reaching a point where it may not be able to return to previous levels if we give it the right environmental conditions only over a single generation. What’s really important for the species being annual is that it has to have consistent conditions, not for a single year, but for many, many years.”

Comment: It is not a matter of resilience. It is simply a matter of survival and recruitment, and maintenance of a viable spawning population. It is not the drought, but how the water management rules were weakened in the drought. In drought, the rules must be enhanced and enforced, not weakened, to protect the species.

The continued decline of the Delta smelt demonstrates the general failure to manage the Delta for the coequal goals of maintaining a healthy ecosystem while providing a reliable water supply for Californians. Dr. Hobbs noted that this was something that was debated amongst the authors. “When the idea of the coequal goals was brought up, it was a great idea, but if you think about it, it was being implemented at a time when we were already taking close to 90% of the freshwater out of the estuary, so the fish were already well behind the curve,” he said. “We basically came out and said, ‘we’re try to manage coequally,’ and we weren’t really at a 50/50 state at that point. We don’t seem to have the capacity to bring this back to a level where it could be a 50/50 share between water for people and water for fish.”

Comment: This is just simply confusing. Coequal protection of beneficial uses does not mean that fish get 50% of water and other uses get 50%. And someone would have to be a little more precise in defining 50% (or whatever percent) of what. Fish have basic needs that protect them from extinction. Water management must work around these needs. The problem is most acute in dry years and droughts. But better allocation of water is needed in all years so enough is available at least for triage of all uses in multi-year droughts.

“We sort of put it in the terms of the coequal goals, but it’s really a failure of all of us, I think, said Dr Hobbs. “I take a lot of personal responsibility for the failure because we have a lot of science that takes a long time to get out and communicate to the public and some of that information could really be implemented on a much more rapid scale. I know a lot of other folks I talk to feel sort of responsible too because it’s under their guise to try to manage and protect the species, and we’ve continued to fail. And honesty longfin smelt is right behind them.”

Comment: The responsibility for this grand failure does not lie with the scientists. It lies with the water managers and the agencies who compromised in negotiations on water rights, water quality standards, and biological opinions. Co-equal goals does not mean “cutting the baby in half.” It means equally maintaining the viability of the two beneficial uses, which obviously does not happen.

Moderator Randy Fiorini asks Paul Souza (USFWS): “What did you find usable in this report, which represents the best available science?” “I think it’s extraordinarily helpful in terms of a synthesis of where we stand with Delta smelt,” Mr. Souza answered. “Clearly we’re in the emergency room. This is a species that has had a precipitous decline, it’s on the brink of extinction, and in situations like this, it becomes extraordinarily challenging.”

Comment: Yes it is very difficult to revive half a baby. The important thing is to keep the next baby, if there is one (however small), alive and healthy. If there is, maybe we can make an extra effort in nurturing it to adulthood.

“One of the things that I learned from this work is that there is no silver bullet,” Mr. Souza continued. “There are a lot of different activities that must be accomplished, which makes it truthfully more difficult. The more standard situation for very imperiled species is that you have one significant driver that you can address – for example habitat loss for terrestrial species.”

Comment: There most certainly is a “silver bullet,” but it is made of H2O.

“The Delta smelt, clearly as described in that paper, is among the most imperiled species in the country,” Mr. Souza said. “I think it’s important to also understand that it has as much political attention as arguably any species in the country as well. The situation is truly an interesting one from a conservation perspective. We have a very small fish that’s had a dramatic decline that is in the heart of the water supply for the biggest state in the union, and also provides water obviously for agriculture which is among the most productive in the world. So with that, and all of the development pressures that we’ve seen, we have this unique complex situation to deal with.”

Comment: This is exactly why the Endangered Species Act was enacted. Are we going to protect the largest and most important estuary in California and the western United States or not?

“Going back to the real challenges that the paper describes, we have to figure out how to make incremental progress in the face of uncertainty, and the Delta smelt resiliency strategy is something I’m very excited about,” Mr. Souza said. “I want to give kudos to the State of California for the leadership they’ve provided. It outlines 13 different activities that we think could be helpful in that regard. So truthfully, I’d love to hear from you, Jim, among those 13 activities, which would you prioritize, and why, and which do you think are going to be most promising to help the species get in a better condition?”

Comment: If the Strategy outlined was so exciting, why wasn’t any of it implemented in 2016? The Strategy simply is cutting the baby into thirds.2 “Kudos” to the State for simply recognizing its long-held responsibility.

“I think the number one thing that we should do is to address the outflow issue,” responded Dr. Hobbs. “We need to think hard about what kind of outflow, when, where, and what kind of intensity. The work that was done by Ted Sommer this summer, collaborating with some of the ag folks and getting water down the Toe Drain of the Yolo Bypass was the lowest hanging fruit. Very little water was needed to necessarily get that productivity moving from the Toe Drain into the North Delta arc area. I think that’s the place we should start, considering the state of affairs with the amount of water we have.”

Comment: Yes, water is the silver bullet in the form of Delta outflow. Think of Delta outflow as the powder charge that delivers the silver bullet. However, a little bit of hot, dirty, ag water in summer from the Yolo Bypass is not3 much powder. Prejudging the amount of water available and needed is also not a way to start.

“We’re probably going to have a little bit of water to do summer flow pulses or fall flow pulses so we need to think really strategically about where we put that water, rather than just putting it down the middle of the Sacramento River where 200,000 acre-feet will hardly be even measurable,” said Dr. Hobbs. “If we put this in novel places, we might be able to create the habitat conditions that will be supportive of the species.”

Comment: Why just summer or fall? Why just pulses? 200 TAF of water down the Sacramento River or 1000 cfs for 100 days is a lot of water, which would provide measurable benefit to the river, Delta, and Bay particularly in a dry year. And why just 200 TAF, when ag takes more than 10,000 TAF?

“Coming back to the Yolo Bypass issue, some of the work we’ve been doing recently is that there are a large number of Delta smelt actually residing in the Toe Drain area for a long period of time, and some even staying over the summer and becoming full freshwater resident fish living in that habitat, so that region is clearly one of the most important areas for smelt right now,” said Dr. Hobbs. “We do have the capabilities of providing what water we can provide in that particular habitat, so that’s where I would start.”

Comment: There is no evidence that smelt survive the hot summers in the Yolo Bypass or in the Delta. The most important action is to keep the low salinity zone habitat of the smelt downstream of the Delta in Suisun Bay with more outflow in drier years. 250 TAF of water (see next quote) could help do this in many years.

“Of the 13 provisions in that Delta smelt resiliency strategy, the one that’s probably going to be the most challenging, the most costly, and the most controversial would be the outflow test of 250,000 acre-feet of water,” said Mr. Souza. “We know that water is a precious commodity; there is no free lunch. If that water is acquired for a test, it’s going to come with some tradeoffs.”

Comment: Why is water not available to maintain key beneficial uses protected by State laws, and why is it not free? Why is more of the natural flow being allocated to water rights each year? Why isn’t water used for human use not taxed like the State’s carbon tax to help purchase more water rights and restore more habitat lost to development? Why aren’t the co-equal goals to protect the environment being addressed?

“That really is the place that I find fascinating in the work that we do,” said Mr. Souza. “It really is the interface of science and policy. How do you make these choices, and similarly, how do you get meaningful results from these 13 different tests that are going to allow us to get better? That is really all that we can ask of ourselves is try to get a little better and to try to make some incremental progress in the face of these extraordinary challenges.”

Comments: A “little better” and “some incremental progress” are not going to cut it. The interface of science and policy is longstanding: it is the policy and management that have prioritized the water supply side of resource allocation.

“I’d love to get your thoughts, Jim, about how we actually measure success,” said Mr. Souza. “These 13 actions I think are all important and I’d love to see them all done as fast as possible. Clearly some are easier than others, some more costly than others, but one of the things that I’m already seeing as a significant challenge is how do we know if they are making a difference? When you have a species that is in such a precarious position that’s so hard to find, how can you craft goals and objectives at the population level that we can then implement these 13 provisions and actually measure whether there’s a biological response that is meaningful and a result of the actual test themselves?”

Comment: There are a dozen metrics that provide a measure of smelt performance. These metrics have been available for a decade or more. For each identified action, managers could apply one or more of these metrics to numerically assess the response in the smelt population.

“I think we have the tools to do that,” said Dr. Hobbs. “We have a strong scientific group of people here who have a diverse set of skills. We have really nice conceptual model and a good synthesis of Delta smelt biology. We could use that framework with those strategies in an adaptive management context and look at each of those things that we’re going to do, and with the scientific community come up with the measurable objectives.”

Comment: the tools and metrics are well developed, but objectives are lacking, as are measures that protect the smelt and their habitat.

“In some of those situations, we may not be able to measure the response in Delta smelt themselves, but we could look at the conceptual model and look at different parts of that system for positive results,” said Dr. Hobbs. “For instance, this summer we saw a decent phytoplankton bloom that was associated with water coming down the Toe Drain and some zooplankton production. We are going to have to rely on the fish being able to respond and if they are at such low abundances that we don’t see a population level response in our surveys, maybe we need to be including additional types of monitoring in adaptive scientific field experiments and searches for Delta smelt in these places so that we can do this. The Yolo Bypass is monitored by DWR, but we don’t really have a broader concerted resource to go after doing this on the real time scales that we actually need to do be doing it.”

Comment: The bloom mentioned was minor and occurred where there were no smelt. At the same time, a larger independent bloom occurred downstream in the low salinity zone as a result of classic estuary dynamics (an unrelated pulse of outflow4), along with a recent high abundance of young smelt triggered by wet year Delta hydrodynamics.

“Specifically referring to the recovery plan, there were a series of actions that were discussed, and really none of them were really done,” said Dr. Hobbs. “That was probably because at the same time, the Bay Delta Accord was being put into place to manage flows and to keep the low salinity habitat in the right place in Suisun Bay for a certain amount of time, and that was part of that plan. It wasn’t specifically the main objective and it wasn’t the only thing that was being recommended, but because we were coming together and forming this California and federal coalition to address the issue, I think a lot of effort was put there on that particular issue.”

Comment: Much of the Recovery Plan was not adopted or updated over the past two decades based on performance. The key specified action in the plan was simply keeping the low salinity zone in Suisun Bay rather than upstream in the Delta. Instead, dry water year water allocations were almost entirely allotted to water supply, to the detriment of ecosystem.

“I’ll first make the point about recovery plans,” said Mr. Souza. “They do a wonderful job of bringing scientists together, and if they are really strong, they actually bring policy makers together and the regulated community together and identify a blueprint for going forward. What they don’t do is appropriate funding. And so there are lots of plans that have been put together that have never had the capacity to have full implementation; that’s just the reality of conservation wherever we are.”

Comment: I am not sure about this general statement. The problem really is the plans – they do not provide the protection the smelt need. The Recovery Plan and water quality standards are over 20 years old. The OCAP biological opinion in 2008 lacked adequate protections and is being revised.

“There is a real danger in threatened and endangered species conservation and ecosystem management more broadly speaking, when we focus too much on a single species,” he continued “We in the Fish and Wildlife Service have been criticized in the past for single species management to the detriment of other species. We’re at our best when we’re thinking about the ecosystem and multiple species and trying to find the optimization of habitat conditions for them, not the maximization for any one in particular.”

Comment: This is really a bad excuse for not protecting the Delta smelt, which was originally chosen as the “canary in the coal mine” for the Bay-Delta and all its species. I know of no species hurt by smelt protective actions, but many that benefit from them.

“We really need to focus on the tone of the conversation and how we talk about Delta smelt, and I would really love to recast this as a conversation about the Bay Delta and a shared vision,” said Mr. Souza. “The best most important conservation successes that I’ve seen in my career are grand compromises where we sit down with the affected community, we have a focused conversation about the needs of agriculture, and municipalities, and wildlife, and their habitats, and we again maximize none of those interests but do our best to optimize all of them.”

Comment: I have been involved in such sit-downs for the Delta for 40 years. I have seen many grand compromises that keep cutting each reboot of the Bay-Delta in half. One half to the tenth power is a tenth of one percent. There is no optimizing for all. Something has to give.

“We have to foster a community where we’re all in this together, because we all love the same resource, and it’s extraordinarily precious to all of us,” said Mr. Souza. “Only together are we going to be able to find a path forward where we’re doing the best that we can for this ecosystem, and it needs to move beyond a conversation where people are pitted against wildlife. That is a losing proposition for conservation and I challenge all of us to help be a part of that more positive dialog.”

Comment: We all do not share the love for “the little three inch fish”. I doubt the new Secretary of the Interior will share the love that Mr. Souza holds for Delta smelt.

Question from the audience: “I greatly appreciate your comment that single species management is almost certainly not going to be effective as multispecies ecosystem management, but I think one of the frustrations that we have all experienced in this particular system is that regardless of whether we’re using the science to inform single species management, or using the science to inform multispecies ecosystem management, is that the science is presented and recommendations are made but in fact actions are not taken. Many times the scientific advisory boards or councils or workgroups that advise specific actions and the agencies chose not to do it, so I’d like to you to respond to this relationship between the science and the decision making?”

Comment: Great question.

“My first reaction to it is that science is the foundation of decision making that’s strong for conservation,” responded Mr. Souza. “But in nearly every instance, there are ten policy legal choices that can be made with the same science, and so the real art for a policymaker is figuring out how to use that science in a way that not only is going to address the issue of the moment, but is going to be strategic in helping to facilitate the kind of relationships necessary to do something bigger together in the future than any of us could do alone.”

Comment: My, my. Enough from Mr. Souza.
Sacramento River Fall-Run Salmon – Status and Future

Have poor ocean and river conditions during the recent 2012-2015 drought contributed to a collapse of the Sacramento fall-run salmon population as they did during the 2007-2009 drought? Has trucking hatchery smolts to the Bay in the recent drought helped maintain the fall-run population?

I discussed these and related topics for the San Joaquin River fall-run salmon in a post on February 13. In this post, I turn to the Sacramento and its tributaries.

In a March 1 post on its daily blog, the California Department of Fish and Wildlife predicted poor salmon runs this year:

Chinook that will be harvested in ocean fisheries in 2017 hatched two to four years ago, and were deeply affected by poor river conditions driven by California’s recent drought. CDFW and federal fish agency partners have expended millions of dollars on measures to minimize the impacts of the drought. These efforts have included trucking the majority of hatchery salmon smolts to acclimation pens in the lower Delta, improving hatchery infrastructure to keep juvenile fish alive under poor water quality conditions and partnering with sport and commercial fishermen to increase smolt survival. Though all of these efforts helped, other environmental factors – such as unusually warm water conditions in the ocean – were beyond human control.

While CDFW’s statement is true for the most part, and many of the Department’s efforts were commendable, there are additional factors that also were important:

  1. Water management strategies during the drought that prioritized water supply over salmon greatly affected river conditions, especially in mainstem rivers (Sacramento below Keswick, lower Feather, and lower American). Adult salmon and egg/embryo survival were compromised by warm, low flows below dams.
  2. Many of the hatchery trucks released their smolts in the Delta near Rio Vista rather than in the Bay. Many smolts were also released near the hatcheries. Both measures led to higher predation on smolts in the warm, low river flows that were characteristic of the drought years.
  3. There were many factors that were within human control that contributed to poor salmon survival and production. Chief among these was the failure to maintain prescribed flows and water temperatures below dams. Flow and water temperature prescriptions to protect fish were weakened during the 2013-2015 critically dry water years.

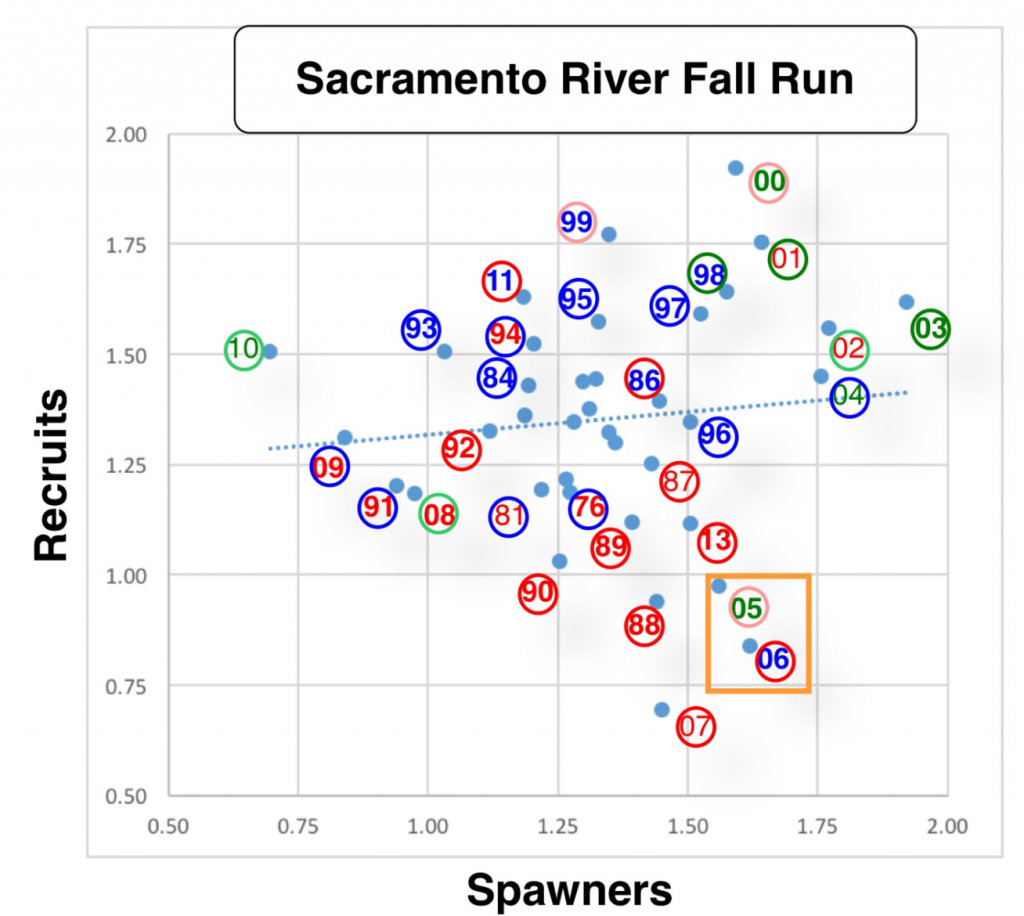
There was ample evidence and known circumstances that another population collapse was possible. Such evidence included the limited recovery during the wetter 2010-2012 sequence, and the effects of the 2013-2015 drought had begun to show (Figure 1). Most notable was the sharply lower number of spawners returning in 2015. Brood year 2014 spawners produced very low numbers of young in the winter-spring of 2015.1

A close look at recruitment per spawner in the population over the past 40 years (Figure 2) provides clear evidence that recruitment suffers in dry winter-spring rearing years or dry fall spawning years. These factors overwhelm the background relationship between spawners and recruits three years later. Patterns in Figure 2 indicate:

  1. Recruitment is significantly depressed in drier years compared to wetter years. The major contributing factor is likely poor survival of juveniles in winter-spring of their first year.
  2. Recruitment is severely depressed for brood years rearing in critical years and returning as adults two years later in critical years (e.g.,1988-1990, 2007, 2013).
  3. Recruitment can be depressed for brood years with good winter-spring juvenile rearing conditions but poor conditions before adults return (e.g., 2005, 2006).
  4. Recruitment can be enhanced for brood years with poor winter-spring young rearing conditions but very good fall conditions for returning adults (e.g., 1994).
  5. There may be an underlying positive spawner/recruit relationship, but it is overwhelmed by the effect on recruitment of flow-related habitat conditions.
  6. Poor ocean conditions in 2005-2006 likely contributed to poor recruitment.
  7. The increase in the relative contribution of hatchery fish is a concern2 as is the declining contribution of mainstem spawners (see Figure 1). With estimates that up to 90 % of the spawning population are fish of hatchery origin, and very little evident genetic diversity, the population is already nearly totally dependent on hatcheries. California sport and commercial salmon fisheries, which depend for the most part on the fall-run salmon, will remain dependent on fall-run hatcheries well into the future.

Present enhancement efforts will help sustain the population and fisheries. Habitat restoration and improved spawning-rearing-migration conditions (flows, water temperatures, and physical habitat) will help increase natural production. Upgraded infrastructure, improved transport (i.e., trucking and barging), and hatchery fry floodplain rearing could improve hatchery contributions. Improvements in hatchery and natural population genetic diversity would help sustain healthy populations into the future.

Figure 1. Sacramento River fall-run Chinook salmon spawner abundance (escapement) from 1975 to 2015. Source: CDFW GrandTab.

Figure 2. Sacramento River spawners versus recruits three years later from escapement estimates (Log10X – 4 transformed). Note that some variability likely occurs from a low number of 2 and 4 year-old spawners in the escapement estimates. Numbers are sum of hatchery, mainstem, and tributary estimates from CDFW GrandTab database. Number shown is rearing year (winter-spring) following fall spawning year. For example: “88” represents rearing year for 1987 spawning or brood year. These fish returned to spawn (recruits) in 1990. Bold red years are critical water years. Non-bold red years are dry water years. Blue years are wet water years. Bold green years are above-normal water years. Non-bold green years are below-normal water years. Red circles represent adult return years being drier water years. Blue circles represent return years being wet water years Green circles represent return years being normal water years. Orange square denotes rearing years with poor ocean conditions.

2017 Klamath Chinook Run – “Disaster or Catastrophe?”

The Klamath River Chinook salmon fall run is expected to be a record low in 2017.1 Predictions are near or below the record low run in 1992. These record low runs followed extended droughts from 2013 to 2015 and 1990 to 1992, respectively.

A very low run in 2016 prompted the Yurok Tribal Council to cancel its commercial fishing season to protect future fish populations. The 2016 salmon allocation was the second lowest on record, and failed to provide each tribal member a salmon. The Tribe did not serve fish at the annual Klamath Salmon Festival for the first time in the event’s 54-year history. In January 2017, the federal government issued a disaster declaration for the 2016 Yurok Tribe fishery.2

An April 6, 2017 article in the Eureka Times Standard stated:

  • Tribal fishery scientists such as Michael Belchik of the Yurok Tribe stated the low return of spawners is the result of several severe years of drought conditions and river management practices, which caused the waters to warm and become hot beds for toxic algae and deadly parasites. In 2014 and 2015, up to 90 percent of juvenile Chinook salmon on the Klamath River are estimated to have died from an intestinal parasite, believed to be a major cause for this year’s low run, as were poor ocean conditions…. “All these things together conspire to create a real catastrophe for fisheries,” Karuk Tribe Natural Resources Policy Advisor Craig Tucker said.
  • Organizations see dam removal and changes to the federal government’s management of the river as being key solutions to the underlying causes of this year’s low salmon return.” “The solution for this problem is to remove the Klamath dams now,” Pacific Coast Federation of Fishermen’s Association Executive Director Noah Oppenheim said.

A Yubanet article described the expected ancillary effect on the whole California coastal fishery:

The disaster stems from a crash of Klamath salmon stocks, but in order to protect the few Klamath fish that are in the ocean, fisheries regulators have little choice but to close or nearly close the economically valuable commercial and sport fishing seasons along the length of the Northern California and Oregon coastlines. This will impact tribal and non-tribal families alike.

CDFW stated: “Chinook that will be harvested in ocean fisheries in 2017 hatched two to four years ago, and were deeply affected by poor river conditions driven by California’s recent drought.”

A UC Davis study placed some of the blame on hatcheries. “My results suggest that hatcheries’ harm to wild salmonids spans the entire Klamath River basin. For fall Chinook salmon, the decline is concurrent with increases in hatchery returns – a trend that could lead to a homogenous population of hatchery-reared Chinook”.

Having been involved in the Klamath River for 40 years, I provide some of my own insights in this post. In follow-up posts, I will take a closer look at the Scott and Shasta rivers, the two main salmon tributaries of the upper Klamath that contribute substantially to the overall upper Klamath salmon run.

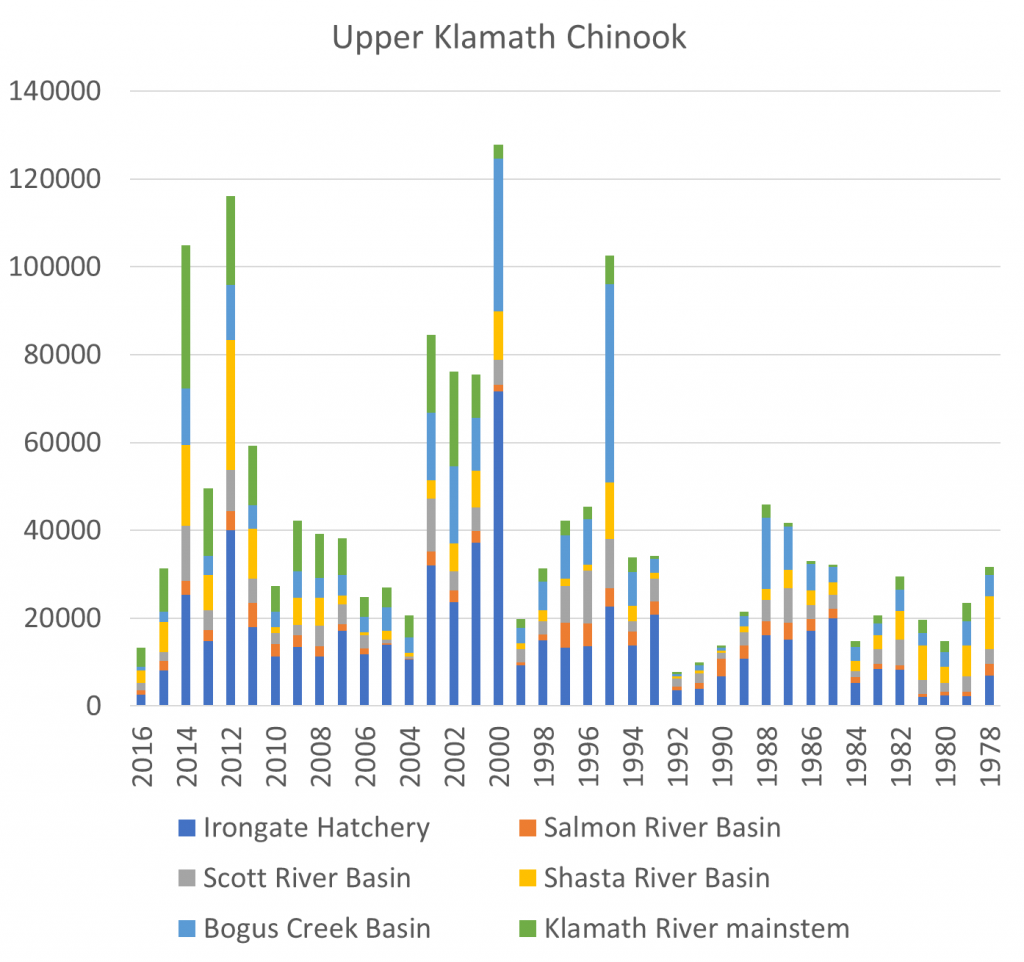
A summary of the overall Klamath salmon run escapement numbers or spawner estimates for the past 40 years is shown in Figure 1. The spawning numbers in 2016 were low, yet this drop came only two and four years after near record runs. Contributions for all six upper Klamath subcomponents in 2016 were down substantially from 2014. Predictions of a poor run in 2017 come from the low number of two-year-old “jack” salmon in the 2016 spawning run.

The question is: why did the strong run in 2014 produce the expected record low run in 2017? And why did the strong run in 2012 produce the weak run in 2015? And on the flip-side, why were the runs in 2012 and 2014 so strong, especially given they occurred during the recent multiyear drought?

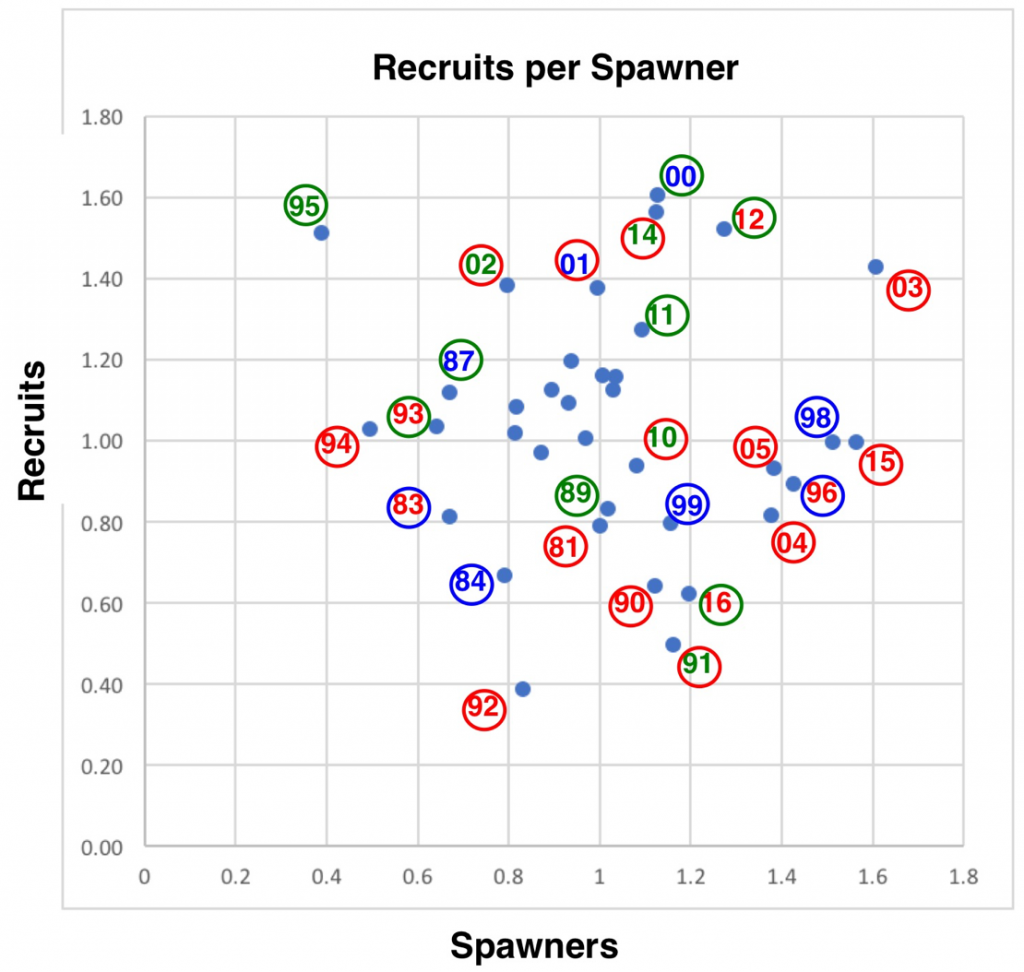
A close look at the spawner-recruit relationship (Figure 2), how recruits are related to the number of spawners three years earlier, provides further insight into factors controlling long-term recruitment.

  1. The spawner-recruit relationship is weak at best, reflecting the fact that estimates might be poor and/or that other factors are more important than just the number of spawners. The 1995 recovery after the record low 1992 run provides compelling evidence that survival and recovery can be strong even from the weakest of runs (with strong hatchery support – see hatchery component for 1995 in Figure 1). Unfortunately, 2017 appears to suggest that strong runs can produce very weak returns three years later if other factors such as drought are dominant.
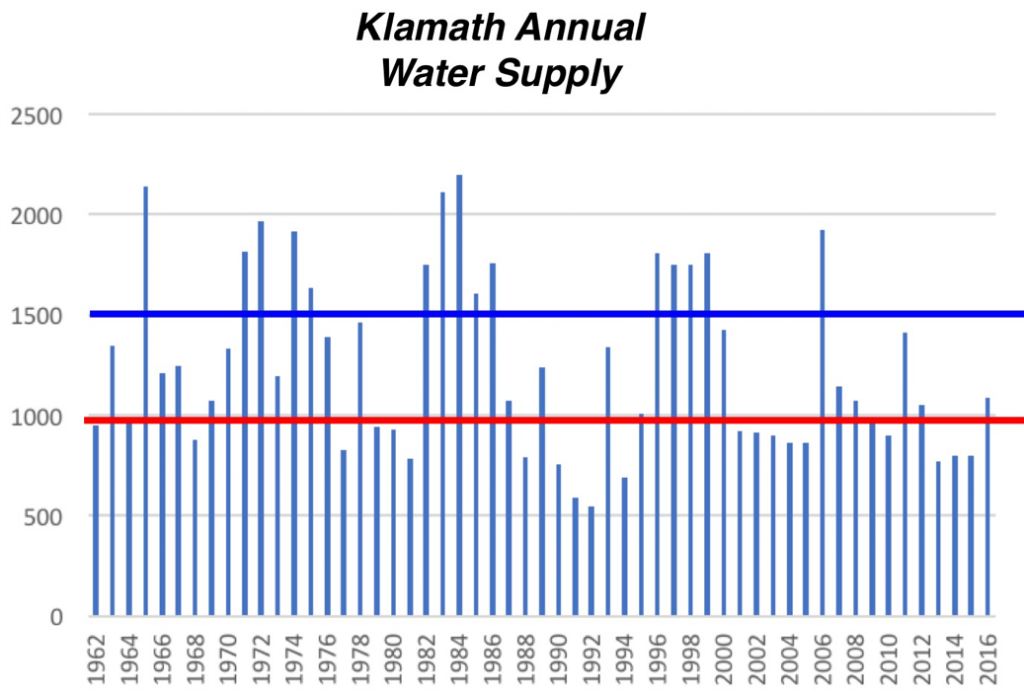
  2. The population crashes (2016, 2004, 1992) occurred after multi-year droughts (Figure 3). Multiyear effects compound changes to sediment, pathogens, and water quality, the suggested causes of these crashes.
  3. Population expansions (2012-2014, 2007-2009, 2000-2003, 1995-1997, 1985-1988) occur after a series of wetter years.
  4. There may be some underlying effect of floods, as indicated by the poor run in 1999, a consequence of the New Year 1997 flood that washed out the fall 1996 spawn.
  5. The poor run in 2016 and the expected record low run in 2017, in addition to the effects of the 2013-2015 drought, may have been affected by poor ocean conditions, as was believed to be the case in the poorer than expected 2004-2006 runs.
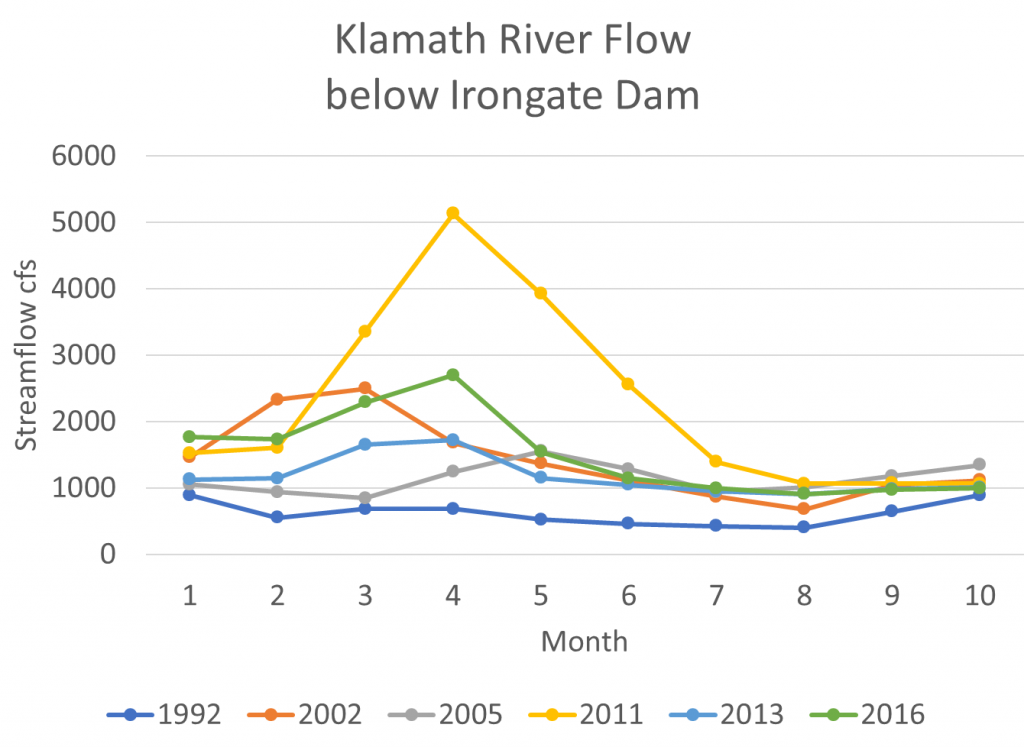
  6. Several factors potentially affect production or survival per spawner: conditions during the spawning run (flows, water temperature, disease, upstream passage hinderances, etc), first year rearing and emigration conditions (flows, water temperature, predators, prey, disease, toxins, etc), and ocean conditions. It is likely that flows throughout the water year (Figure 4) have some effect on survival of the affected or subsequent brood years.
  7. The contribution of the Shasta River appears to have increased in recent years, likely as a result of the Nature Conservancy’s efforts at Big Springs (more on this in an upcoming post).

Overall, the droughts of 1990-1992 and 2013-2015 (Figure 3) were likely the single most important factors in the upper Klamath Chinook salmon population dynamics. The role of the Irongate Hatchery contributions seems relatively stable and a likely important contributor to recoveries after drought. I was unable to determine the contribution of hatchery salmon to the other components of the run, but it is likely a large factor in the Bogus Creek and upper Klamath elements. It is possibly a lesser factor in the Salmon, Scott, and Shasta river elements, which speaks to the importance of these potentially “wild” runs.

In closing, some thoughts on potential solutions:

  1. Knowing a good run was occurring in drought year 2014, managers could have done more to protect the spawners, eggs-embryos, and subsequent rearing-emigrating juveniles with better flows and water quality. Perhaps the recent federal court decision may help ensure future protections. In poor water supply years like 1990-1992 and 2013-2015 (Figures 3 and 4), water managers simply must provide protections for salmon.
  2. Future removal of the four dams may help reduce the adverse multiyear effect of droughts on disease and water quality and may provide additional spawning and rearing habitat.
  3. Much more could be done to increase run components from the Scott and Shasta rivers (more on this in upcoming posts).
  4. The hatchery program is long overdue for reform and upgrade. The program should shift from production to conservation of fall-run and spring-run Chinook, Coho and steelhead.
  5. These and other suggestions are discussed in a prior post.

Figure 1. Chinook salmon escapement estimates to the upper Klamath River including Irongate Hatchery, Bogus Creek, Scott River, Salmon River, Shasta River, and Klamath River mainstem below Irongate Dam. The preliminary prognosis for fall 2017 total escapement is 11,000. Source: http://www.pcouncil.org/salmon/background/ document-library/#EnvironmentalAssessmentsalLib

Figure 2. Spawner-Recruit relationship for upper Klamath River fall-run Chinook salmon population. The number is the transformed (log10X – 3.5) escapement estimate for the fall of that year as shown in Figure 1. The color represents winter-spring hydrology conditions in the Klamath River two years earlier when this brood year was rearing in river habitats. Red is dry, green is intermediate, and blue is wet (from Figure 3). Circle color represents late summer water year conditions in numbered year. For example: year 92 represents the recruits in fall 1992 from brood-year 1989 spawn that reared in 1990 winter-spring (red dry year); the red circle represents dry conditions in late summer of that water year (1992). Note that the spawning run for 2002, the year the large die-off of adult salmon occurred in the lower river due to low flow and high water temperatures, likely contributed to the poor returns (recruits) in 2004 and 2005.

Figure 3. Average annual discharge by water year (10/1-9/30) of Klamath River as measured at Link River near Klamath Falls, Oregon. Data source: https://waterdata.usgs.gov/nwis/ annual?site_no=11507500&agency_cd=USGS&por_11507500_113138= 545477,00060,113138,1962,2017&year_type= W&referred_module=sw&format=rdb

Figure 4. Monthly average flow (cfs) in Klamath River below Irongate Dam in selected years. Year 2011 was a wetter year. Year 1992 was a critically dry year. Years 2002, 2005, and 2013 were dry years. Year 2016 was an intermediate water year. Source: www.waterdata.usgs.gov.