The key to saving the Bay-Delta Estuary and its native fish community is keeping the Low Salinity Zone (LSZ) and its brackish water out of the Delta, especially the south Delta where the federal and state project pumps are located. The native fish of the estuary, both in the Bay and Delta, depend on potency or productivity of the LSZ. Much research has shown that low Delta freshwater outflow allows the LSZ to move into the Delta, to the detriment of overall ecological productivity and of the survival and production of native fish (and most pelagic species and their food supply). Allowing the LSZ to move into the Delta allows the export of the LSZ from the south Delta, to the detriment of native fish and their critical habitats. Increased salinity also harms agricultural and municipal water supplies.
Keeping the LSZ out of the Delta means keeping salinity (as measured by electrical conductivity or EC) below 500 EC. The 500 EC level is sometimes called the “salt front” or the upstream head of the LSZ. Another measure of the LSZ is X2, the heart of the LSZ, approximately 3800 EC. The State Board has defined the Emmaton gage on the Sacramento River channel and Jersey Point gage on the San Joaquin River channel as the western edge of the Delta in terms of Delta agriculture and set wet year standards of a maximum 500 EC for the spring to fall irrigation season. These standards have kept the LSZ out of the Delta in summer of wet years to the benefit of Delta agriculture and native fishes (and non-native striped bass). However, the standard is also needed in the non-irrigation season when high Delta exports often occur.
Suggested measures to save the Delta:
- Do not allow south Delta exports to exceed a minimum (often prescribed as 1500 cfs) when Jersey Point and Emmaton gages exceed 500 EC.
- Place barriers on False River and Dutch Slough channels when their gages may exceed 500 EC.
- Open the Delta Cross Channel (DCC) to maintain a balanced EC at the Jersey Point and Emmaton gages and ensure positive outflow from the Delta at Jersey Point (often referred to as a positive QWEST). Closure of the DCC when EC rises at Jersey Point is detrimental to the LSZ when south Delta exports exceed 1500 cfs.
- Restrict Old and Middle River (OMR) negative flows to protect salmon and smelt from export facilities when these fish are in the interior Delta under freshwater conditions per biological opinions.
- Install or construct a permanent Head of Old River Barrier to keep San Joaquin salmon out of the south Delta in winter-spring under all export conditions.
- Increase San Joaquin River flows in the February-June time period.
- Keep Delta outflow at 8000-10,000 cfs in the fall after wet years to keep salt out of the Delta.
Example: Water Year 2018
This new water year with its record November (wet) and December (dry) is a good example of what is wrong with the Delta. Despite high reservoir levels for the beginning of a new water year1, Delta outflow was allowed to fall to 5000-7000 cfs in late November (Figure 1) as Delta exports literally sucked the freshwater bubble out of the Delta. Exports averagedover 10,000 cfs from mid-November to mid–December, a time of year when there are no Delta controls. The LSZ encroached at Emmaton (Figure 2), Blind Point (Figure 3), False River (Figure 4) on the west side of the Delta, Dutch Slough (Figure 5), and even showed up at the Rock Slough intake of the Contra Costa Water District in the south Delta (Figure 6). See Figure 7 for the gage locations.
In conclusion, maintaining the 10,000 cfs Delta outflow necessary to keep the salt out of the Delta this past fall would have cost approximately 250,000 acre-ft of water from either the 18,000,000 acre-ft in storage or 1,500,000 acre-ft of Delta exports. Doing so would have gone a long way toward protecting the past year’s production of winter-run smolts and pre-spawn Delta smelt that were both concentrated in the Delta.
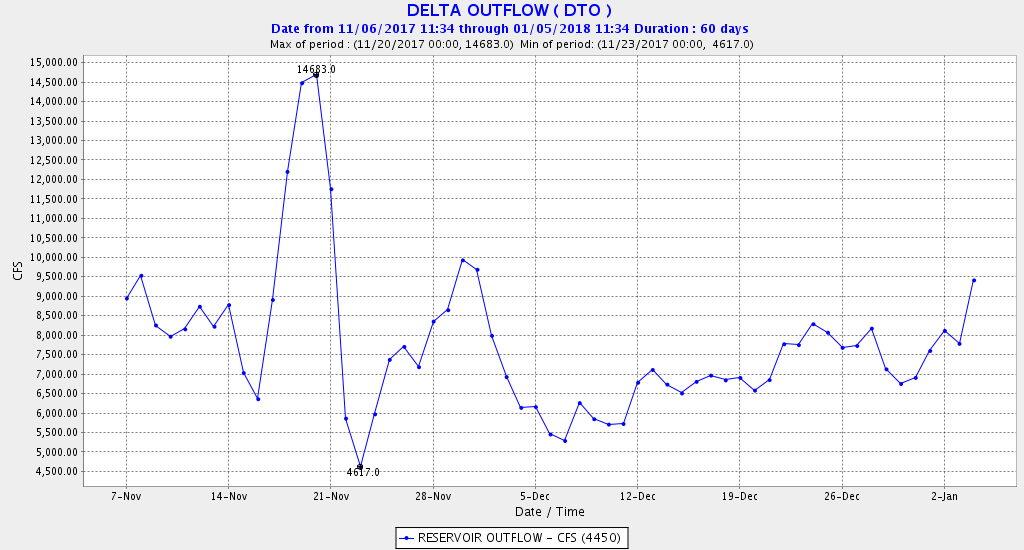
Figure 1. Daily average Delta outflow for 11/7/17 to 1/4/18. Note each box-cell in chart represents approximately 7000 acre-ft of water. Maintaining a target 10,000 cfs to keep salt out of the Delta would have required an additional approximately 250,000 acre-ft of storage releases or export reduction.
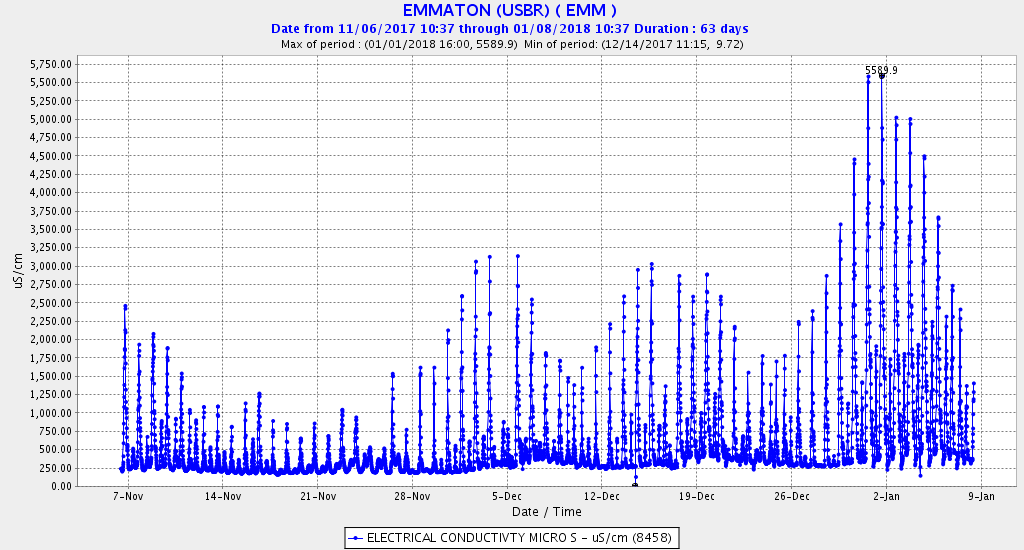
Figure 2. The LSZ has encroached into the Sacramento River channel of the western Delta increasingly this water year. The limit should be 500 EC.
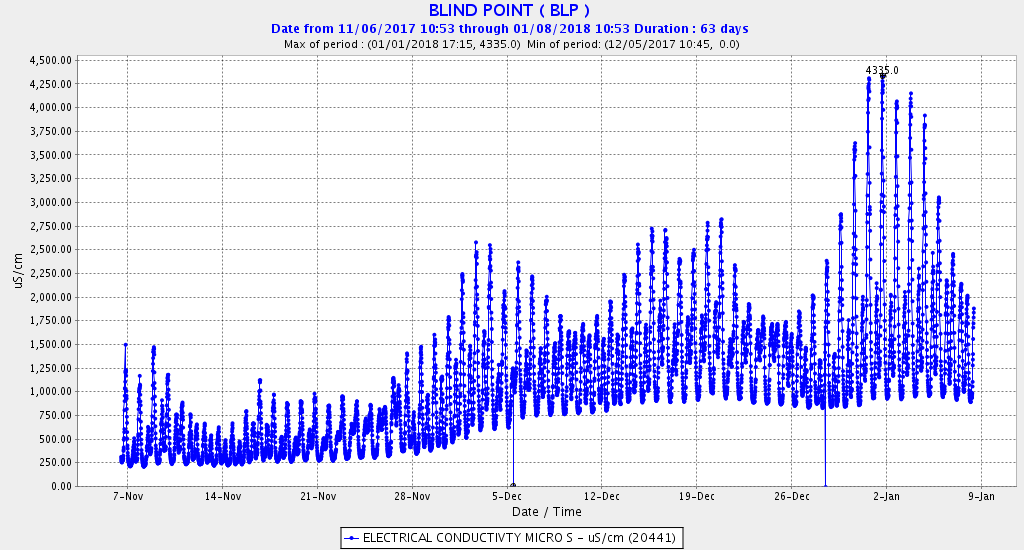
Figure 3. The LSZ has encroached into the San Joaquin River channel of the western Delta increasingly this water year. The limit should be 500 EC.
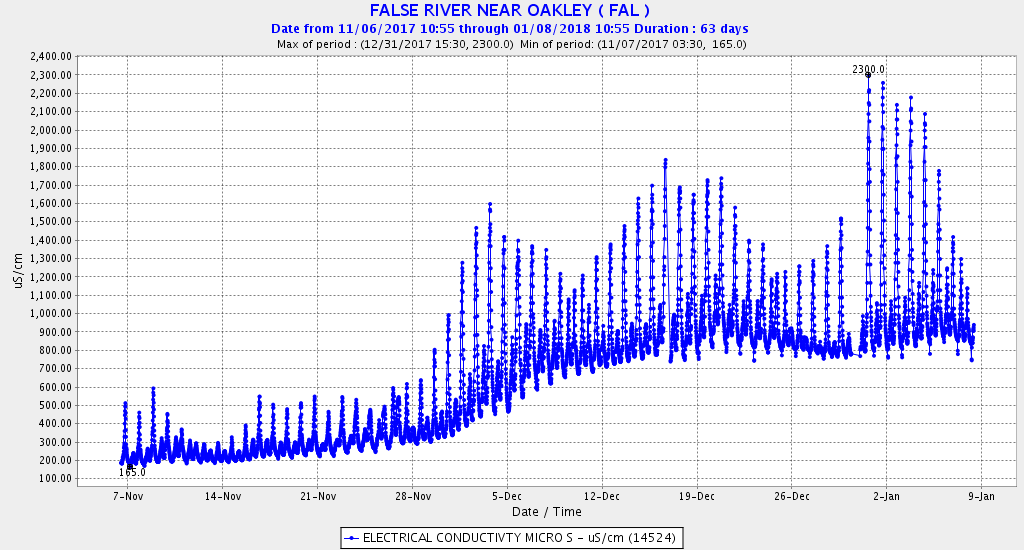
Figure 4. The LSZ has encroached into the central Delta via the False River channel from the western Delta increasingly this water year. The limit should be 500 EC.
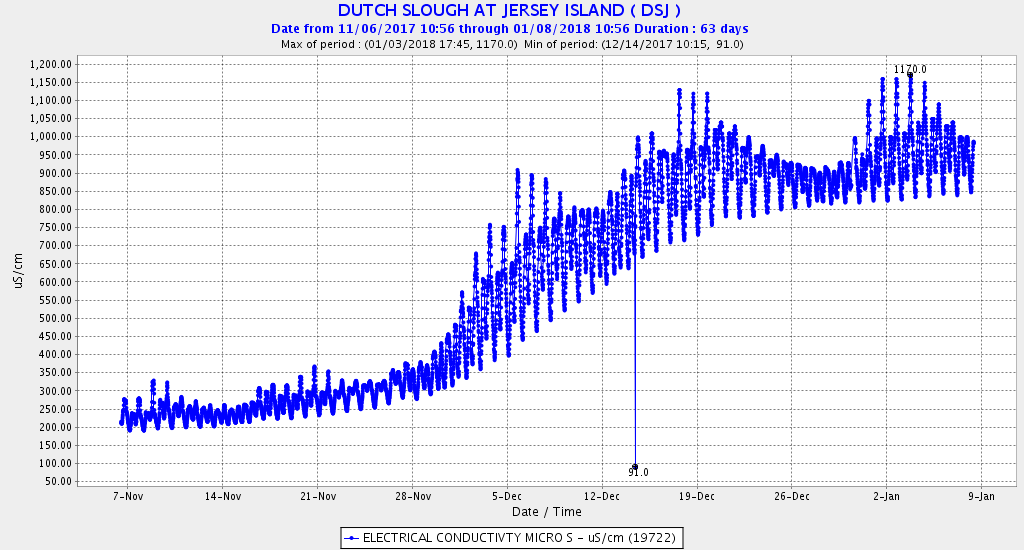
Figure 5. The LSZ has encroached into the central and south Delta via the Dutch Slough channel of the western Delta increasingly this water year. The limit should be 500 EC.
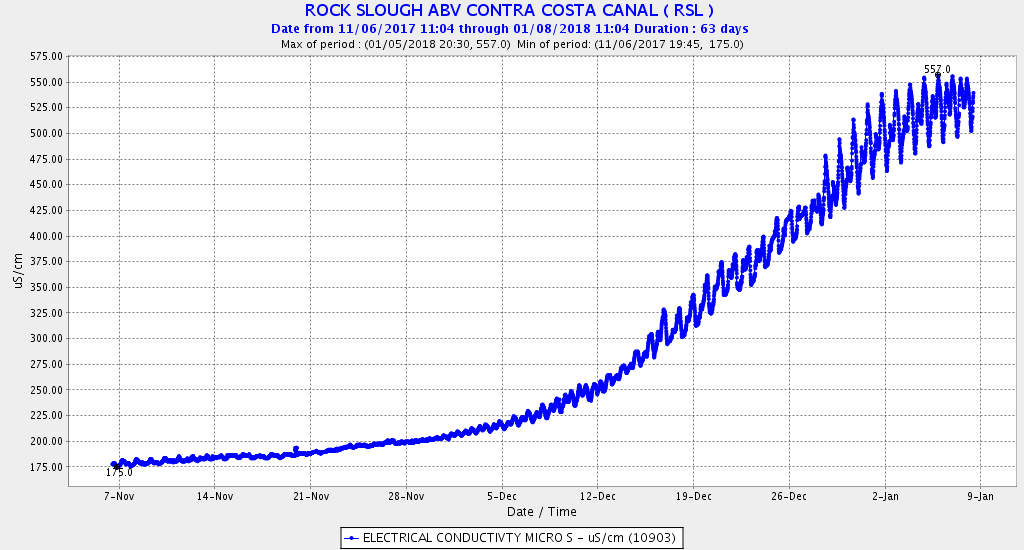
Figure 6. The LSZ has encroached into the central and south Delta as seen at the Rock Slough gage of the south Delta increasingly this water year. The limit should be 500 EC.
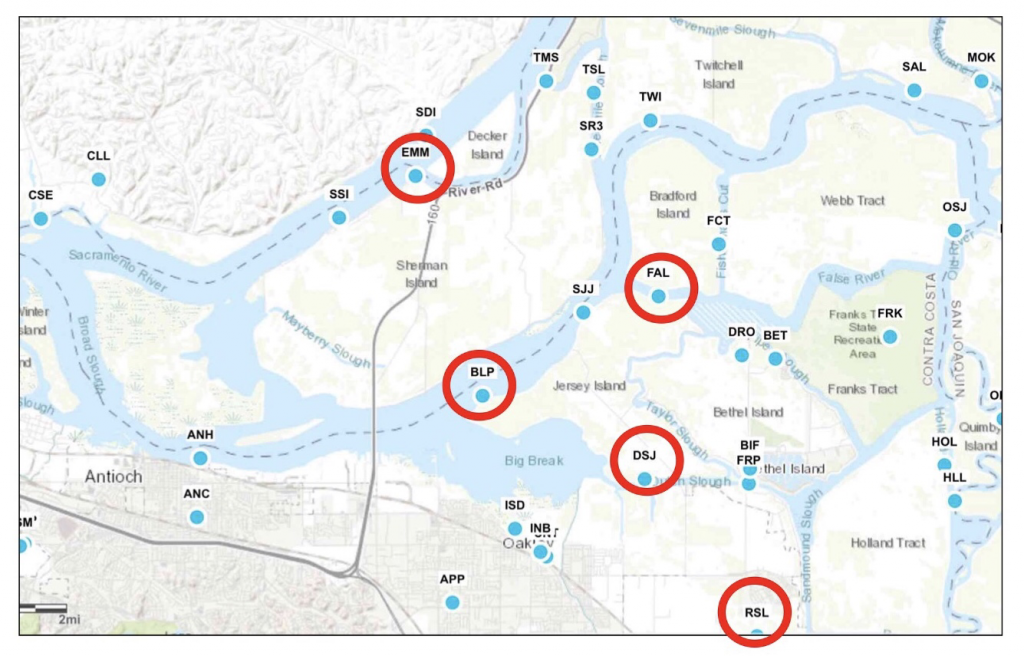
Figure 7. Location of gages in above figures.
- As of December 1, Sacramento watershed reservoirs were 109% of average, and San Joaquin reservoirs were 150% of average. ↩