Revised Delta Smelt Take Permit

The Interior Department’s US Fish and Wildlife Service (USFWS) issued a memo1 on January 30, 2019 that revised the federal take permit for Delta smelt for the combined operation of the Central Valley Project and the State Water Project. The memo stated:

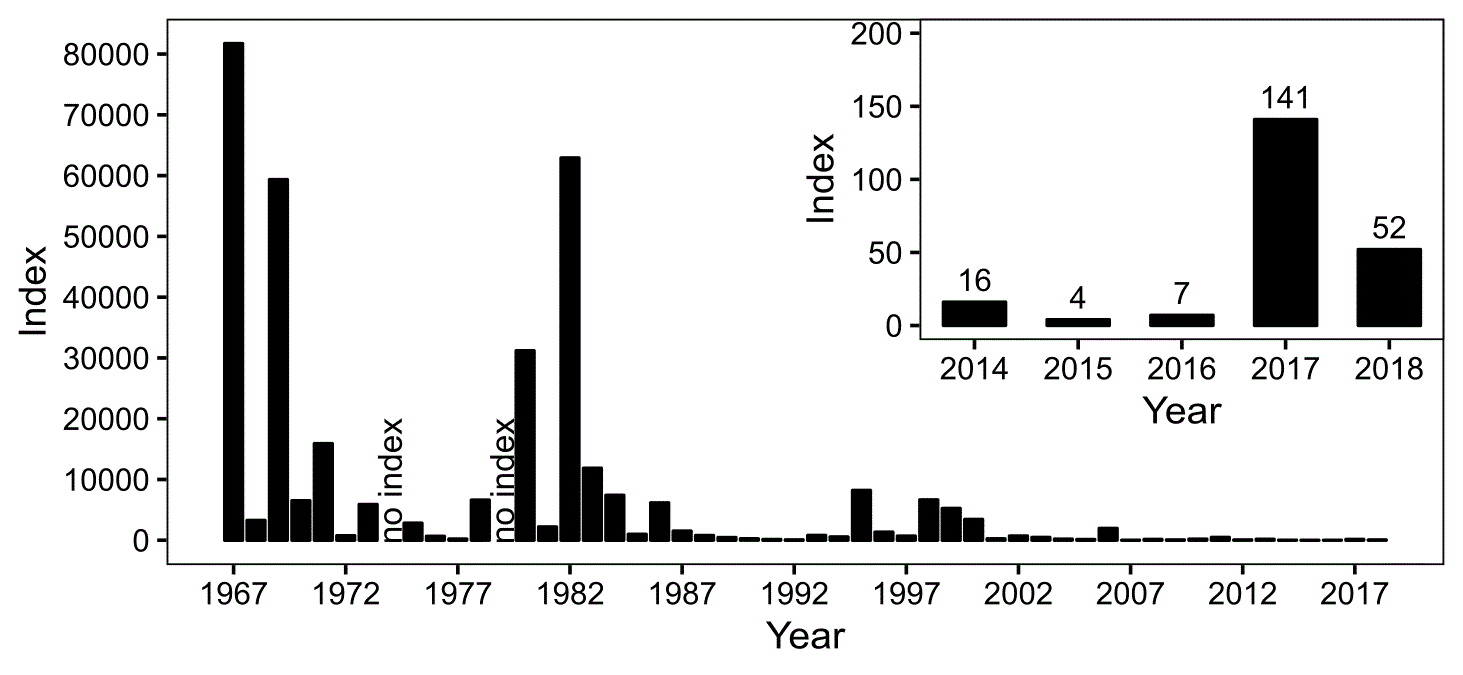
“It has become clear over the past several years that surveys are reaching their detection limits given the declining population of delta smelt, and in 2018, the FMWT [fall midwater trawl] Index was zero, indicating that the FMWT Index may no longer provide an accurate predictor of incidental take.”

The new take criteria are now the old action criteria of limiting Old and Middle River (OMR) reverse flows during the winter and spring under certain conditions. When smelt would normally be expected to be present, OMR flows would be restricted to being no more negative than -2000 or -5000 cfs. The new “surrogate” criteria essentially keep the south Delta pumping plant operations at status quo until such time as the ongoing reinitiated Endangered Species Act (ESA) consultation is completed and new take permits are issued.

The importance of the rule change is diminished by the fact that Interior (combined action of US Bureau of Reclamation and USFWS) has not enforced the rules to protect Delta smelt. The state of California has also failed to protect Delta smelt as well as California ESA-listed longfin smelt. One only has to review recent early winter information to see this is the case. After the first Delta outflow pulse at the beginning of December 2018, outflow fell to only 4000 through mid-December (Figure 1). High exports (Figure 2) contributed to the low outflow and exceptionally low (negative) OMR flows (Figure 3).

These low outflows and high exports created very high risk conditions for the two smelt species. What few Delta smelt remained were observed in the west Delta (Figure 4). Longfin smelt were spawning in Suisun Bay and the west Delta (Figures 5 and 6).

Smelt are not being protected. The Smelt Working Group mandated under the Federal and State take permits has been inactive and has not provided mandatory guidance. New take permits are needed immediately to protect the two listed smelts. The State Water Board, in revisiting water right permits and water quality standards for the Delta, should also adequately protect the listed smelts. To protect the smelts, the OMR limit for December should have been no more negative than -2000 cfs. The export-to-inflow limit criteria for December should be 35%, not the present 65%. December outflow minimums should be 6000-8000 cfs, not the present 3500-4500 cfs.

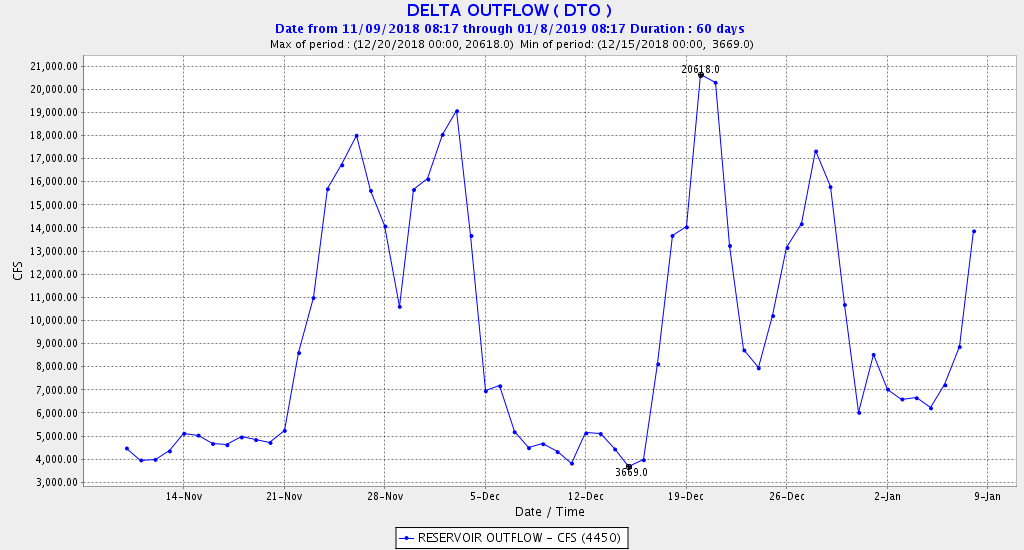
Figure 1. Delta outflow 11/10/18 to 1/8/19. Note very low outflow in early December after initial rainfall pulse.

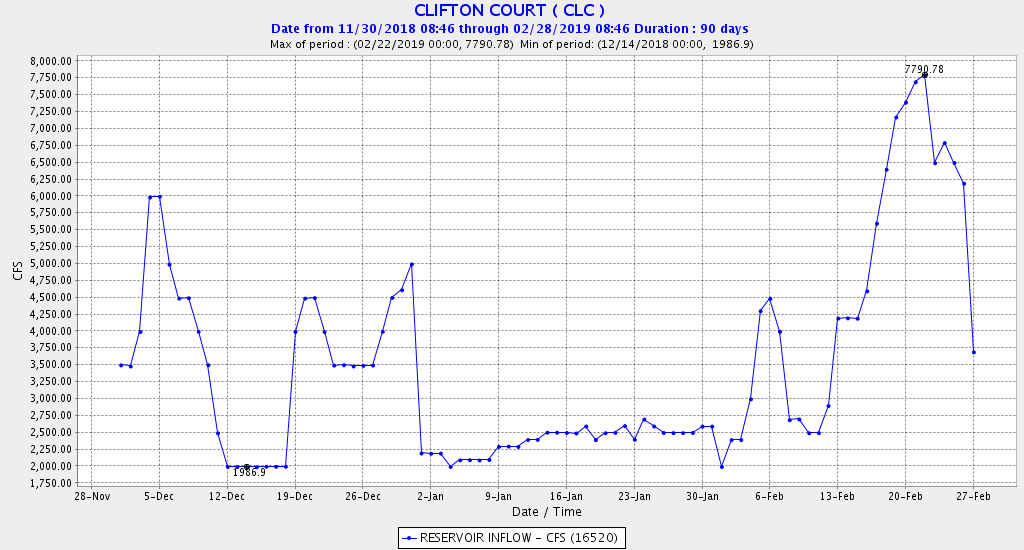
Figure 2. State project exports at Clifton Court December 2018 to February 2019. Federal exports were near maximum (3500-4200 cfs) for most of period.

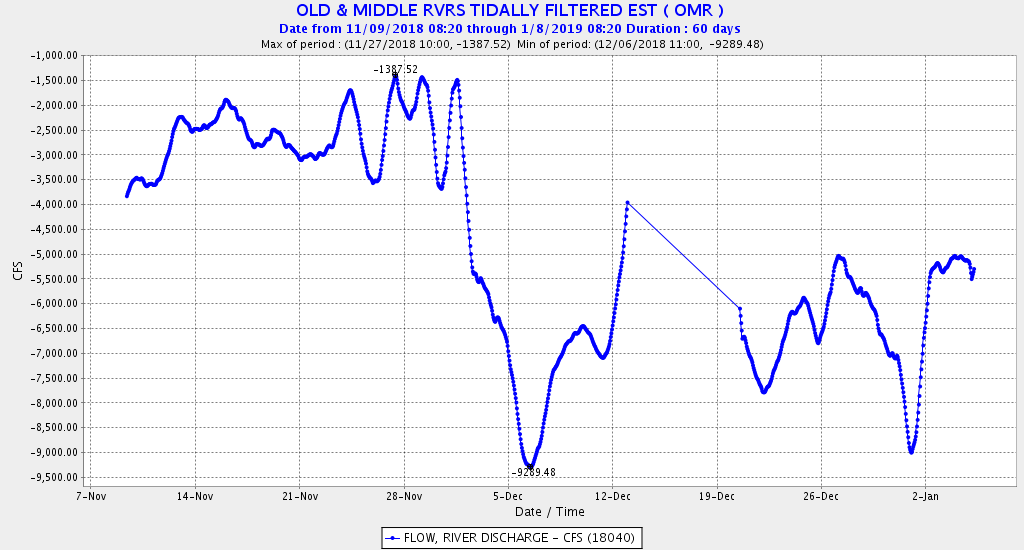
Figure 3. OMR flows November 2018 to January 2019.

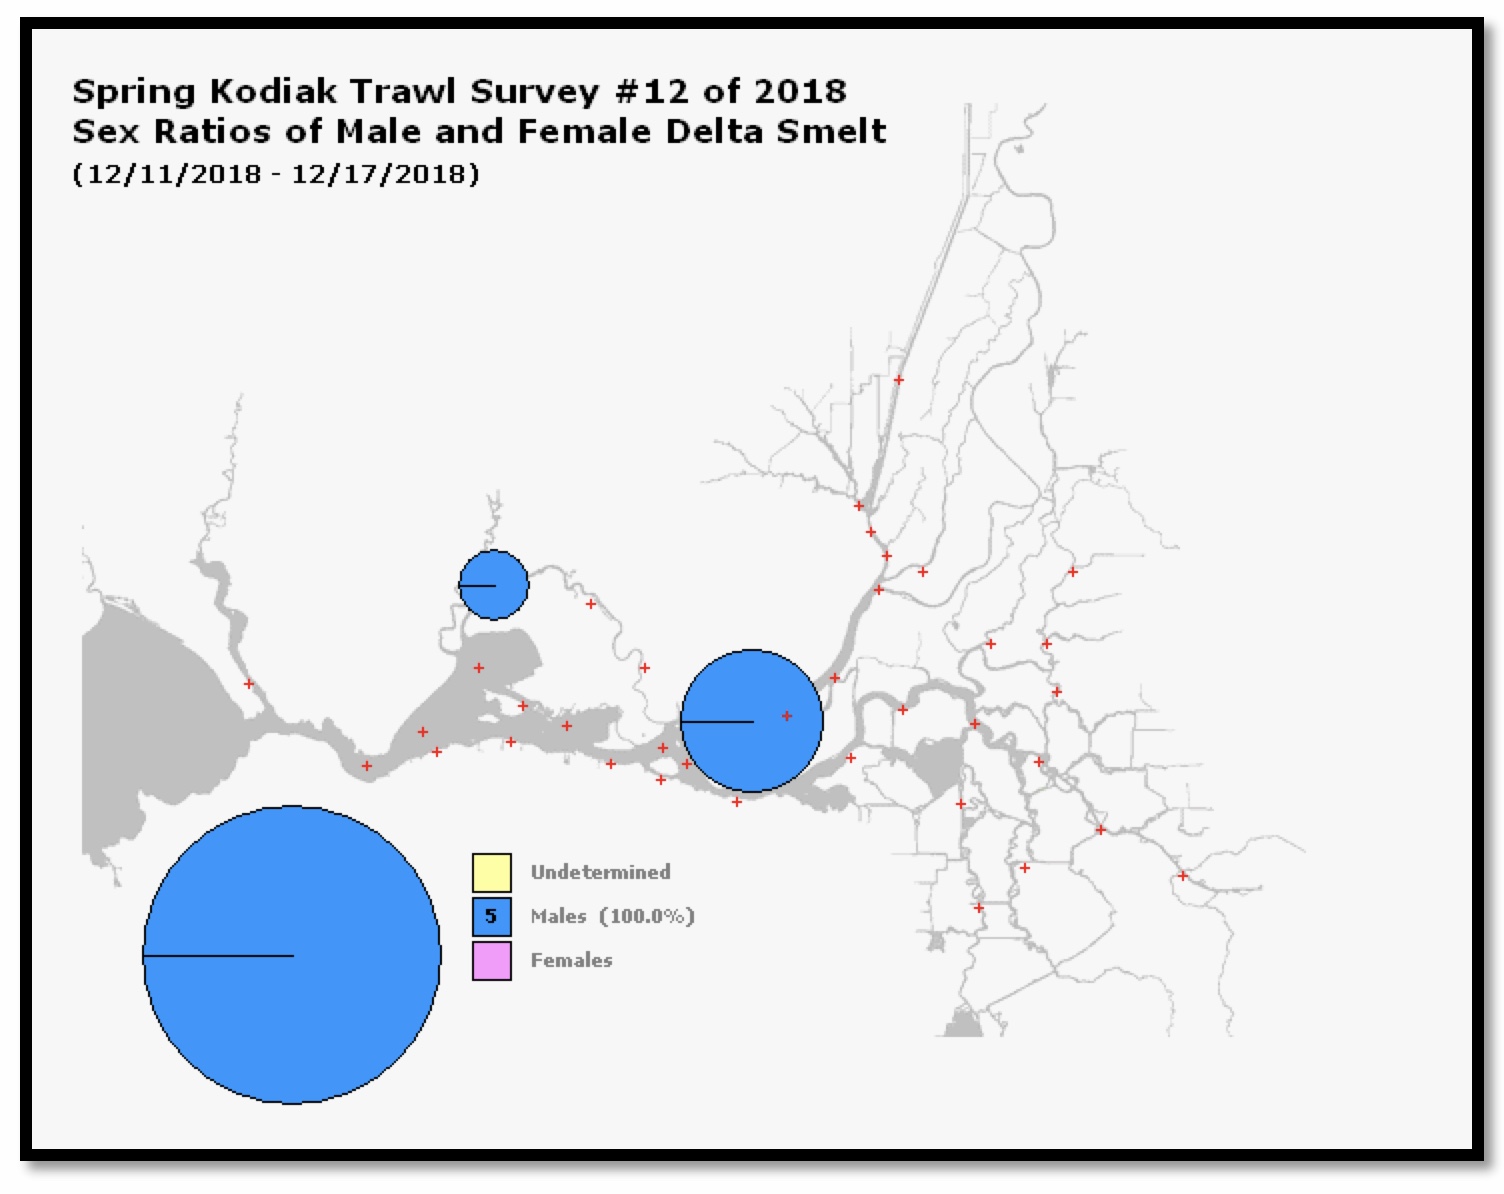
Figure 4. December 2018 Kodiak trawl survey catch of Delta smelt.

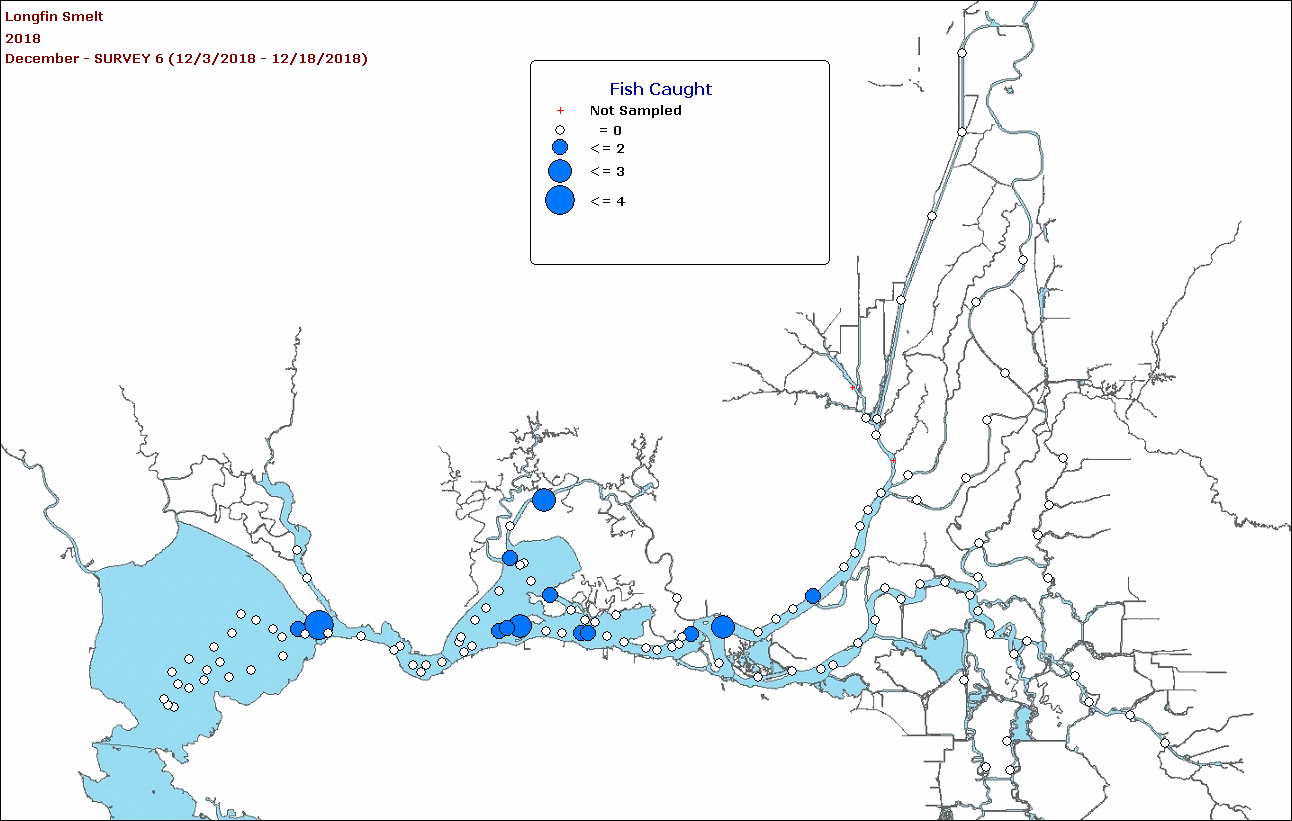
Figure 5. December 2018 midwater trawl longfin smelt catch.

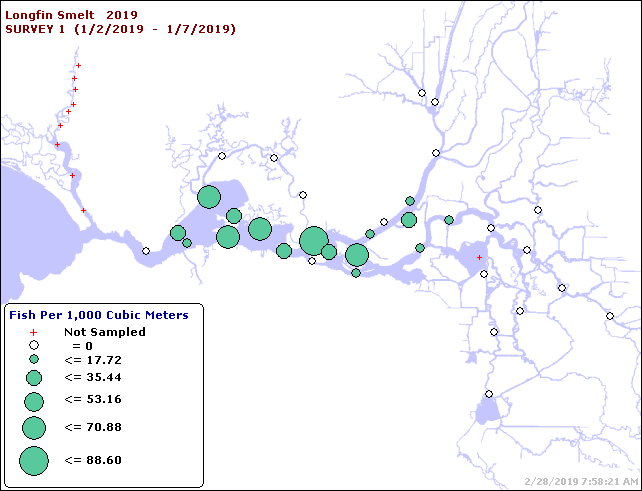
Figure 6. Smelt Larvae Survey #1 for 2019 catch of newly hatched longfin smelt.

Winter-Run Salmon Update – March 2019

This post updates a 7/25/18 post on the status of the endangered winter-run Chinook salmon population of the Sacramento River. Figure 1 is an updated figure showing the influence of water supply conditions on the spawner-recruit relationship of winter-run during the recruits’ first year of life in the Sacramento River. The relationship is also influenced by hatchery contributions that began in 1998 and continue today.1 Other factors, including water temperature control improvement at Shasta Dam and changes to permits and water quality plans (not depicted), are also likely unaccounted-for factors. Figure 2 depicts raw run numbers by spawning year.

What the relationship shows is that there is a strong positive spawner-recruit relationship heavily influenced by water supply conditions and hatchery contributions. The recent estimates of >70% contribution from the hatchery to the population recruits1 reflects the importance of the hatchery role and the underlying problem of declining “wild” spawner contribution. Note that the spawner numbers for 2018 (recruits from critical year 2015 spawners) are as yet unpublished. Hatchery smolt production and releases were doubled in 2015, the third critical year of the 2013-2015 drought.

Figure 1. Spawners versus recruits (spawners three years later) transformed (logx minus 2). Year is spawner year. For example, 2014 is spawning year with 2017 recruits. Color denotes water-year type in spawning year: bold red is critical year, non-bold red is dry year, green is normal year, and blue is wet year. For example, red 13 represents critical water year 2013. Squares around numbers indicate the presence of hatchery contributions (begun in 1998).

Figure 2. Spawning population estimates of adult winter-run salmon in the upper Sacramento River from 1974 to 2017. Source: CDFW.


A Case for Winter Pulsed Flows for Winter-Run Salmon

In a December 2018 post, I discussed the need for fall pulsed flows in the Sacramento River through the Delta in dry years. In this post, I further discuss the need for winter pulsed flows, using brood years 2013-2015 and resulting rearing of winter-run salmon in drought years 2014 and 2015 and normal year 2016 as examples.

Winter-Run brood year 2013 (spawned in summer 2013) started with a good number of spawners (Figure 1), but resulted in poor escapement in 2016 (Figures 1 and 2). Likewise, brood year 2014 started with slightly fewer spawners and resulted in even lower escapement in 2017. Brood year 2015 fared better.

While the lack of fall pulse flows and poor spawning conditions and redd dewatering likely struck brood years 2013 and 2014 first, the lack of winter pulsed flows further limited their survival, or at a minimum failed to ameliorate poor fall survival. Brood year 2013 juveniles moved out of the spawning reach above Red Bluff in the fall (Figure 3). However, they did not show in traps in the lower river at the Tisdale weir near Colusa, a hundred miles downstream of Red Bluff, or at Knights Landing, further downstream, until February (Figures 4 and 5). I attribute this delay to a lack of pulsed flows to move these fish down the river. This delay in out-migration to the Bay-Delta is detrimental both to in-river survival and to the success of smolts in reaching the ocean. In contrast, brood year 2015 had significant early winter flow pulses that moved juvenile winter quickly through the lower Sacramento River (Figure 6).

One might argue that Shasta Reservoir was too low after three years of drought to provide these winter pulsed flows (Figure 7). Three days’ release of 5000-10,000 cfs would require 30,000-60,000 acre-feet of water. This is between 2.7% and 5.5% of dry-year irrigation deliveries to Sacramento River water contractors from Shasta Reservoir (1,100,000 acre-feet in 2014 and 1,200,000 acre-feet in 2015).1

Figure 1. Escapement (spawning run) numbers for winter run salmon 1974-2018. Source: https://nrm.dfg.ca.gov/FileHandler.ashx?DocumentID=84381&inline

Figure 2. Spawner-recruit relationship (log10 – 2) for winter run salmon. Number represents brood year. Color represents dry (red), wet (blue) or normal (green) water year types for winter rearing/migration season following spawning. For example, 15 represents brood year 2015 under winter conditions in the normal 2016 water year.

Figure 3. Red Bluff trap catch of brood year 2013 winter run salmon juveniles fall 2013, winter 2014.

Figure 4. Tisdale Weir trap catch of brood year 2013 winter run salmon juveniles fall 2013, winter 2014.

Figure 5. Knights Landing trap catch of brood year 2013 winter run salmon juveniles fall 2013, winter 2014.

Figure 6. Red Bluff and Tisdale trap catch of brood year 2015 winter run salmon juveniles in fall 2015 and winter 2016.

Figure 7. Shasta Reservoir storage in winters 2014 and 2015. Total capacity is 4,500,000 acre-feet.


Longfin Smelt February 2019

In my last update on the status of longfin smelt (February 2018), I decried the continuing decline of the Bay-Delta population of longfin, which are listed under the California Endangered Species Act.  The fall index for 2018 indicates continued low population levels (Figures 1 and 2), with 10 to 100 times higher production in wetter years than dry years.  After the very poor recruitment in 2015 and 2016, there was some recovery in wetter years 2017 and 2018.  Despite record low spawner numbers in 2015 and 2016, recruits increased with wetter years 2017 and 2018, which in turn could lead to improvement in 2019 and beyond with indices above 100 (log 2.0 in figure 2) or perhaps even near 1000 (log 3.0 in figure 2).  If drought returns, bets are off.

Figure 1. Fall Midwater Trawl Index for longfin smelt, 1967-2018. Source: http://www.dfg.ca.gov/delta/data/fmwt/indices.asp

Figure 2. Longfin Recruits (Fall Midwater Trawl Index) vs Spawners (Index from two years prior) in Log10 scale. The relationship is very strong and highly statistically significant. Adding Delta outflow in winter-spring as a factor makes the relationship even stronger. Recruits per spawner are dramatically lower in drier, lower-outflow years (red years). Data source: http://www.dfg.ca.gov/delta/data/fmwt/indices.asp.