Dutch Slough Tidal Marsh Restoration

The Dutch Slough Tidal Restoration Project,1 newly redesigned (Figure 1), has some improved design elements, but remains flawed and potentially detrimental to Delta native fishes. Unless the flaws are overcome, the project will be a huge waste of limited Delta restoration funds.

First, the proposed project’s location within the Delta (Figure 2) is extremely detrimental.

  1. The location is an eastward extension of Big Break, an open water of the west Delta that is infested with non-native invasive aquatic plants and that breeds non-native fishes.
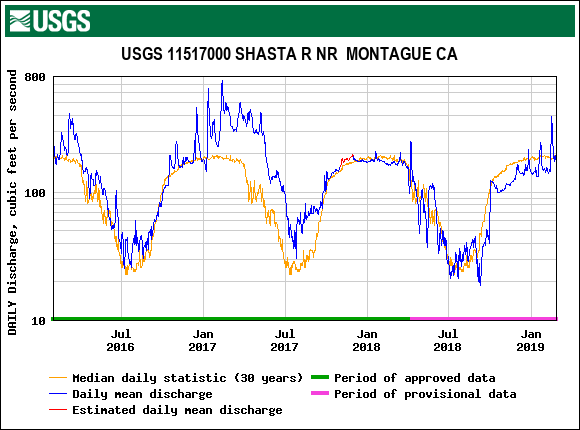
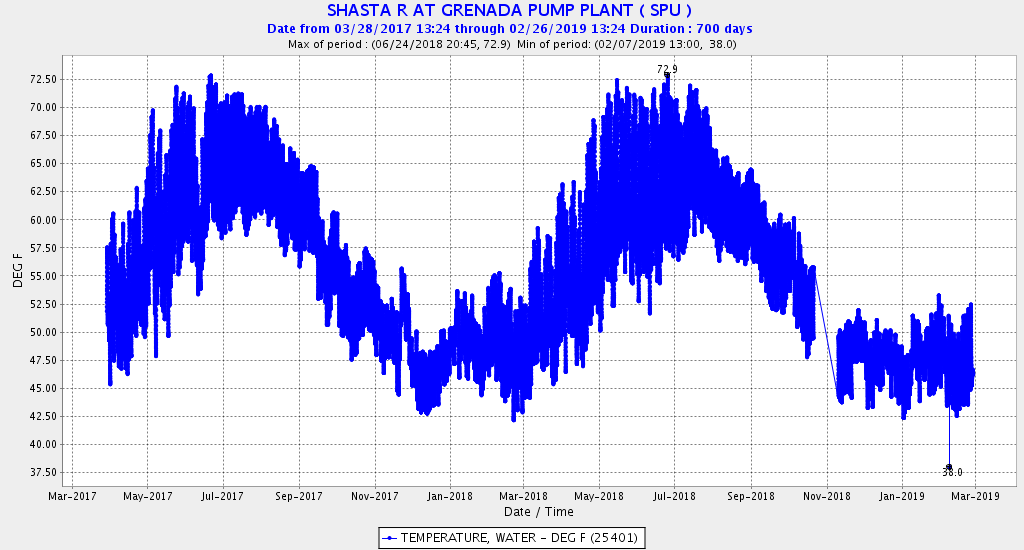
  2. The project is located on Dutch Slough, detrimentally warm in summer (Figure 3), with net flows that are negative and eastward toward the south Delta export pumps (Figure 4).

Second, and equally important, the project as designed would further contribute to the existing detrimental non-native vegetation and warm water problems.

  1. The extensive new dead-end slough complexes will become infested with invasive plants and will contribute to lowering turbidity and warming.
  2. The new subtidal habitat will further add to that in Big Break with more invasive plants and breeding and rearing habitat for non-native fish.

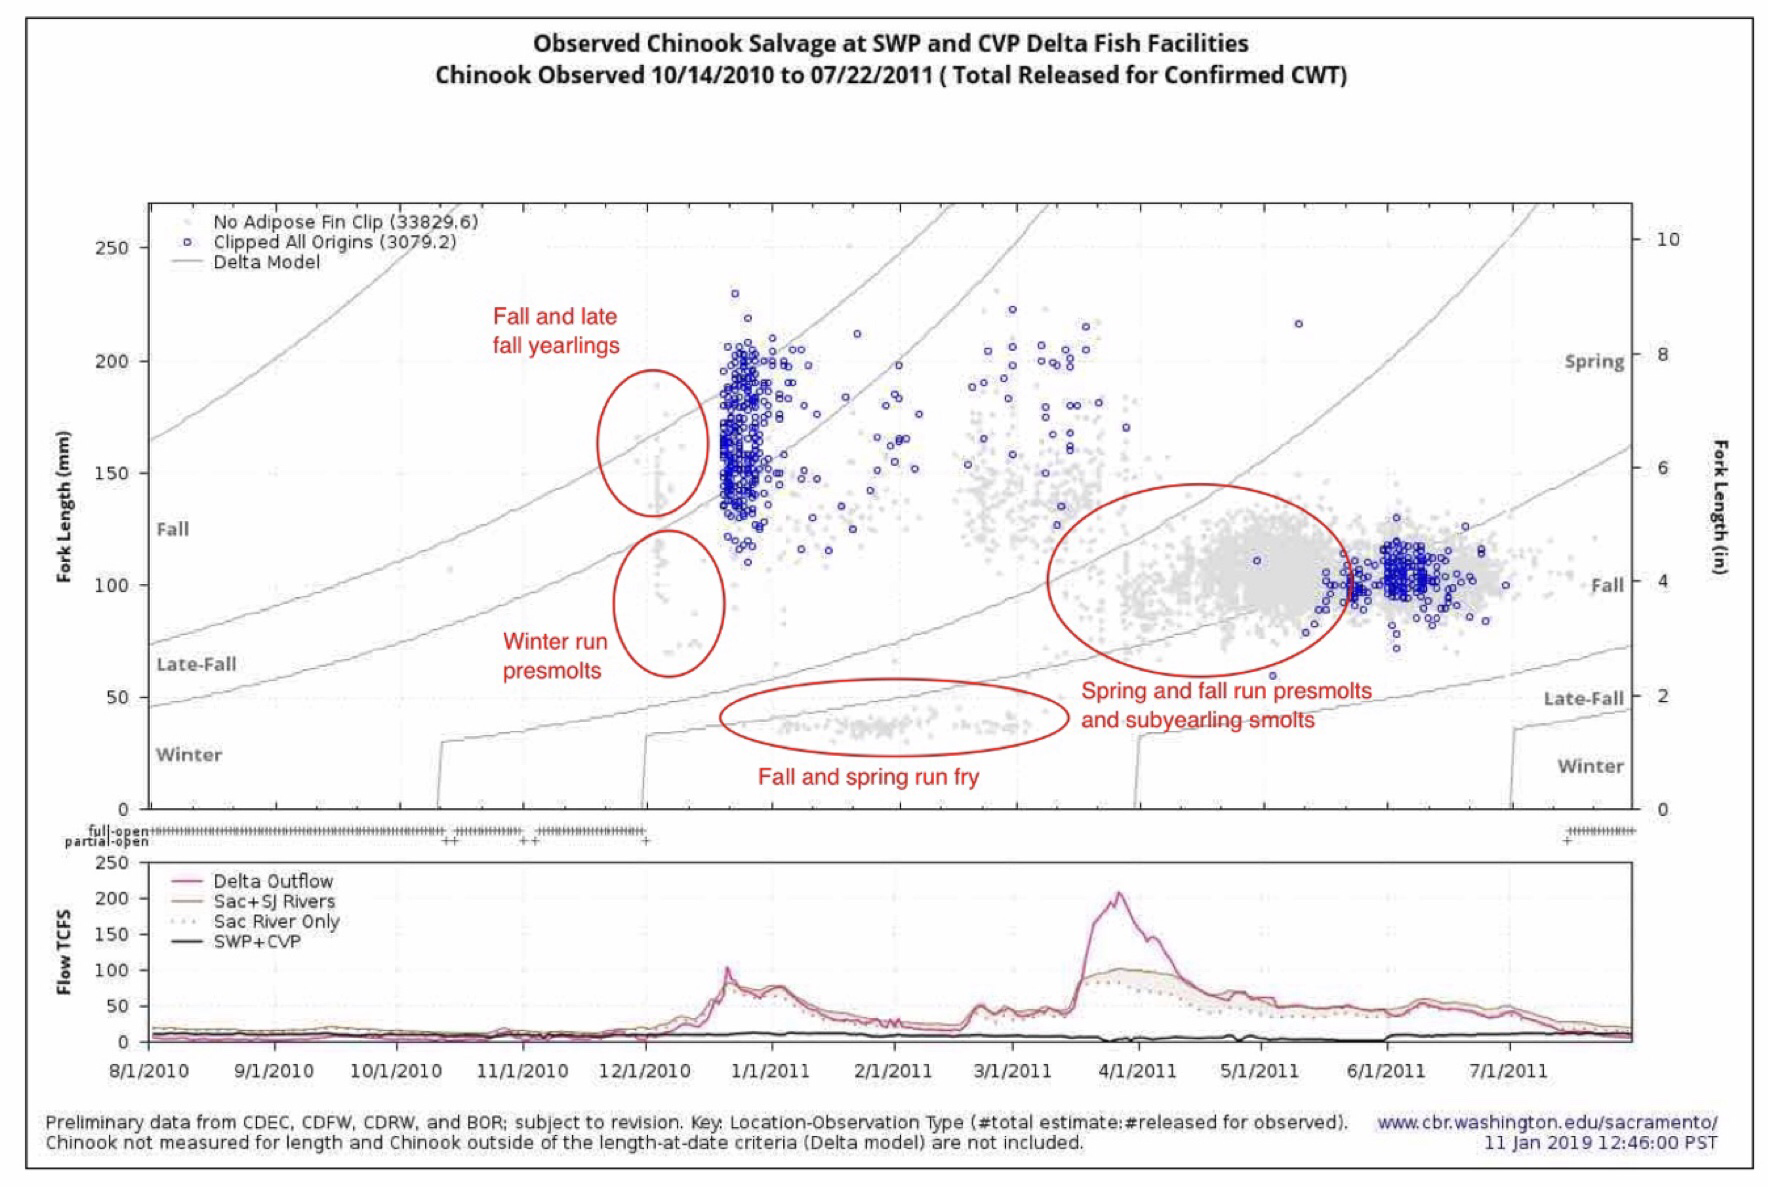
Third, the new habitat will attract breeding smelt and rearing juvenile salmon into an area where their eventual survival is highly questionable.

Can design changes overcome these flaws? Yes, but only in combination with other regional fixes.

  1. Big Break must first be restored along the lines being considered and studied in the Franks Tract Restoration Feasibility Study.
  2. A tide gate must be installed on east Dutch Slough, similar to that being considered for False River in the Franks Tract restoration. (This would fix the negative net flows toward south Delta exports and reduce salinity intrusion.)
  3. Open-water subtidal habitat should be eliminated. (Make the subtidal element diked-off non-tidal marsh.)
  4. Dead-end sloughs should allow flow-through to increase tidal circulation.
  5. Finally, more freshwater outflow should be allocated by reducing south Delta exports in low outflow conditions, in order to reduce salinity intrusion.

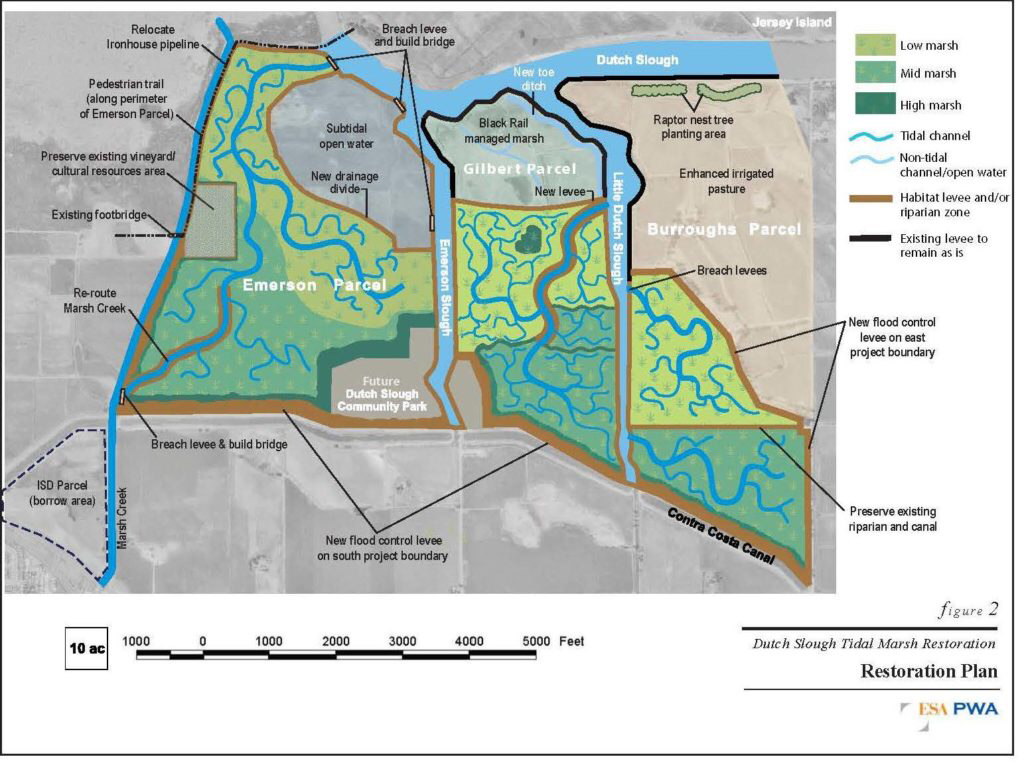
Figure 1. Conceptual design of Dutch Slough restoration project.

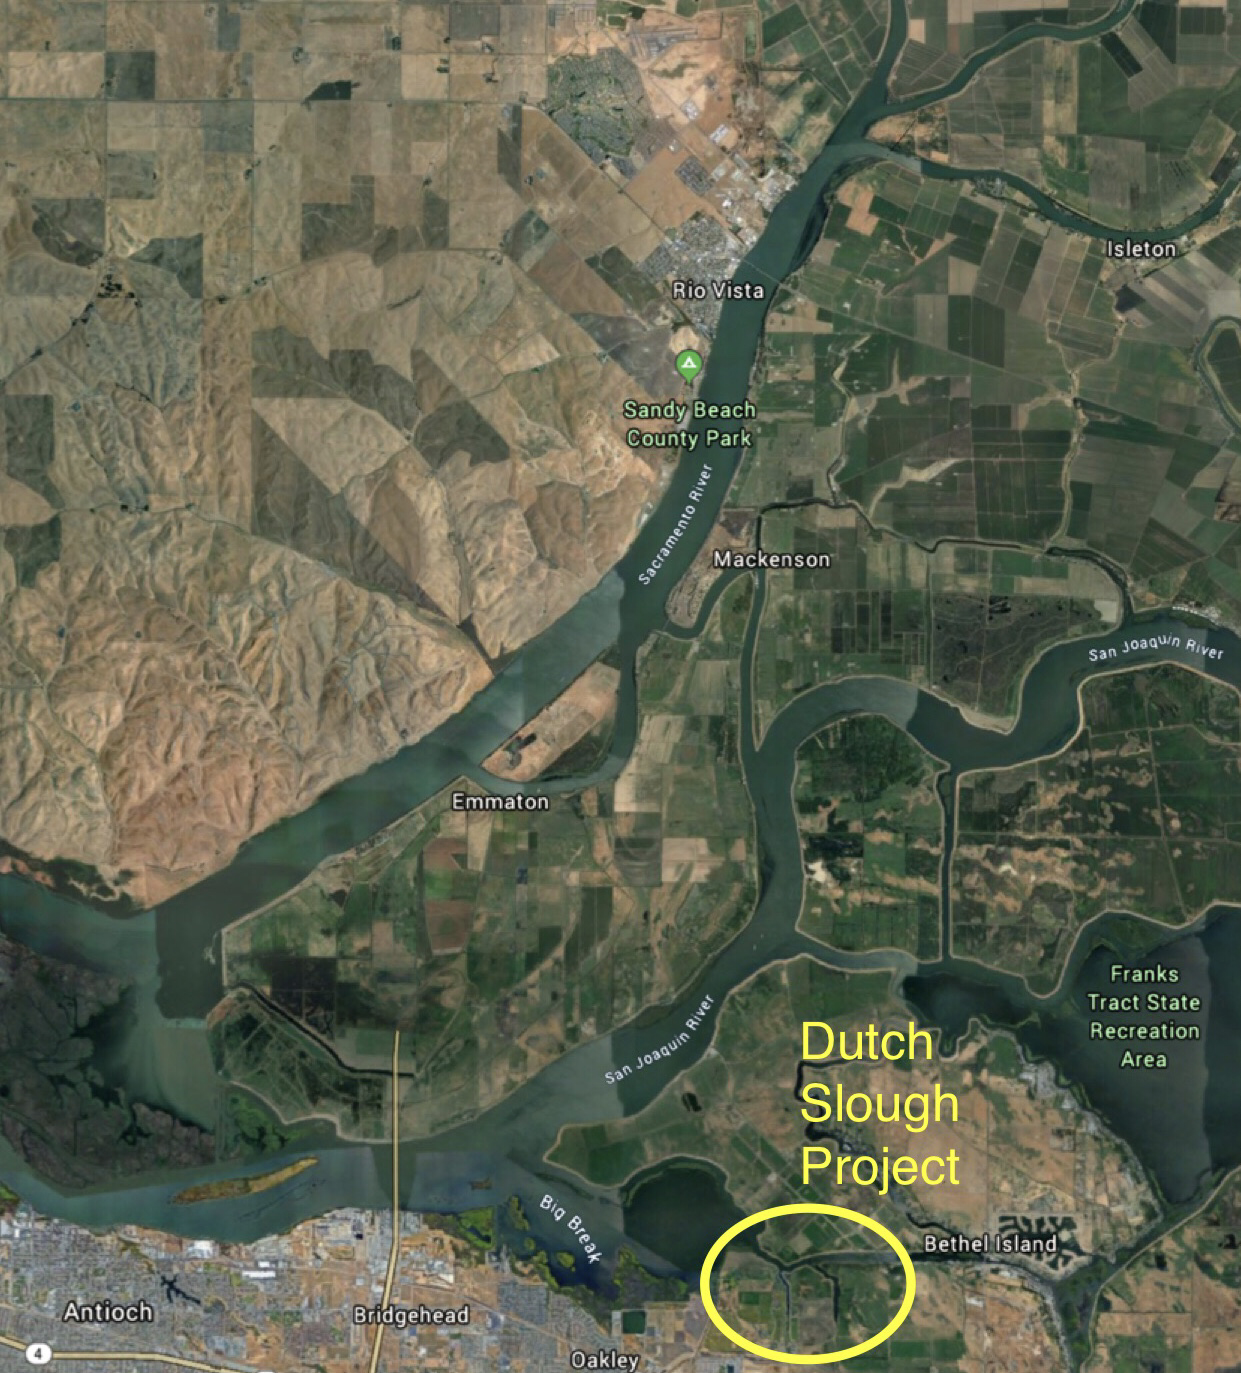
Figure 2. Location of Dutch Slough Project in the Delta.

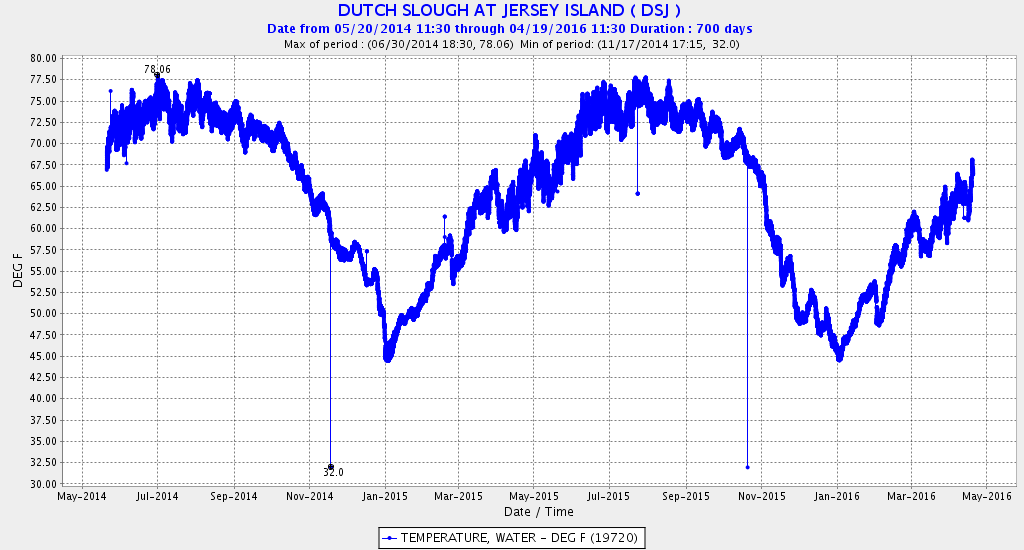
Figure 3. Water temperature in Dutch Slough in 2014 and 2015.

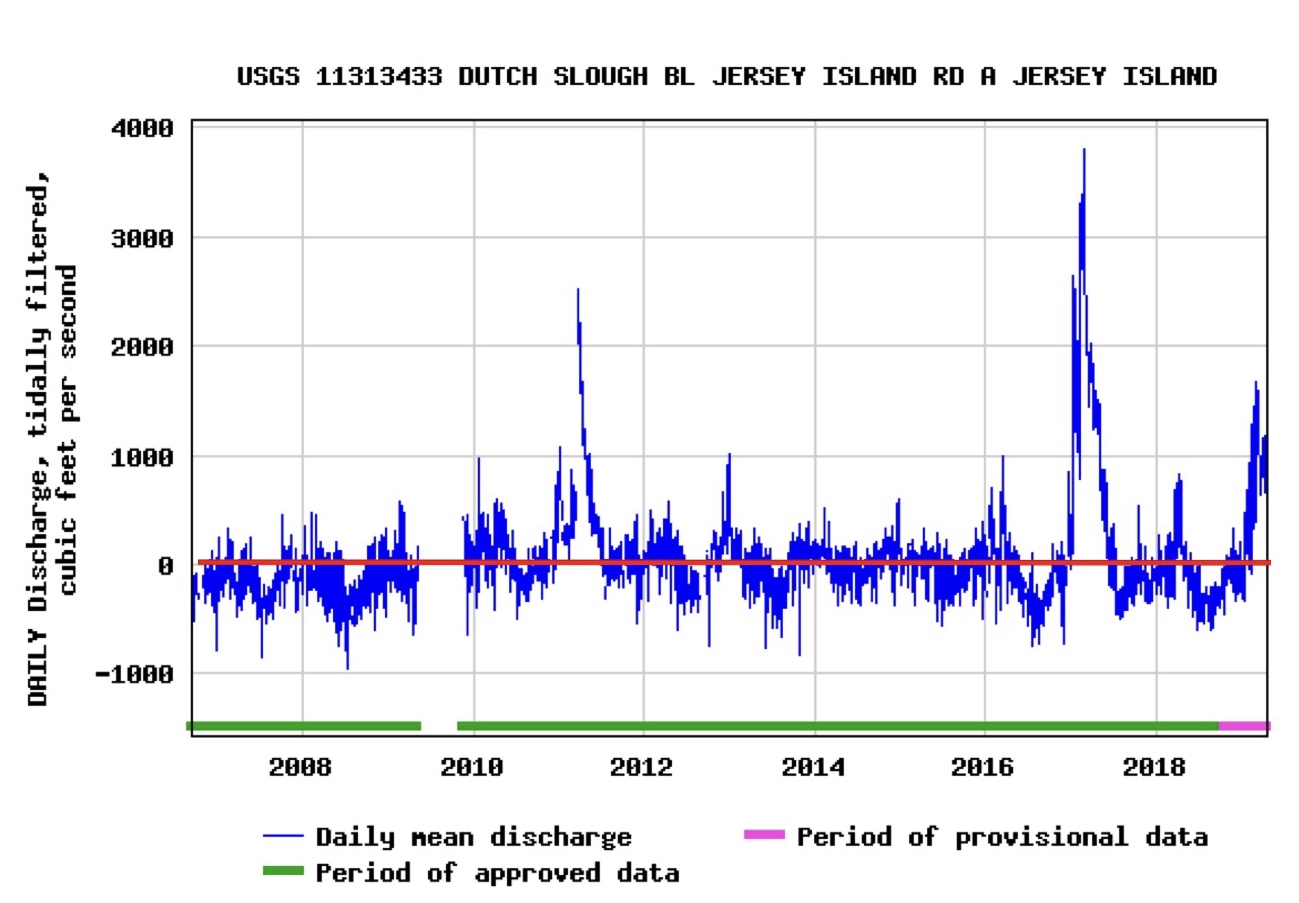
Figure 4. Daily net flows in Dutch Slough 2007-2018.


The Importance of the Bay-Delta Estuary to the Recovery of Wild Chinook Salmon

Common sense says salmon recovery efforts should focus on the most important factors that control fish population dynamics. In reviewing Central Valley population dynamics, I have seen each life stage and each individual controlling factor become important at one time or another. In my experience, the estuarine rearing and migrating stage is an essential component that is not given enough attention.

Central Valley salmon populations are nearly all “ocean-type” Chinook salmon, meaning they move to the ocean usually during their first six months of life, with substantial estuary rearing as fry, fingerlings, and pre-smolts. That is not to say that yearling smolts contributions are not important. It is that they are a minor contribution in “ocean-type” Chinook (note that late-fall-run are “river-type”).

I have always believed the survival of wild salmon fry in the Bay-Delta to be a key limiting factor in wild salmon production in the Central Valley. Hatcheries have kept smolt numbers to the ocean up, while the survival of wild salmon eggs, fry, fingerlings, and smolts has worsened. Fry-fingerling estuary survival is important, if only in the sense of sheer numbers and the resulting potential to increase overall smolt production. This is true for fall-run, spring-run, and winter-run populations. There is substantial evidence that returning wild adult salmon are predominantly from the estuarine-reared groups. Such evidence exists from fish surveys, scale analyses, and genetic studies. Thus, a recovery program for wild salmon should include a strong focus on estuarine rearing and survival.

My beliefs are shaped in large part from my personal experiences in conducting winter seine and screw trap surveys throughout the Bay-Delta and lower rivers. Young wild salmon classified as fry and fingerlings, 30-50 mm (1-2 inches), dominate the inshore landscape and screw trap collections. Millions of fry and fingerlings pour out of the spawning rivers and tributaries into the main rivers and into the Delta, where they dominate the winter fish community. Larger, more elusive pre-smolts, mostly winter-run, are also present in smaller numbers, but in numbers important to the winter-run population. Yes, there are millions of fry left to rear in highly regulated and disturbed river habitat, but their overall numbers are fewer, with less potential for ultimate survival to smolts entering the ocean than their estuarine counterparts.

One of the better indicators of the general pattern of estuarine use by salmon is fish salvage collections at the massive federal and state pumping plants in the south Delta. As shown in Figure 1, December is important in the estuary for winter-run and late-fall-run pre-smolts and yearlings, respectively. The January through March period is important for spring-run and fall-run fry/fingerlings. The April through June spring period is important for spring-run and fall-run pre-smolts.

To support juvenile salmon in the estuary, Delta habitat therefore needs protection from December through June. Natural flows and flow direction patterns are important habitat features. Water temperature is important in late spring. Exports affect such habitat, especially in dry, low-flow years.

The State Water Resources Control Board is in the process of revising water quality standards in the Bay-Delta watershed.1 Salinity, flow, water temperature, and export-limit standards need updates to protect salmon using the Bay-Delta through the winter and spring. Such protections will be key to wild salmon recovery in the Central Valley.

Figure 1. Salmon salvage at south Delta pumping plants in 2011. Note red-outlined groups of predominately wild salmon. Blue dots depict salvage events for hatchery salmon.


The Delta’s Trophic Collapse Explained

A just-released UC Davis Study1 concludes that the decline in the Delta pelagic open water habitat and fishes is strongly related to non-native clam invasions and water exports. This long-held theory now has strong supporting evidence.

“The low pelagic productivity of the SFE [San Francisco Estuary] is considered a primary cause for the low abundance of several resident fish species (Sommer et al. 2007), including the imperiled Delta Smelt (Feyrer et al. 2003; Sommer et al. 2007; Hammock et al. 2017; Hamilton and Murphy 2018).”

In their study paper, the authors reviewed five theories on the decline in estuary productivity:

  1. Grazing by invasive clams.
  2. Ammonia inhibition from sewage treatment plants.
  3. Phosphorus limitation
  4. Elevated nitrogen.
  5. Freshwater exports.

The paper concludes there is “a growing consensus that the decline in pelagic fish abundance in the SFE is at least partially due to a trophic cascade, triggered by declining phytoplankton (Feyrer et al. 2003; Sommer et al. 2007; Hammock et al. 2017; Hamilton and Murphy 2018)”.

The authors noted that “the suppression of phytoplankton abundance due to exports cannot be reversed with equivalent releases from upstream reservoirs. Releasing water in late summer/fall increases flow, which decreases residence time, and therefore suppresses phytoplankton abundance (Table 2, Fig. 6).” This finding is extremely important because the primary form of mitigation for Delta exports has been maintaining outflow by increasing inflow with reservoir releases.

The study’s analyses strongly indicate that the decline in estuary productivity is associated with the clam invasion and increasing exports over the past five decades. The effects are most pronounced in non-wet years when fish production is most negatively affected.

There are factors not discussed in the study paper that deserve mention:

  • The increase in invasive clams and the more upstream distribution of clams are also enhanced by the increasing exports and lower Delta outflows resulting from higher exports.
  • The reduction in zooplankton (fish food) and fish abundance is also directly affected by the entrainment of both in exports.
  • The trophic collapse is also related to an increase in invasive rooted and floating aquatic plants, including Egeria and hyacinth over the same period. These plants compete with phytoplankton for nutrients and pelagic habitat. They also mechanically trap phytoplankton. For example, when flood tides carry turbid phytoplankton and water laden with suspended sediment into margin habitats that have an abundance of aquatic plants, ebb tides return clear water. Invasive aquatic plants have also benefitted from declining phytoplankton and suspended sediment, setting off a vicious circle of declining pelagic productivity.


  1. Hydrodynamic Modeling Coupled with Long-term Field Data Provide Evidence for Suppression of Phytoplankton by Invasive Clams and Freshwater Exports in the San Francisco Estuary, April 8, 2019. See description (“Clams and Water Pumping Explain Phytoplankton Decline in San Francisco Estuary” at: https://www.ucdavis.edu/news/clams-and-water-pumping-explain-phytoplankton-decline-san-francisco-estuary.

Shasta River Update – April 2019

A February 20, 2019 article in the Eureka Times-Standard reported continuing improvement of Klamath River fall-run Chinook.

“The number of natural area spawners was 53,624 adults, which exceeded the preseason expectation of 40,700. However, the stock is still in “overfished” status as escapement was not met the previous three seasons. The estimated hatchery return was 18,564 adults for the basin.

Spawning escapement to the upper Klamath River tributaries (Salmon, Scott, and Shasta Rivers), where spawning was only minimally affected by hatchery strays, totaled 21,109 adults. The Shasta River has historically been the most important Chinook salmon spawning stream in the upper Klamath River, supporting a spawning escapement of 27,600 adults as recently as 2012 and 63,700 in 1935. The escapement in 2018 to the Shasta River was 18,673 adults. Escapement to the Salmon and Scott Rivers was 1,228 and 1,208 adults, respectively.”

In a May 2017 post, I discussed an increasing contribution to the Klamath run from the Shasta River.  In Figure 1 below, I have updated my original spawner-recruit analysis from the prior post with 2017 and 2018 escapement numbers for the Shasta River.  The Shasta run in fall 2018 was third highest on record for the Shasta River.  The river’s fall-run population continues to benefit from improved water management.  Coho salmon and steelhead have yet to show significant improvements (Figure 2).

An February 26, 2019 article from the publication Grist (posted in 2/26/19 Maven’s Digest) describes changes to water management in the Shasta River.  The Nature Conservancy, using public grant funds, purchased the nearly 5000-acre Shasta Big Springs Ranch for $14 million in 2009.  More recently, the California Department of Fish and Wildlife purchased the water rights of the Shasta Big Springs Ranch.  Now, more water is left in the Shasta River, and only a third (1500 acres) of the ranch remains irrigated.  The article in Grist states that the new allocation of water has negatively affected the ranch’s ability to support wildlife and threatened its ability to support ranching.  In addition, the article questions the benefits of the new management regime to fish: “[T]he fish don’t seem to be doing much better either.”

While some will argue the relative values of ranching and fish protection,  I see no grounds to argue that changes in water management have not been positive to the Shasta River and Klamath River salmon.  Summer flows in the river below the ranch appear to have improved over the long term average (Figure 3).  Many of the Shasta River’s Chinook and Coho salmon spawn in the Big Springs area and in the river below Big Springs, and depend on flow and cold water input from the springs.  Even with the contribution of this flow, water temperatures are marginal (>65oF) for young salmon from May to September (Figure 4).

From my perspective, the loss of several thousand acres of irrigated pasture out of roughly 25,000 acres in the Shasta Valley seems a small price to pay for a large step towards the recovery of Shasta and Klamath River salmon.

Figure 1. Spawner-recruit relationship for Shasta River. Escapement estimates (log10X – 2 transformed) are plotted for recruits by escapement (spawners) three years earlier. Year shown is recruit (escapement) year. The number is the year that fish returned to the Shasta River to spawn. The color of the number depicts the water-year type in the Shasta River during the year the recruits reared. The color of the circle depicts the water-year type in the Klamath River during the year the recruits reared. Blue is for Wet water-year types. Green is for Normal water-year types. Red is for Dry water-year types. Example: 90 depicts fish that returned to the Shasta River as adult spawners in 1990. These fish were spawned in 1987 and reared in winter-spring 1988. The red number shows that the 1988 rearing year was a Dry water year in the Shasta River; the red circle shows that the 1988 rearing year was a Dry water year in the Klamath River. Note very poor recruits per spawner in 1990-1993 drought period, compared with relatively high recruits per spawner from 2011-2018, even though the latter period included the 2012-2016 drought.

Figure 2. Shasta River salmonid runs from 1930 to 2017. Source: https://www.casalmon.org/salmon-snapshots/history/shasta-river

Figure 3. Shasta River flows in the Shasta River below Big Springs 2016-2018 with 30 year average. Note summer base flow appears to have improved by approximately 10-30 cfs.

Figure 4. Water temperature in the Shasta River below Big Springs including summers of 2017 and 2018. Source: DWR CDEC.


Are Delta Smelt in Hot Water? Yes, and water management has been putting them there.

A March 14, 2019 post in Maven’s Notebook summarized a presentation at the 2018 Bay Delta Science Conference on Delta smelt growth factors in the Bay-Delta estuary. The main author, Dr. Hobbs, described UC Davis research on smelt growth rates from analysis of smelt ear-bone cross sections.

The research indicates that growth rate is related to salinity, water temperature, and water clarity (turbidity). Growth rates were depressed when salinity was above 3-4 parts per thousand (ppt),when water temperature exceeded 20-21oC, and when water clarity was relatively high.

Dr Hobbs also addressed the question: HOW WILL FLOW AUGMENTATION AFFECT THE DELTA SMELT?
“The answer generally is that it will have an effect if the flows will actually reduce salinity, increase turbidity or reduce temperature.” They found that flow affects salinity, but temperature and turbidity not so much.

  • “But from 2015-2017, we had an excessive period of time when it was above 22 degrees throughout the estuary.”
  • “The average temperature from 1999 to present shows that 2014 and 2015 were exceptionally warm and the water has been getting clearer throughout the estuary since the early 2000s. How are we going to manage freshwater flows to affect these other two important variables?”
  • “We’ve been thinking about how to manage freshwater flows for Delta smelt for the better part of 20 years, and what we need to be thinking about now is how do we manage temperature for Delta smelt? How do we manage temperature at all? Can we even manage temperature?”

My answer to the question about the effect of flow on Delta smelt is that flow is extremely important to salinity, water temperature, and turbidity, as thus Delta to smelt survival and population abundance.

  1. Dr. Hobbs implied that flow has little effect on water temperature, but he failed to mention that his two warmest years, 2014 and 2015, had the lowest spring-through-fall Delta inflows and outflows. Flow standards were relaxed in both years to save water in depleted reservoirs. He failed to mention that more flow keeps the low salinity nursery area of Delta smelt further west in Suisun Bay, where the air and water are cooler than the Delta.
  2. Dr. Hobbs also implied that flow has little effect on turbidity. But it is a fact that lower flows and higher exports in the 2000’s led to lower turbidities. More reservoir releases to feed south Delta exports lowers Delta turbidity. When the low salinity zone is west of the Delta, it benefits from the increased turbidity provided by higher winds and from more open shallow bays than are afforded by narrow deep Delta channels.
  3. Dr. Hobbs failed to mention that flow affects the transport of adults upstream to spawning areas and the movement of juveniles downstream to the low salinity zone nursery area.

Three additional points:

  1. Higher flows also benefit smelt food production and availability.
  2. Flow does affect the temperature of water entering the north Delta, in addition to affecting salinity and turbidity. In wet year 2017, summer inflows were low and consequently warm, negatively affecting smelt.1
  3. Smelt production is strongly related to the number of adult spawners (or eggs laid), and 2017 also suffered from poor numbers of spawners.2