Mokelumne Hatchery 2016-2018 Releases

In a post last year I remarked on the progressive management of the Mokelumne River hatchery. The hatchery is a mitigation hatchery operated by the California Department of Fish and Wildlife in partnership with the East Bay Municipal Utility District. Its activities over the past several decades have led to the recovery of Mokelumne River salmon.

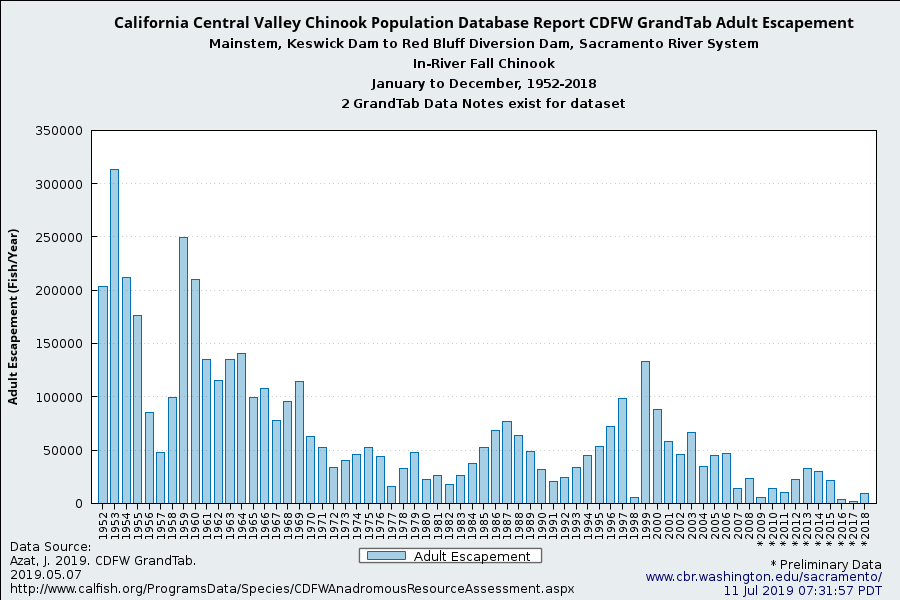
The hatchery’s 6 million smolt releases continue to survive well under present management practices (Figures 1 and 2). Escapement of adults to the river and hatchery below Camanche Dam have numbered from 10,000 to 20,000 in recent years,1 a remarkable improvement given that they were produced during the 2012-2016 drought period.

The hatchery is still learning under its adaptive management program. The program has a diversity of release strategies that provide valuable information about the program and what works and what does not. Table 1 shows a summary of their smolt releases from 2016.

Table 1.  Summary of Mokelumne Hatchery smolt releases in spring 2016.  Source:  https://www.rmpc.org

Release Date Release Location Smolts Released
4/20/16 Sherman West Delta 902,000
4/27/16 Sherman West Delta 470,000
5/05/16 Sherman West Delta 450,000
5/09/16 Mokelumne River 102,000
5/10/16 Golden Gate Bridge 202,000
5/12/16 Sherman West Delta 902,000
5/20/16 Sherman West Delta 920,000
5/25/16 Half Moon Bay (coast) 485,000
5/26/16 Mokelumne River 402,000
5/28/16 Sherman West Delta 915,000
6/03/16 Sherman West Delta 771,000
2016 Total 6,521,000

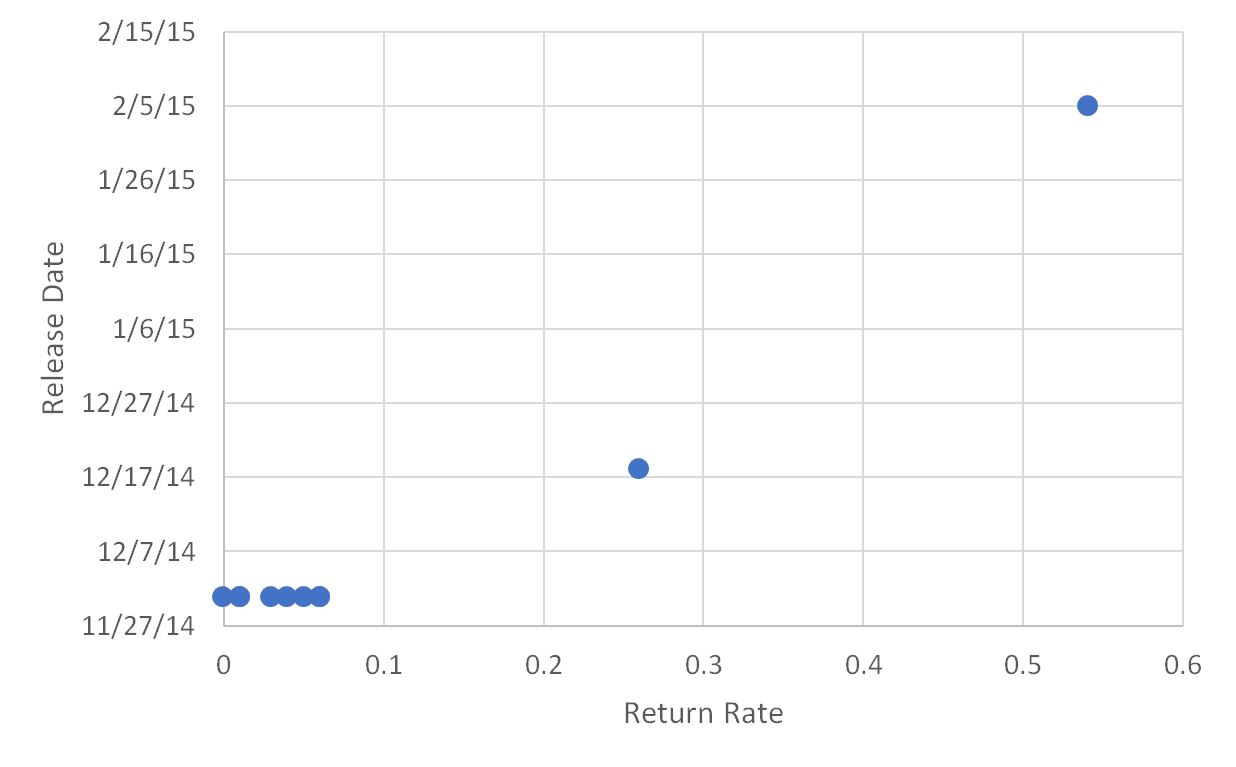
Returns from the 2015 spawn year (brood year 2015) from code-wire-tagged smolt groups released in below-normal/dry water year 2016 ranged from near zero to two percent (Figure 3). The half-million smolts released to the river had near zero returns to fisheries and river/hatchery, while the half-million releases to Half Moon Bay on the coast south of San Francisco had a good return of 2.2 percent. Returns from the remaining 5.5 million smolts released at Sherman Island in the west Delta ranged from 0.1 to 1.4 percent.

The wide-ranging survival rates provide clear guidance for future hatchery smolt-release management.

  • April releases do not fare as well as May releases, suggesting that the larger size of May smolts provides a survival advantage.
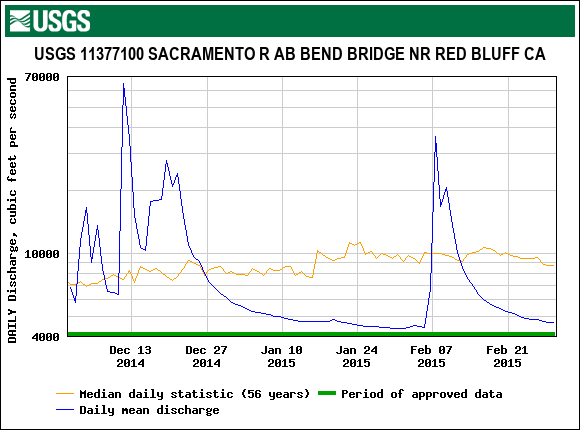
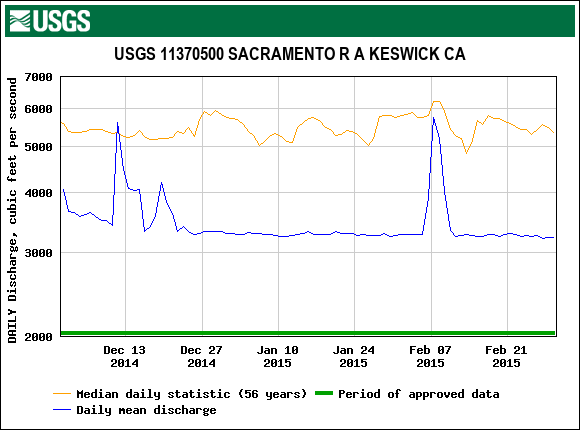
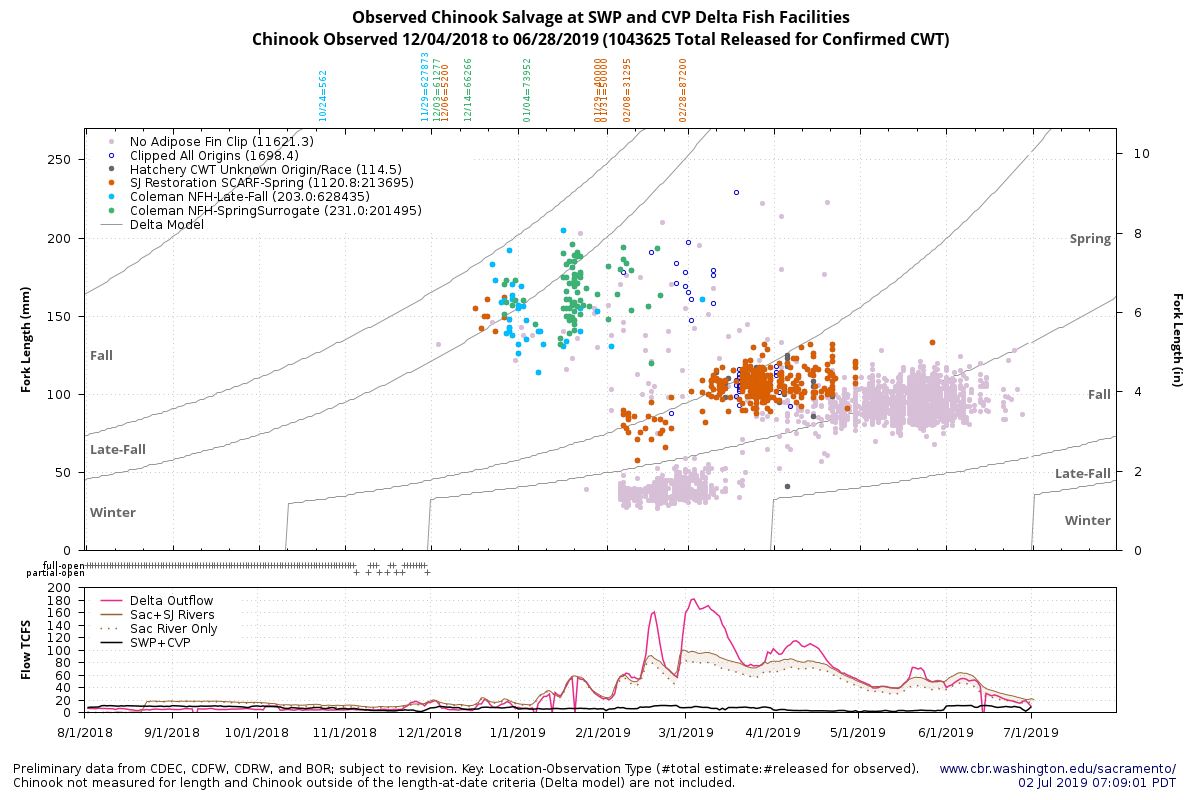
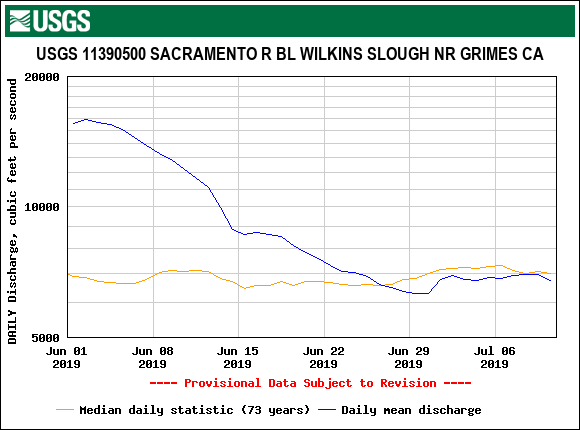
  • River releases in a below normal or dry year like 2016 have poor survival, especially with below average freshwater flows in the lower San Joaquin River (Figure 4) and low Delta outflow (Figure 5).
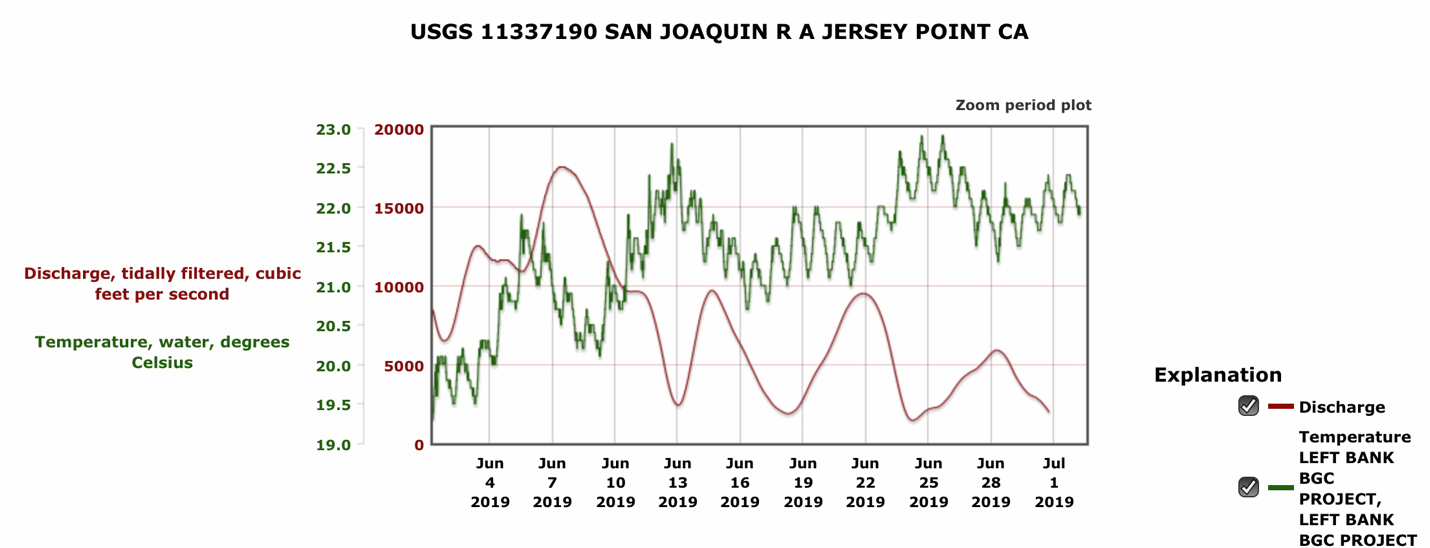
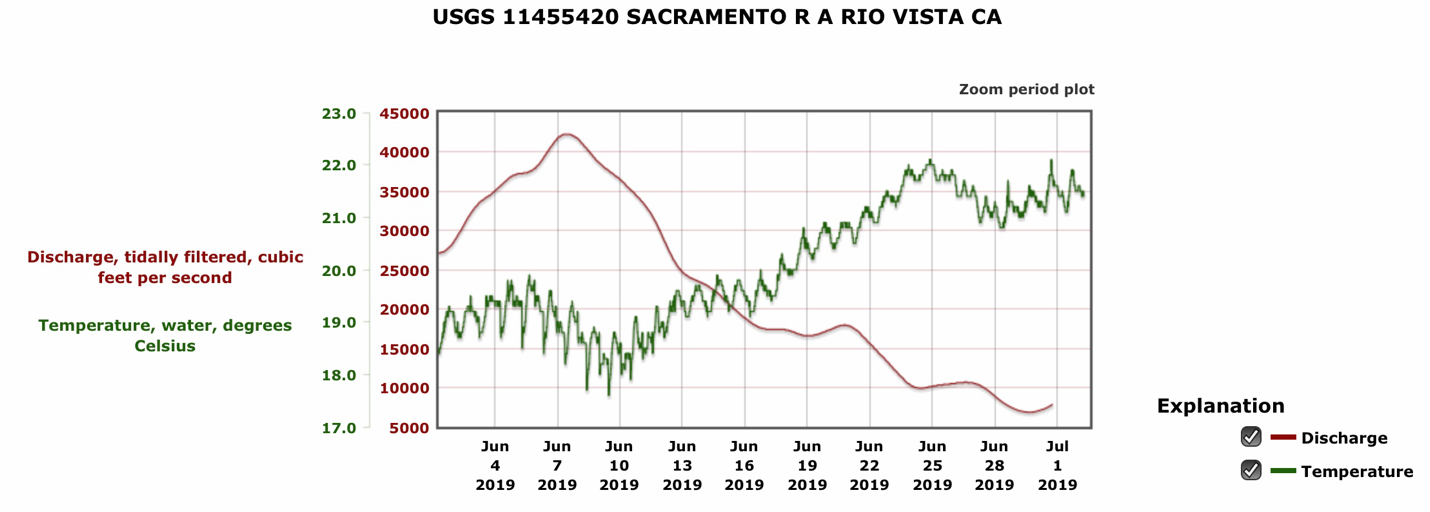
  • Releases at Sherman Island in the west Delta in early June had poor survival compared to May releases, coincident with rapidly falling flows (Figures 4 and 5) and rising water temperatures (Figure 6).

2017 and 2018 release strategies were similar, but weighted more heavily toward Bay and ocean releases.

  • Over one million smolts were released on the coast and at the Golden Gate in 2017; 730,000 in 2018.
  • Most of the 4 million smolts released at Sherman Island in 2017 were released in May.
  • Over 4 million smolts were released at Sherman Island in 2018 from mid-April to early June over a broad range of conditions.
  • Nearly 500,000 smolts were released in the Mokelumne River in 2017 and 2018. The 2017 smolts were released in June of a wet cool year, while the 2018 releases were in May of a drier, warmer year.2

If and when information on the tag returns from 2017 and 2018 releases becomes available, it may be possible to move toward a still more effective release strategy that increases smolt survival and contributions to fisheries and river escapement.

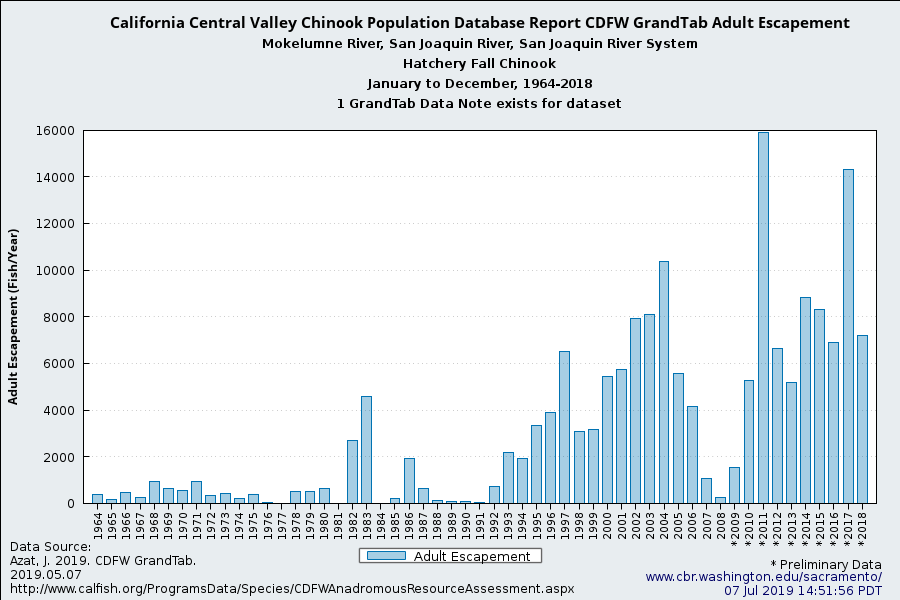
Figure 1. Escapement estimates to the Mokelumne Hatchery 1964-2018

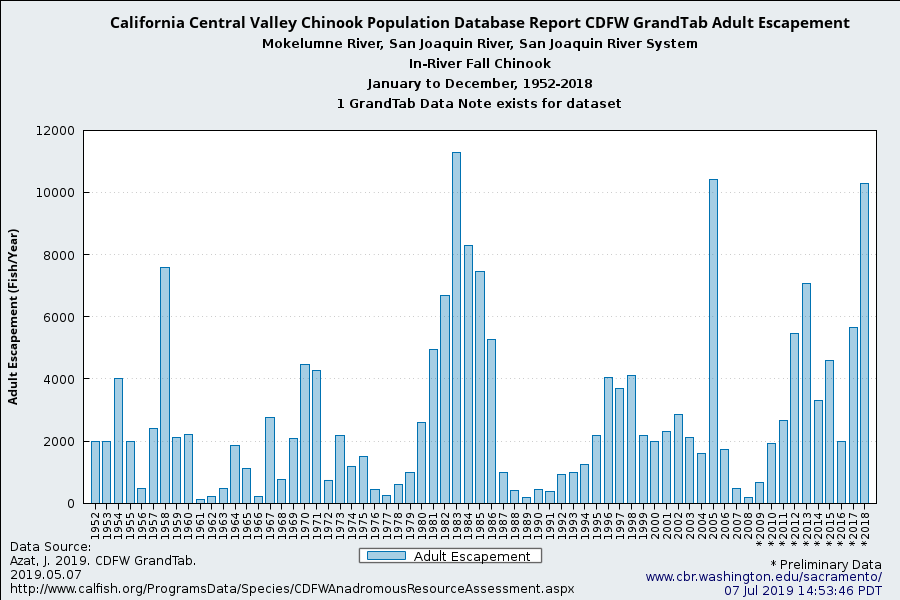
Figure 2. Escapement estimates to the Mokelumne River 1952-2018.

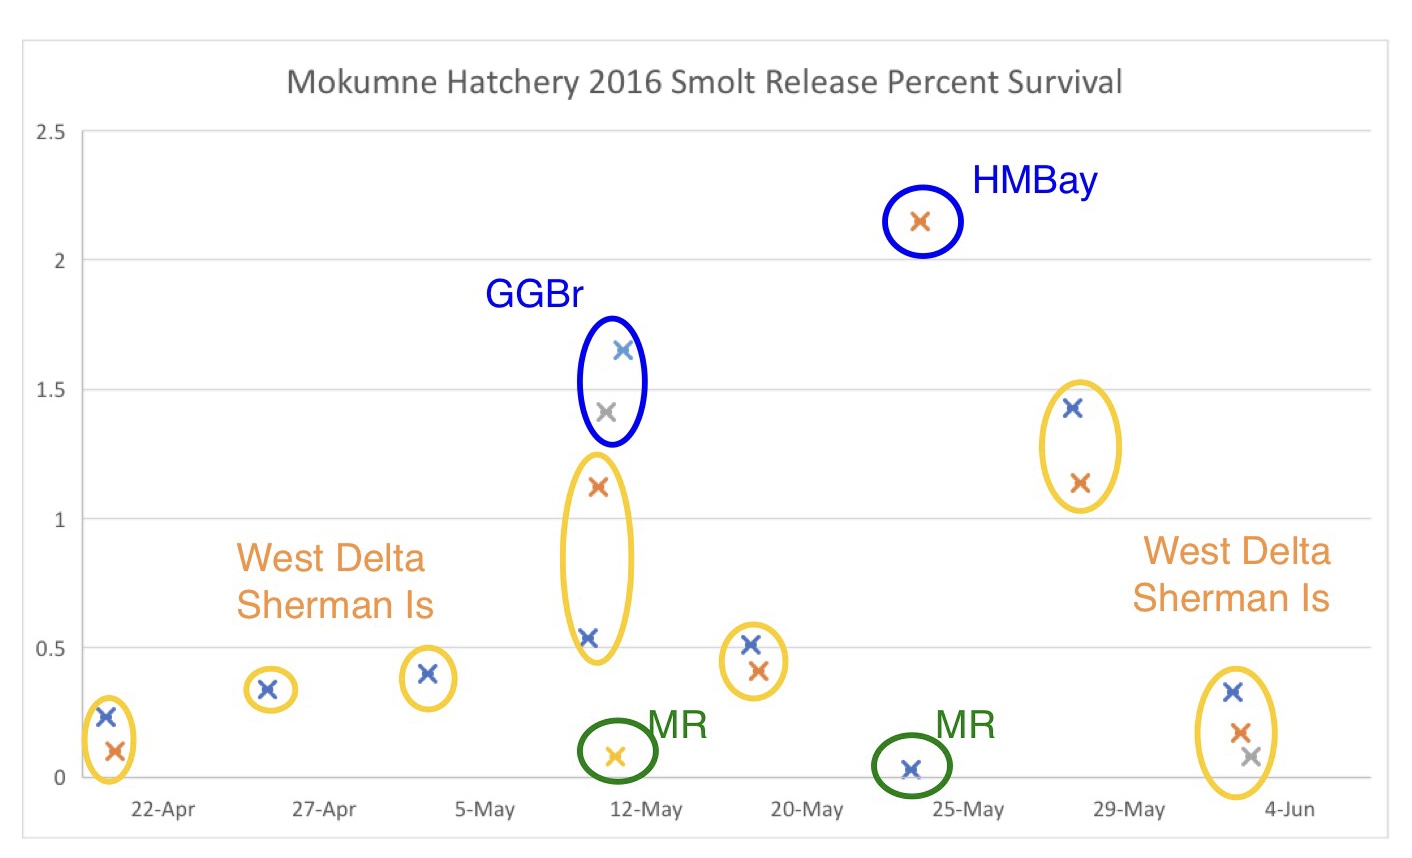
Figure 3. Percent return of 2016 Mokelumne Hatchery tagged smolt releases. Source: https://www.rmpc.org

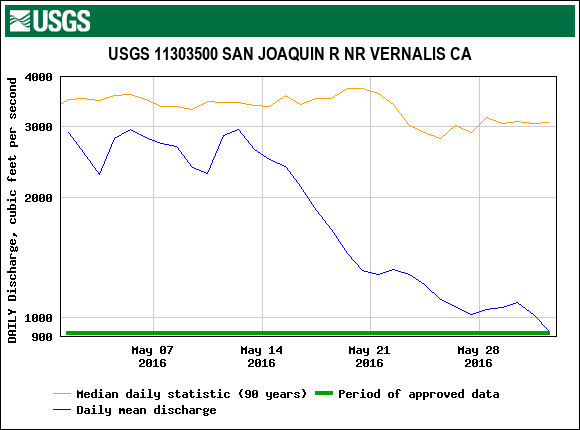
Figure 4. Inflow of San Joaquin River to the Delta in May 2016 along with long-term median flow.

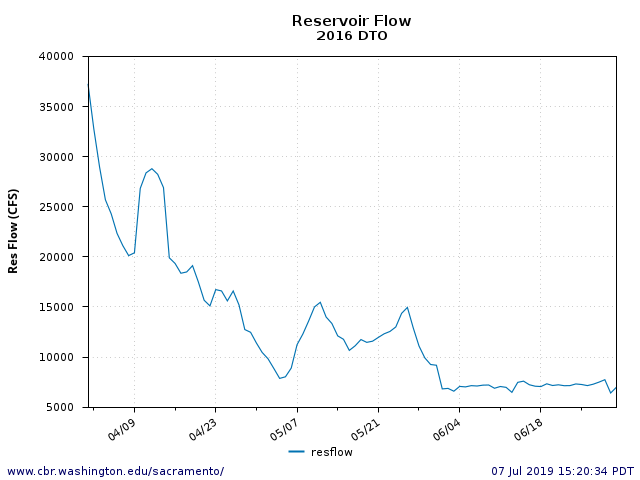
Figure 5. Delta outflow in spring 2016.

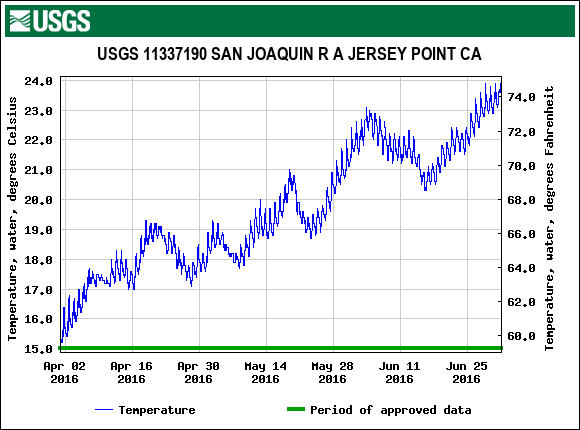
Figure 6. Water temperature in lower San Joaquin River at Jersey Point in spring 2016.

  1. The American and Feather River escapement has been 20,000-30,000 and 40,000-60,000, respectively, for similar numbers of smolt releases.
  2. Note that San Joaquin River flows and Delta outflows are most important to Mokelumne Hatchery smolts, as the closure of the Delta Cross Channel results in the Mokelumne River being a tributary of the lower San Joaquin River.

Delta Science Plan – It’s not that complicated

From Delta Science Plan Figure 1-1 | Network map of collaborative groups in the Delta

From Delta Science Plan Figure 1-1 | Network map of collaborative groups in the Delta

The new Delta Science Plan (Plan) is a “call” for more collaborative science to improve government decision making affecting the Delta ecosystem.  The first page announces the vision for the plan as being “One Delta, One Science.”  Really?

Science is not just one thing; it is many things.  Science is knowledge.  Delta science is knowledge on what makes up the Delta and how it all works together.  There is science for all Delta social, economic, and ecosystem components.  There is Delta smelt science.  There is Sandhill Crane science.  There is science on water quality, water supply.  There is science on roads, farming, and flood control.  There is science on large ship movement through the Delta.  The Science can be good, bad, or simply inadequate; it is only as good as the predictions and decisions that one can make from it.

What is missing from the current Plan is a presentation of the major actions that will affect the Delta ecosystem and the ramifications these actions would have on the ecosystem.  Also missing is a description of key decisions to be made relating to these actions and the associated science needed to make the decision.

Each ecosystem component should have science and advocates that can assess how specific actions can affect the resources related to that component.  Delta smelt should have its science and advocates.  These folks need not communicate with the crane folks.  On the other hand, the smelt folks may need information from the water folks.  Each action should have its own science and science group to understand what the action entails and how it might affect other ecosystem components.  Each decision process and decision group should have its science.  Each group may need information from other science groups.

The Plan should include a compilation of each ecosystem component’s science and needs, and a clear depiction of the important actions and decisions under consideration for that component.  A good plan would summarize the science of each ecosystem component, each major action being considered, and each major decision being contemplated.

The overall success of the Plan will depend on how good the science is in predicting outcomes.  Each science group is responsible for its own science, as well as how other groups use it.

Stakeholders need a Plan that instills confidence that each ecosystem group knows its science.  Stakeholders also need to know what actions are being planned and how decisions will be made.

Personally, I want to see what the smelt science indicates that smelt are lacking in the Delta ecosystem.  I want to see a description of how the USFWS/CDFW plan to restore Delta smelt.  I want to see how the State Board plans to set new Delta water quality standards.  I hope to see how Delta levees will be addressed.  I want to know whether Delta flow barriers are being considered and what factors may affect that decision.  I am interested in the future for Sandhill Cranes and the factors that may affect that future.  And I want to know how each ecosystem component will address climate change.

In summary, I want to see a plan that includes a description of our understanding of each key Delta ecosystem component, what actions involving the Delta are being considered, and what decisions that might affect the Delta are being contemplated.


Late-Fall-Run Salmon – Latest Update

In a January update on late-fall-run salmon, I noted record low runs of late-fall-run Chinook salmon to the upper Sacramento River in 2015 and 2016. That trend continued in 2017 (Figure 1), as shown in recent data published by the California Department of Fish and Wildlife.  Spawning runs from 2015-2017, the product of runs from the 2013-2015 drought, were three lowest since year 2000.

As it was for spawning run 2013, the rate of return for 2014 spawning run of tagged late-fall-run hatchery smolts was very low (Figure 2).  I concluded in the prior post that low river flows and lack of flow pulses caused the poor return rate.  There were flow pulses in winter 2014-15 (Figure 3).  However, only the later season release group responded strongly favorably to a flow pulse (Figure 4).  This  suggests that later winter releases of fish from the hatchery, in combination with flow pulses, provides higher rates of returns for hatchery fish.  Prescribed flow pulses from Shasta Reservoir in dry winters like 2014-15 (Figure 5) appear to improve survival of late-fall-run hatchery smolts.

Figure 1. Spawner-recruit relationship for late-fall–run salmon. Number is log10-3.5 transformed escapement (recruits) for the fall of that year. For example, year “16” represents escapement for late fall 2016, which includes spawners from early winter 2017. Spawners represent escapement from three years earlier (brood year). In the example, spawners for year 16 were the progeny of escapement in 2013. Colors represent winter rearing condition two years earlier. In the example, red “16” represents dry winter 2014. Green represents normal years two years earlier. Blue represents wet years two years earlier.

Figure 2. Hatchery smolt survival for brood years 2008-2013 based on coded-wire-tag returns.

Figure 3. Winter 2014-15 Sacramento River flows downstream of Battle Creek along with 50-yr average.

Figure 4. Return rates by date of release for late-fall-run tagged hatchery smolt release groups from winter 2014-15. Source: https://www.rmpc.org

Figure 5. Winter 2014-15 Sacramento River flows downstream of Shasta Dam along with 50-yr average. Note short term reservoir water releases in December and February prescribed to support upper river hatchery smolt outmigration.

Delta June 2019

Water year 2019 has been a very wet year.  Yet salmon and sturgeon survival was compromised by low flows and high water temperatures in the Sacramento River this spring.1 Young salmon survival has been further compromised by low flows, high exports, and high water temperatures in the Delta this past June.

Many of the wild smolts produced in Central Valley rivers this year entered the Delta in May and left (or died) by the end of June, as observed in Delta export salvage collections (Figure 1).  Many of the wild smolts captured in the south Delta likely originated from San Joaquin tributaries.  South Delta exports were near maximum at 10,000 cfs, about 70-80% of San Joaquin inflow to the Delta and 20% of total Delta inflow.  The high exports caused lower flows and associated high water temperatures (>20oC) in the Delta channel of the lower San Joaquin River (Figure 2), and contributed to similarly high temperatures in the lower Sacramento River channel (Figure 3).

The high Delta water temperatures (>20oC) compromised the survival of the salmon smolts in June.  Reducing the export limit to 5000-6000 cfs in June of this wet year would have kept the water temperature near a 20oC limit.  The water quality standards in the 1980’s and 1990’s under D-1485 had a 6,000 cfs June export limit.  In the past two decades under D-1641, the June export limit changed to 65% of total inflow.

New Delta water quality standards should provide export limits and inflow/outflow minimums that protect salmon through the spring months.

Figure 1. Chinook salmon salvage at south Delta export facilities in 2019. Note the prevalence of wild (non-hatchery) smolts in May-June.

Figure 2. Water temperature and tidally-filtered flow at Jersey Point in the lower San Joaquin River channel of the Delta in June 2019.

Figure 3. Water temperature and tidally-filtered flow at Rio Vista in the lower Sacramento River channel of the Delta in June 2019.


Sacramento River Salmon Opener Compromised

The California Department of Fish and Wildlife announced in May that the salmon season on the Sacramento River would commence below Red Bluff on July 16, with high expectations and expanded limits.

 “California’s inland salmon anglers can look forward to a better salmon fishing season than last year. A projected return of 379,600 spawning Sacramento River fall-run Chinook Salmon to Central Valley rivers has allowed fishery managers to return to a two salmon daily limit with four salmon in possession. This is a welcome increase over last year’s regulations, which restricted anglers to one salmon per day and two in possession.”

Yet despite near record water and a full Shasta Reservoir, the federal government is compromising the run with high water temperatures from low reservoir releases and high river diversions that violate state water quality regulations and water right permit requirements.

River flow near Red Bluff is just above 12,000 cfs (Figure 1), about 1000 cfs below average for this time of year.  River flow in the river a hundred miles downstream, upstream of the mouth of the Feather River, is just below 7000 cfs, also slightly below average (Figure 2).  The flow difference between the two locations reflects water deliveries to federal water contractors near 5000 cfs.

The high diversions and low flows result in high water temperatures in the lower river (Figure 3) that will compromise the fishery opener as well as survival and egg production of this fall’s spawning run.  The salmon run is already in a long-term decline (Figure 4) from poor water management and violations of standards and permits conditions.

Why allow the federal government to squeeze out more of California’s precious water and salmon?  Increasing Shasta releases or reducing diversions, or a combination thereof, by about 1000-2000 cfs should protect the migrating salmon and provide a better fishery opener.  With triple-digit weather forecasted for the latter half of July, it is imperative that river flows be increased.

Figure 1. Sacramento River flow near Red Bluff June-July 2019.

Figure 2. Sacramento River flow near Grimes at Wilkins Slough June-July 2019.

Figure 3. Sacramento River water temperature below Wilkins Slough June-July 2019. Note that water quality standard is 68oF, above which salmon become stressed.

Figure 4. Sacramento River fall-run salmon escapement 1952-2018.