
Just a quick update on Delta fisheries on August 1, 2016. Delta outflow this spring-summer for this below-normal water year was as expected, except for the pulse of up to 14,000 cfs in the July experiment to help Delta Smelt (Figure 1). Year 2000, an above-normal year and a pre-Pelagic Organism Decline year, is shown for comparison.
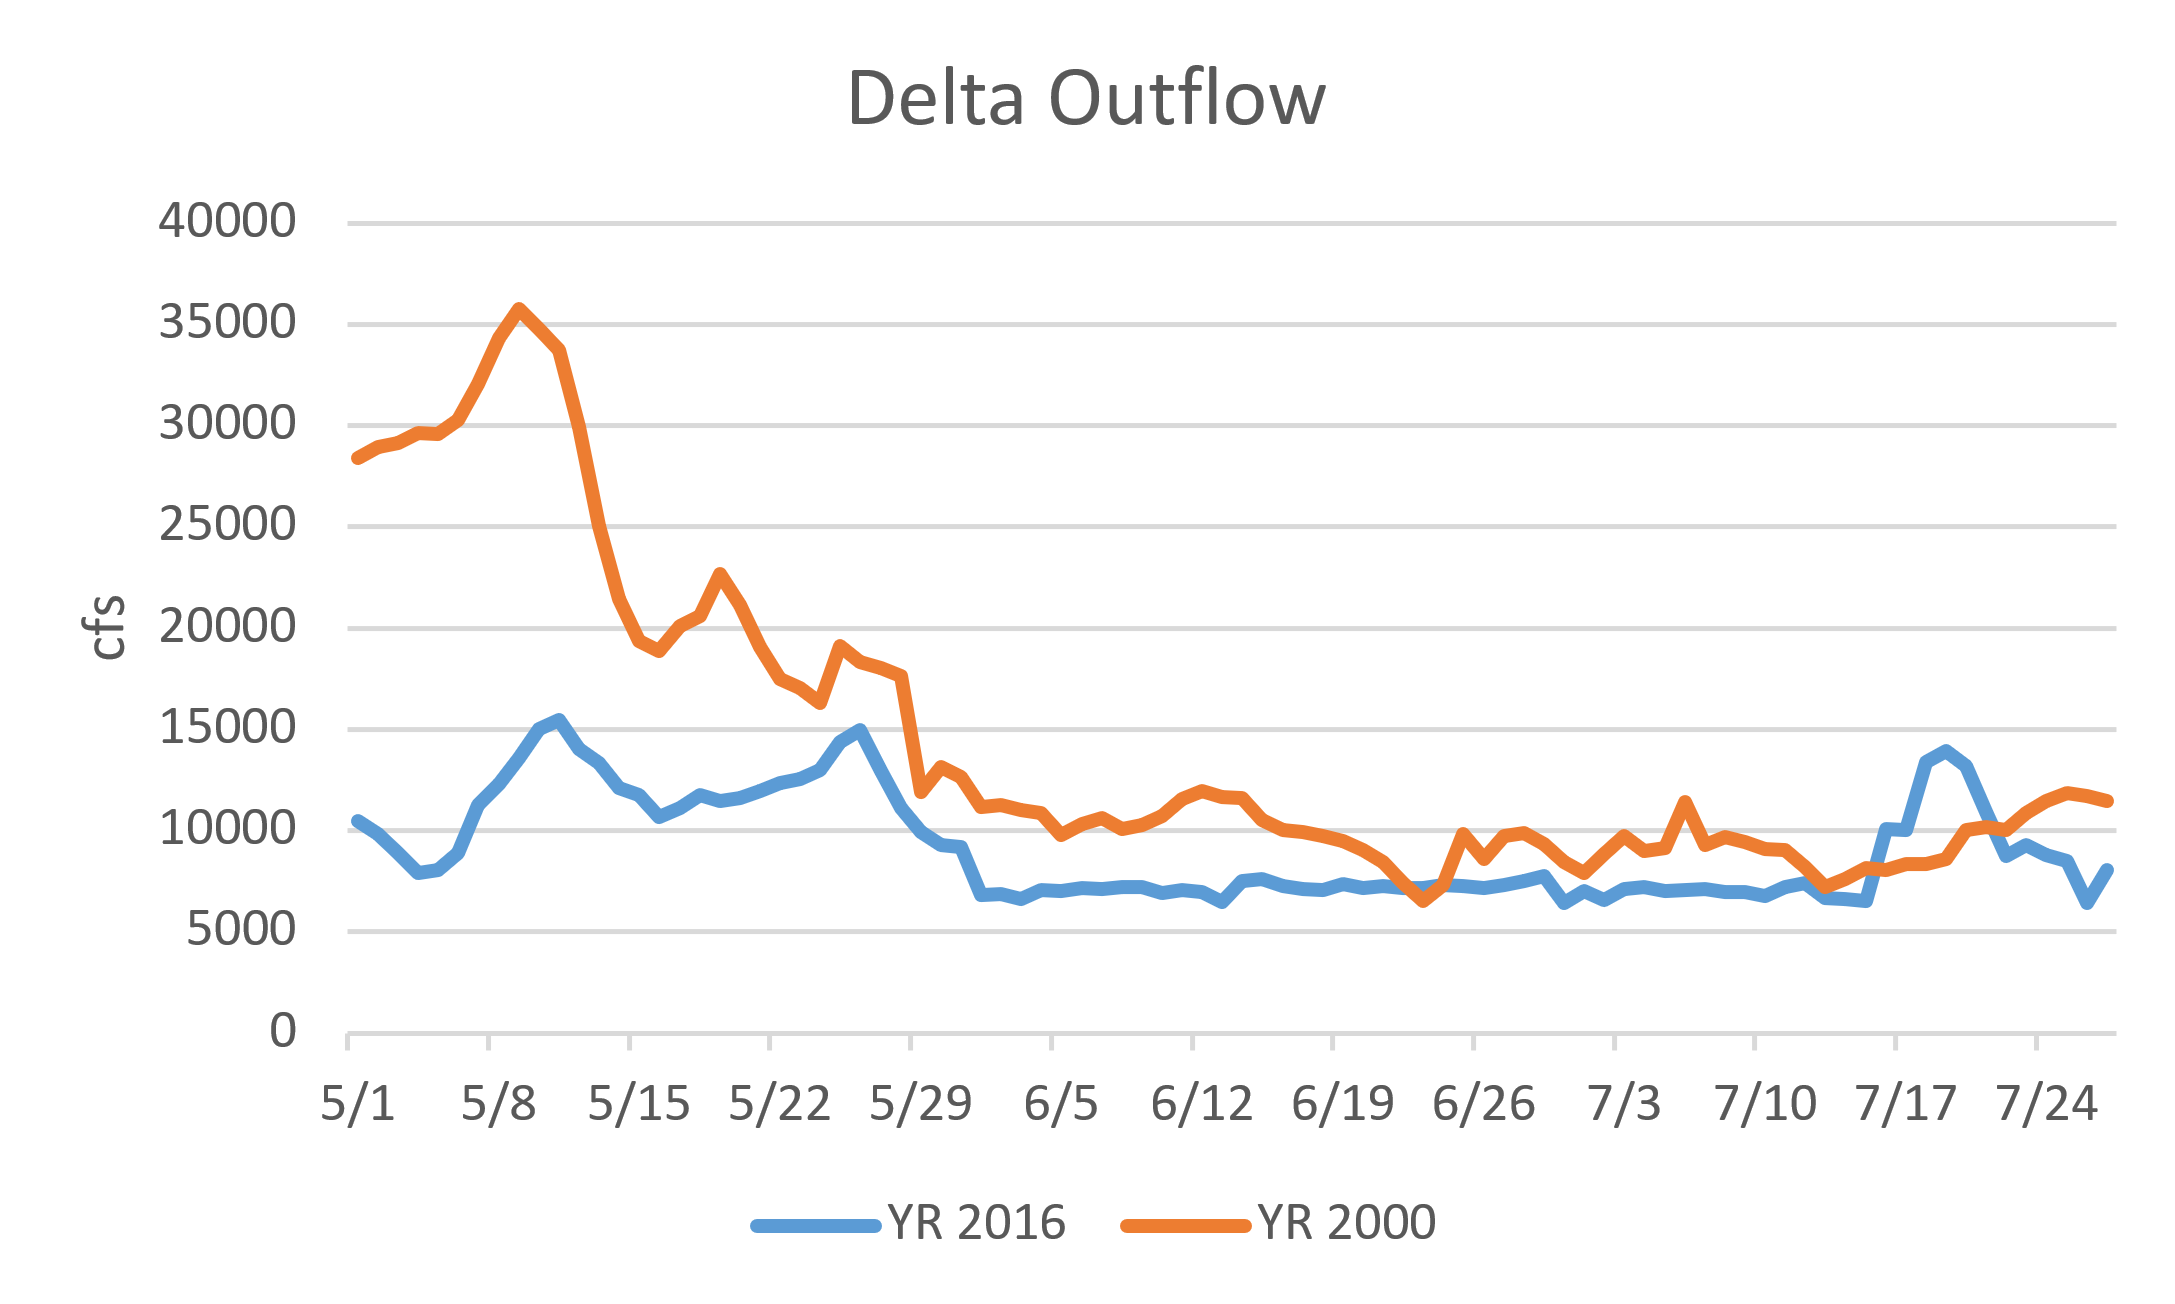
Figure 1. Delta outflow May-July 2000 and 2016.
Striped Bass
My earlier optimism for this year’s striped bass production continues to fade. I continue to believe that the poor success is related to poor early summer Delta outflow based on comparison with year 2000, the last decent year class produced by striped bass in the Bay-Delta as determined by the June Summer Townet Survey. Figures 2 and 3 show abundance and distribution in 2000 and 2016, respectively. Densities were an order of magnitude higher in 2000, after spring larvae abundances were similar between the two years. Figures 4 and 5 show spring-summer salvage at south Delta pumps for 2000 and 2016, respectively. Again, much higher salvage in 2000 reflects the order of magnitude greater abundance in 2000 than in 2016.
Delta Smelt
Delta Smelt continue to be virtually extinct in the Bay-Delta. Figures 6 and 7 show abundance and distribution in 2000, the last near normal abundance year (pre-Pelagic Organism Decline), and 2016, respectively. Figures 8 and 9 show spring-summer salvage at south Delta pumps for 2000 and 2016, respectively. The relatively high salvage in 2000 reflects the general abundance at the end of the 90’s. The fact that there are no longer Delta Smelt in the 2016 Townet Survey or in salvage is a very clear indication that Delta Smelt are virtually extinct. The July experiment, though well intended, was a little too late.
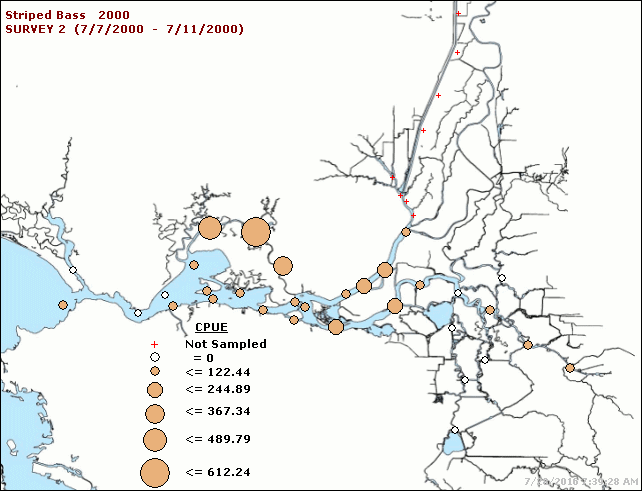
Figure 2. Striped Bass catch per 10,000 cubic meters in June 2000.
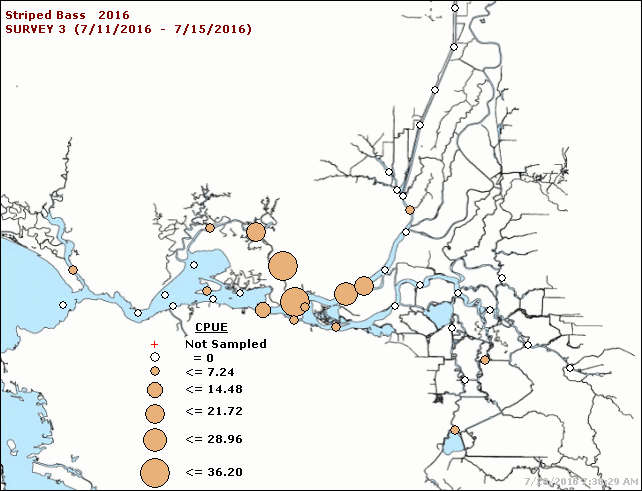
Figure 3. Striped Bass catch per 10,000 cubic meters in June 2016.
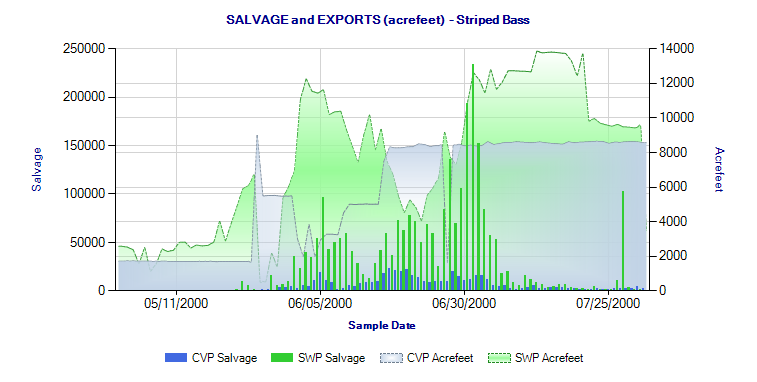
Figure 4. South Delta salvage of Striped Bass May-July 2000.
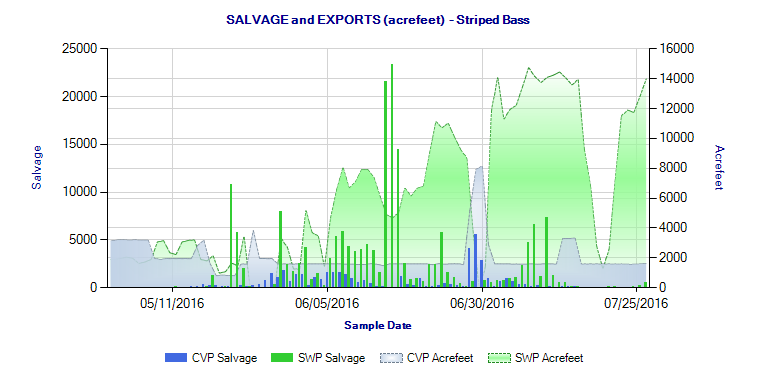
Figure 5. South Delta salvage of Striped Bass May-July 2016.
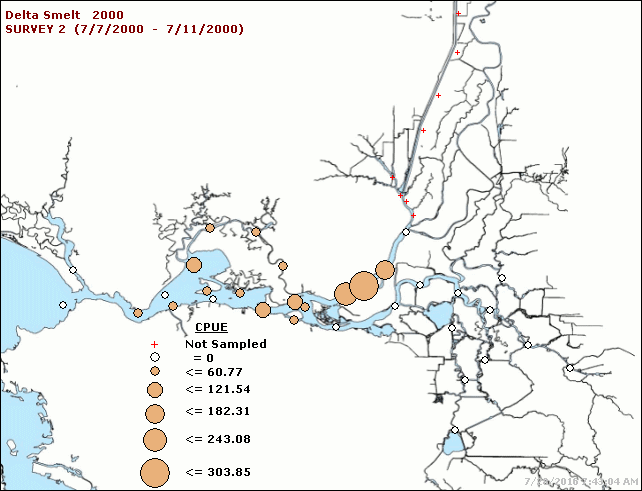
Figure 6. Delta Smelt catch per 10,000 cubic meters in June 2000.
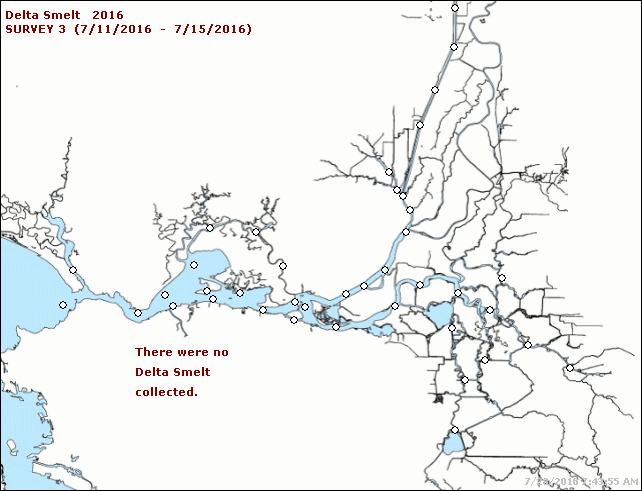
Figure 7. Delta Smelt catch per 10,000 cubic meters in June 2016.
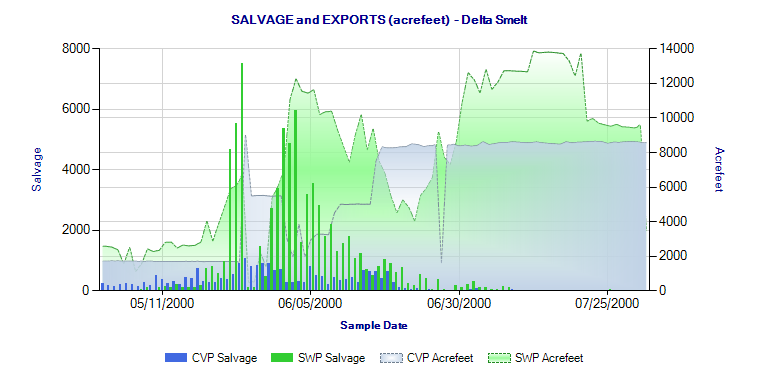
Figure 8. South Delta salvage of Delta Smelt May-July 2000.
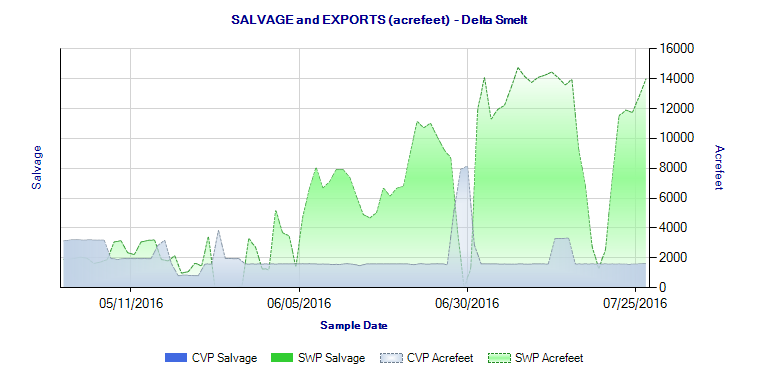
Figure 9. South Delta salvage of Delta Smelt May-July 2016. (Salvage was zero.)