Before the 2012-2015 drought, Delta smelt had a recovery period in 2010 and 2011. Now, in 2016, there remains an opportunity for some form of recovery, albeit small. What is needed is exactly what the US Fish and Wildlife Service has been pleading for so far this spring to save Delta smelt: more Delta outflow.
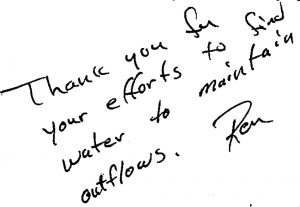
This note was at the bottom of the USFWS’s last Delta smelt determination memo to the USBR on June 1, 2016.[1] This literally was their last action this year under the Delta Smelt Biological Opinion because there are no protections in summer once the South Delta reaches a water temperature of 25°C (77°F).
To move the largest remaining concentration of this species in existence downstream, it will take outflows of about 10,000 cfs. Right now outflows are about 7500 cfs (see chart 1, below), the minimum required under present water quality standards. The fisheries agencies and the water projects need to find a way to make up the difference as soon as possible.
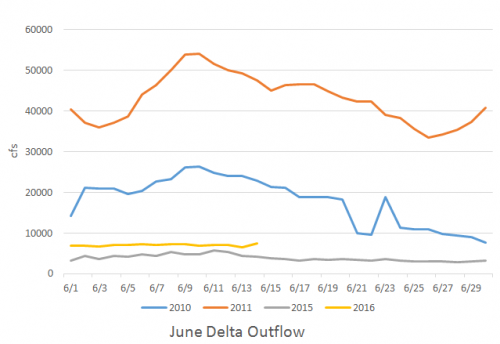
Chart 1. Delta outflow in June 2010, 2011, 2015, and 2016. 2011 was a Wet year. 2010 and 2016 are Below Normal water years. 2015 was a Critically Dry year.
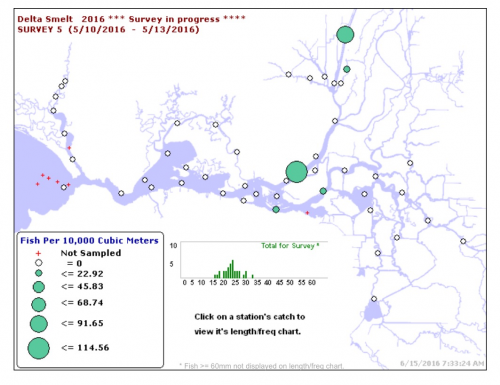
Figure 1. Mid-June 20-mm Smelt Survey 2016. Largest green dot is in north side of Sherman Island in Sacramento River channel of west Delta.

Figure 2. Mid June 20-mm Smelt Survey 2010. Note smelt length-frequency chart at bottom-center of chart, which also depicts total caught in survey.
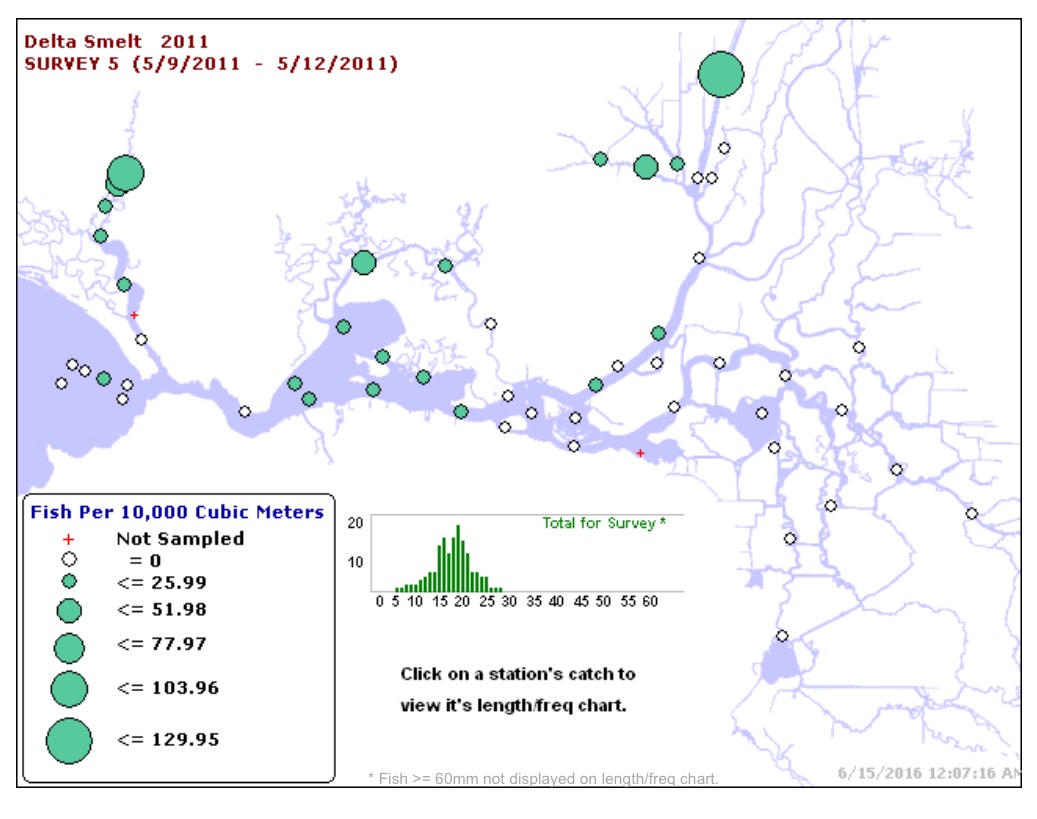
Figure 3. Mid-June 20-mm Smelt Survey 2011.

Figure 4. Mid-June 20-mm Smelt Survey 2015. Large green dot is in Sacramento Deep Water Ship Channel.
[1] https://www.fws.gov/sfbaydelta/documents/smelt_working_group/ R8_Signed_Determination_Memo_to_BOR_06-01-2016.pdf


