Tim Quinn, Executive Director of the Association of California Water Agencies (ACWA), is trying again, as in so many of his blog posts, to hornswoggle us into believing that many of this year’s water woes have been caused by “overzealous” fish protections.1 His August 17, 2016 post on the Association of California Water Agencies (ACWA) website is focused on why San Luis Reservoir in the San Joaquin Valley has such low water storage this summer. San Luis storage went from 50% of capacity at 1 million acre-feet (MAF) at the beginning of April to 0.2 MAF (10% of capacity) at the beginning of August. All to human use.
Mr. Quinn correctly points out that lack of federal Delta exports to San Luis was due to a concerted effort by the Bureau of Reclamation to conserve Shasta Reservoir’s storage and cold-water pool to save this year’s spawn of winter-run salmon in the Sacramento River below Shasta. In 2016, federal and state agencies were gravely concerned about protecting this year’s spawn of winter-run salmon below Shasta. The past two years’ spawns had been wiped out after Shasta ran out of cold water. So after Shasta filled and spilled in late March, releases to the Sacramento River were limited to retain Shasta’s cold-water pool to sustain salmon through the summer (Figure 1). Releases (Shasta reservoir outflow) from the first of April through the end of July were about 700,000 acre-feet less than normal, saving reservoir storage and the cold-water pool. Instead of falling to 2.9 (MAF) of storage (64% of capacity) at the end of July as would more typically have been the case, Shasta was drawn down only to about 3.6 MAF (80% of capacity).
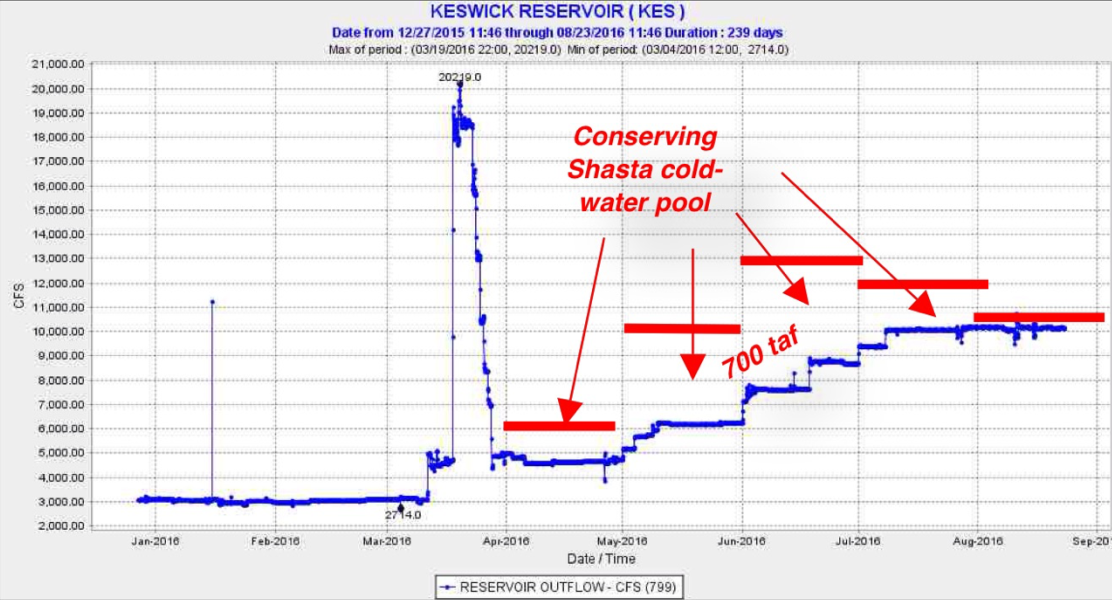
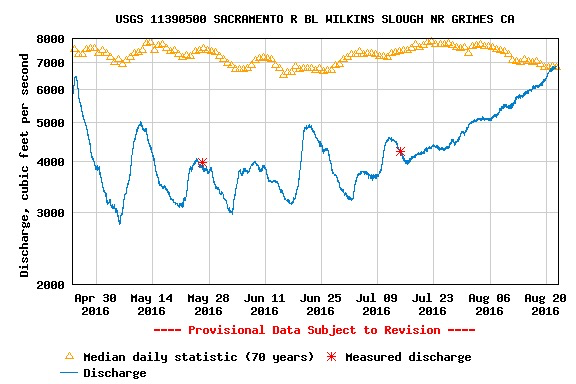
Figure 1. Sacramento River flow below Shasta/Keswick reservoirs near Redding. Red lines depict normal-release-pattern river flows at Redding.
But there is more to the story. Sacramento Valley water contractors still took their normal allotments from the reduced Sacramento River supply, leaving little for San Luis. State Water Project contractors exported near the maximum from their Delta diversion facilities at Clifton Court this summer, using Oroville Reservoir water, while federal exports were less than 50%. Federal Folsom Reservoir water was used for Delta outflow requirements so that State Water Project exports could be accomplished (the feds owed the state water from 2015). Folsom, which started the year nearly full at 850 TAF, is now only at 40% of capacity and has once again closed its marinas. Ironically, enough water has flowed from the Delta this summer to (State Water Contractor) Metropolitan Water District’s Diamond Valley Reservoir in southern California to allow the Met to open its Diamond Valley marinas.
Just to be equitable, Mr. Quinn doesn’t blame only the salmon. He also blames the San Luis problem on the fact that “federal officials over-cautiously kept [Delta] pumping levels very low to protect Delta smelt” during winter storm pulses (Figure 2). He correctly states that restrictions on the federal and state water projects in the biological opinion for Delta smelt kept winter exports from the Delta at 20-70% of capacity. But again, where’s the context? Project operation in 2014 and 2015 just about obliterated the last remnant Delta smelt, and the some of the few pesky smelt that survived were indeed found to be spawning in the central Delta, not far from the export pumps, during the winter. Before we throw around adverbs like “over-cautiously,” perhaps we should balance with “recklessly” when we talk about what happened to bring us to a situation that demands such caution.
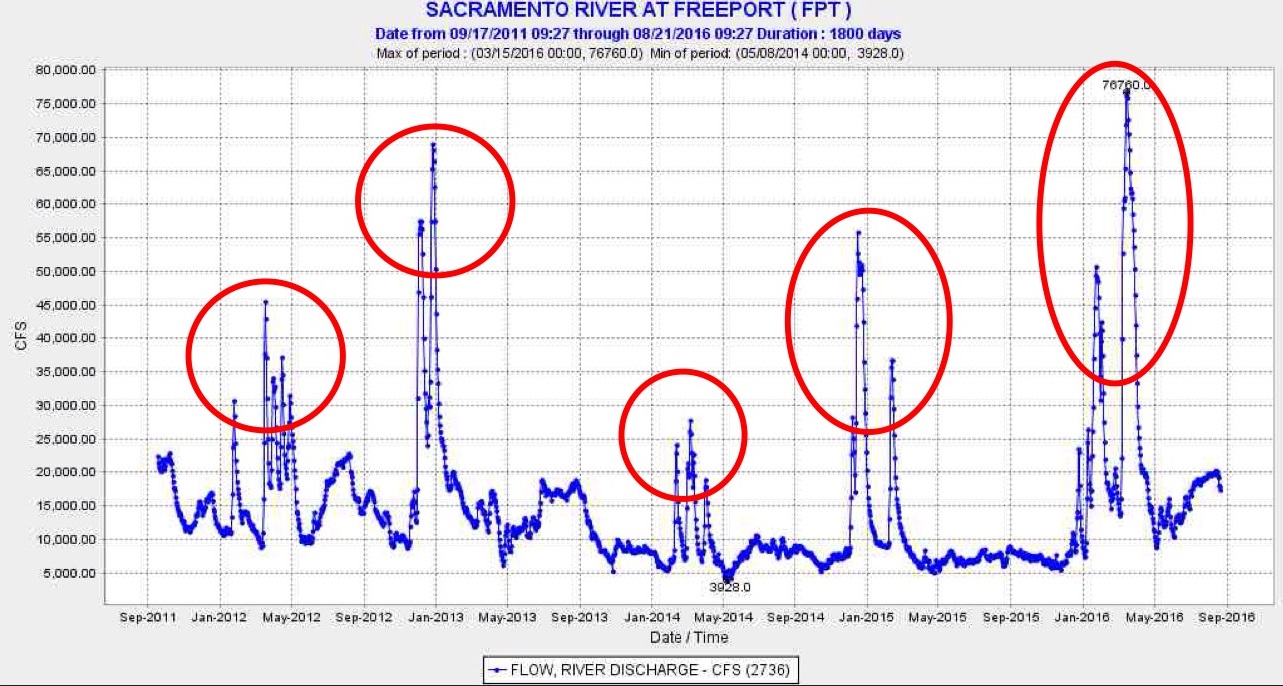
Figure 2. Storm pulses in the last five years from the Sacramento River into the Delta.
Mr. Quinn further states:
This scenario underscores the peril of regulatory agencies focusing almost exclusively on species protection at the expense of water supply. Moreover, efforts to protect endangered fish virtually always narrowly focus on a single element – temperature control or flows – while failing to address other important factors affecting the species. Allowing a single-stressor approach to drive water management decisions only serves to maximize conflict between species protection and water supply, while failing to adequately serve either. And we continue to lose water supply every day as a result.
Well, the water is needed by all the fish species, including all six listed species. It is needed for habitat, water quality, and all ecosystem functions in the rivers, Delta, and Bay.
About half of the water that hits the watershed eventually does reach the Bay as Delta outflow in the drier years, primarily during infrequent winter storms (Figure 2). Much of the rest of the outflow is needed to repel saltwater intrusion into the Delta, so that the water in the state and federal canals is not too salty to export. Annual runoff to the Bay ranges from about 5 to 10 MAF in these drier years. The State Water Board’s staff has said that the estuary needs 75% of unimpaired runoff to be healthy.
During winter storm pulses in a year that follows a dry year sequence, about 60-80% of the water (immediate rain and later snowmelt) is captured in Mr. Quinn’s constituents’ Central Valley rim reservoirs for summer use. In 2015, it was even worse: approximately 50% of the inflow to the Delta from the Central Valley in 2015 occurred during two storm periods. Most of the inflow came from undammed streams and local runoff, while the major reservoirs were capturing 80-90% of their inflow.
The big storms carry the offspring of salmon, steelhead, and sturgeon to the Bay, and represent most of the Bay’s freshwater inflow for the year. With the reservoirs capturing most of the inflows in the really bad years like 2015 , the rivers downstream of the major reservoirs, streams like the Sacramento, Feather, America, Mokelumne, Stanislaus, Tuolumne, Merced, and San Joaquin, get little winter water for fish spawning, rearing, and migrations.
The flow in rivers, the Delta, and the Bay directly or indirectly controls or partially controls all the stressors affecting the listed species. Flow even controls the water districts’ favorite stressor, predation.
Now, Mr. Quinn and his colleagues want us to pay untold billions of dollars for the California “Waterfix,” so they can take more water, especially during the infrequent storms in dry year winters. In the two storm pulses in winter 2015, the WaterFix Tunnels could have been operating at near capacity for about 30 days to take an added approximately 500 TAF, or about 20% of the total from the two storm pulses of Delta outflow. Instead of half the Valley inflow reaching the Bay, only 40% would make it due to the new Tunnels.