The Twin-Tunnels Project: A Disaster for Salmon Part 1 of a Series

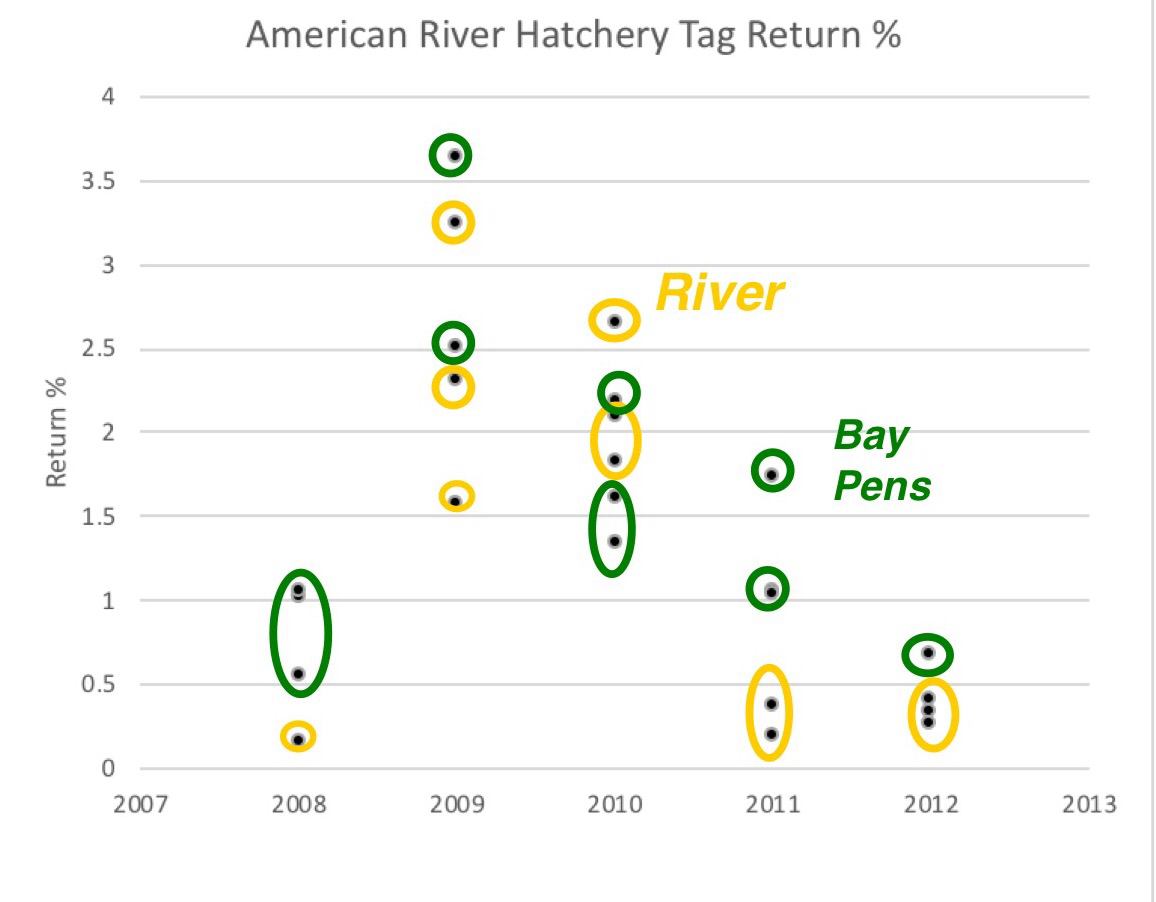
The proposed “Twin-Tunnels Project” (aka “WaterFix”) would divert enormous quantities of water1 from the Sacramento River to the south Delta for export into the San Joaquin River basin and southern California. If the project is built as presently planned, it will likely be a disaster for salmon for reasons described in this series. Water entering the two gargantuan tunnels would be pulled through three colossal water intakes2 directly on the banks of the Sacramento River, a short distance downstream from the City of Sacramento. Except when the Yolo Bypass is flooding, all four runs3 of Chinook salmon in the entire watershed would be forced to migrate past these enormous diversions. Three extremely long flat-plate fish screens would be positioned in front of each huge water diversion intake (Figure 1). The size of these screen structures will be massive, greatly exceeding the size of existing fish protective facilities in California. The combined length of the three screens will extend nearly 3/4th of a mile! The concept has never been tested elsewhere, possess numerous harmful obstacles for fish, and will likely kill large numbers of salmon. There is a high probability the structures will be catastrophic for salmon and severely undermine progress for salmon restoration in upstream areas. This series provides some highlights into the scientific basis to support that premise.

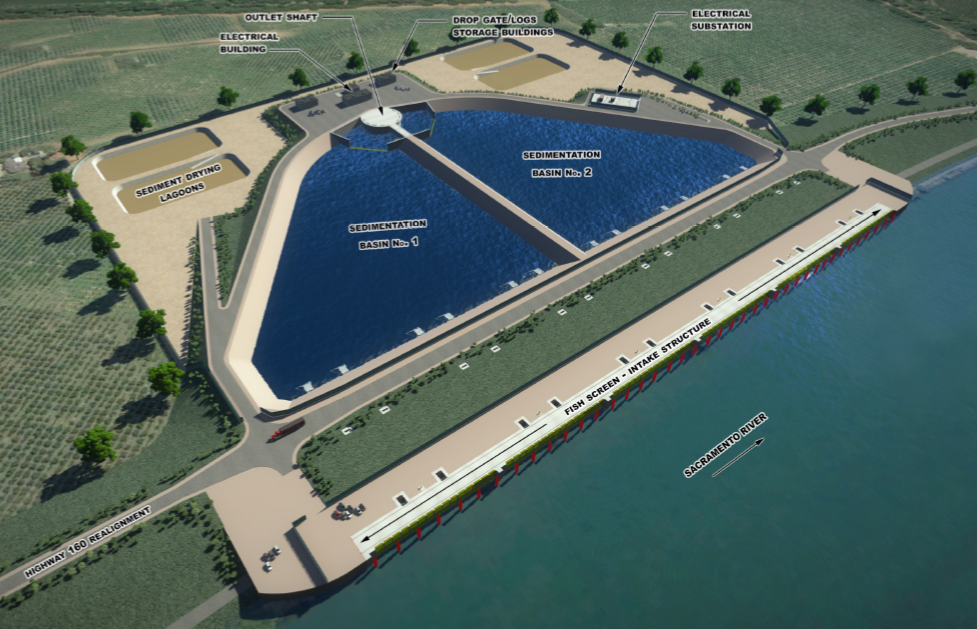
Figure 1. Conceptual rendering of one of the three on-bank intake facilities on the Sacramento River for the Twin-Tunnels project (Figure 3-19a from the 2016 Final EIR/EIS).

Location, Location, Location

Just like the old adage with real estate, fish screens must be located in good locations. Based on my 35+ years experience in the evaluation and bio-engineering of fish screens, in terms of hydraulic, physical, and biological conditions for fish protection, the proposed water intakes for the Twin-Tunnels are sited in some of the worst locations. Over a period of years, the Twin-Tunnels proponents presented the state and federal fish agencies with multiple hypothetical intake locations. It is evident that the agency representatives had no choice but to play with the losing hand dealt to them and recommended only general criteria that were severely constrained by the intakes sites. All of the options put forth were crappy … really crappy… for fish protection. It is obvious to me that the sites ultimately designated for the Twin-Tunnels project were not chosen because those locations would provide good fish protection but, instead, viewed as more favorable (but still bad) among the worst locations made available.

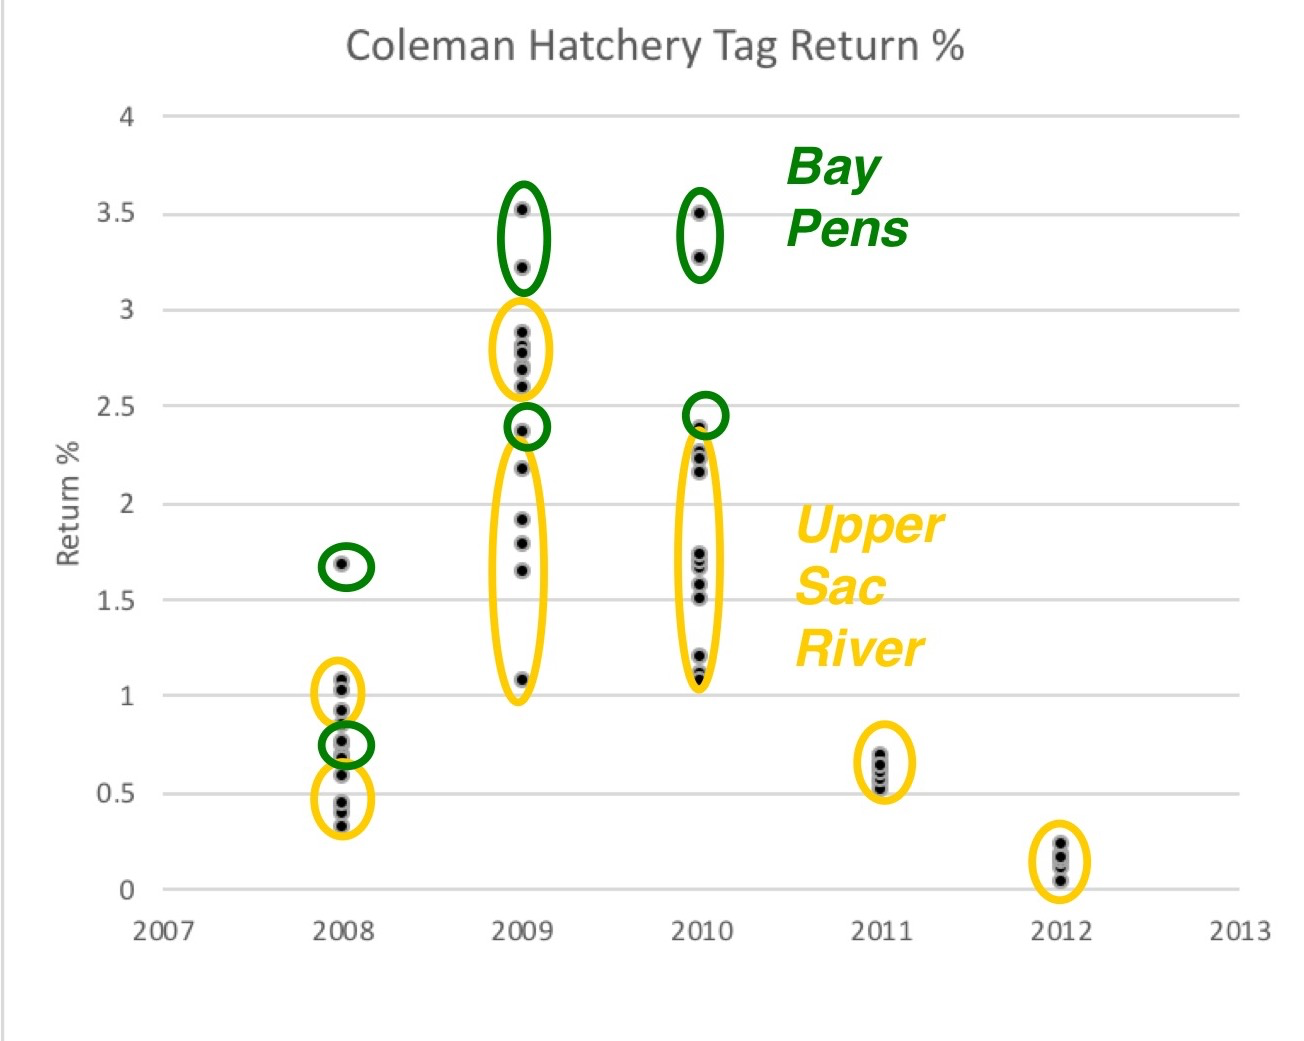
Because of the bad locations, the Twin-Tunnels’ screens will not have good “sweeping” flows to get the salmon out of the danger zone at the screens. Modern-day fish screens possess several features to help overcome the sweeping flow predicament for the Twin-Tunnels project. Sweeping flow complications can be partially alleviated by locating the screens on the outside bends of the river channel. An existing example of large Sacramento River flat-plate screen location demonstrates how that measure has been successfully implemented (Figure 2).

Figure 2. Aerial photograph showing an existing Sacramento River flat-plate fish screen located on an outside river bend to maintain high sweeping velocities. Water velocities passing the screen typically range between 2 to 4 feet/second.

In sharp contrast to such a real-world example, the three WaterFix intakes would be positioned in only very slight (or “gentle”4) river bends or relatively straight sections of the river channel (e.g. Figure 3) and, in all cases, undesirable lower gradient reaches of the river. Additionally, the Twin-Tunnels diversion intakes will be located in areas subject to tidal influence, further exacerbating the problems of ensuring protective sweeping flows. When the tide comes in twice a day, sweeping flows are reduced to the detriment of salmon.

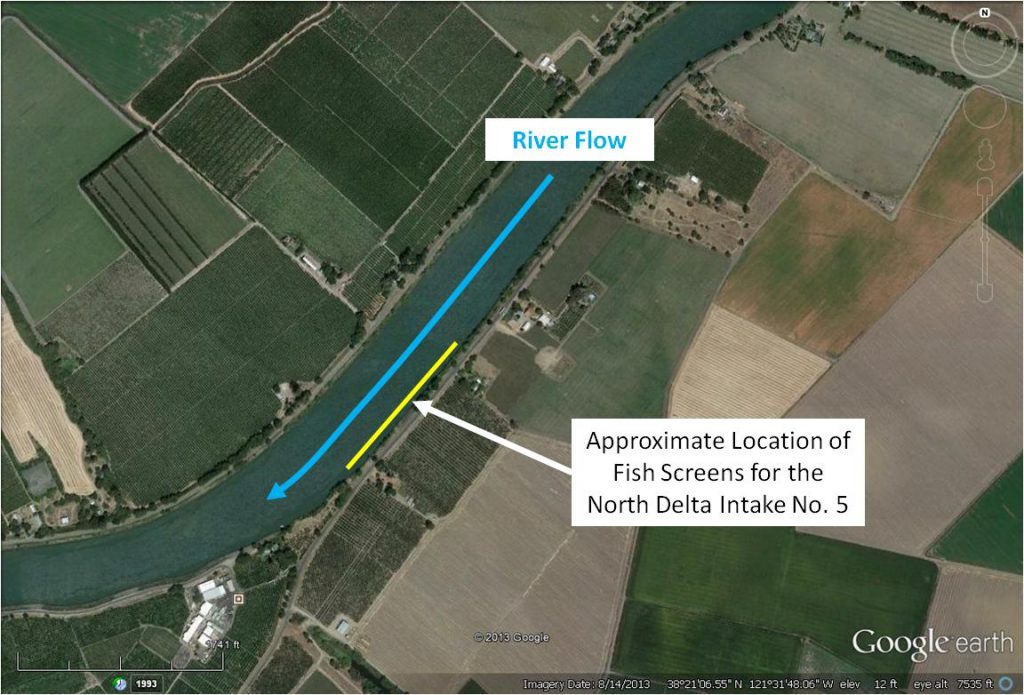
Figure 3. Aerial photograph showing the approximate location of the proposed WaterFix downstream-most intake (termed “North Delta Intake No. 5”).

In summary, the Twin-Tunnels’ diversion sites will not provide the near-screen sweeping velocities necessary to protect downstream-migrating salmon. The noteworthy point is that past experience has clearly demonstrated that maintaining high sweeping velocities in front of large riverine flat-plate fish screens requires at least one of following to take place:

  1. Alter river channel geometry and create channel constrictions to control the hydraulic conditions at the fish screens.
  2. Position the fish screens on the outside sharp (not “gentle”) bend of the river channel where high water velocities are naturally present (e.g., Figure 2).
  3. Angle the fish screen out into the river channel in a downstream direction or jut the entire structure out into the channel in deeper, swifter water to maintain sweeping flows.

Unfortunately, the Twin-Tunnels’ intakes do not possess any of those conditions — period. Even the recently-issued National Marine Fisheries Service’s Biological Opinion on the Twin-Tunnels Project admitted that there is “a high degree of uncertainty” if the fish screens can be built to meet fish protection criteria because of the immense nature of the proposed screens.

Next in the series: How to squish baby salmon on a fish screen.

  1. 9,000 cubic feet per second (cfs).
  2. 3,000 cfs each.
  3. Fall run, late-fall run, endangered winter-run, and threatened spring-run.
  4. Adjective used in the original Twin-Tunnels EIR/EIS documents

Enhancing Coleman Hatchery Salmon Contribution

In a recent post I discussed ways to improve hatchery salmon smolt survival to increase coastal and river salmon populations devastated by recent droughts. This post is a follow-up addressing how to enhance the Coleman (Battle Creek) Hatchery1 contribution. Coleman produces nearly half of the Central Valley’s 30 million hatchery-produced salmon smolts. Three state hatcheries in the Valley (Feather, American, and Mokelumne) produce most of the other smolts. Survival of Coleman hatchery smolts released to the Sacramento River is markedly lower in dry years.2 Trucking smolts from the hatchery to the Bay increases survival and catch in fisheries, but at a cost of increased straying and low return rates of adults to the hatchery.

Of all these hatcheries, Coleman has the toughest challenge, because it is nearly 300 miles from the Golden Gate. While trucking smolts to the San Francisco Bay improves smolt survival and adult salmon population numbers available to fisheries, trucking from Coleman leads to low hatchery-return rates and excessive straying to other Valley rivers. Only about 50-100 adults per million smolts trucked to the Bay find their back to Coleman. In contrast, for each million smolts released at the hatchery, 400-500 return to Coleman to contribute eggs for the next generation.

One measure to increase smolt survival-contribution I suggested in past posts is barging smolts to the Golden Gate. Unlike trucking, barging allows some imprinting by smolts for their eventual return route back to the hatchery. Barging requires a medium to large sized vessel, which would still necessitate nearly 200 miles of trucking to barge-accessible locations on the lower Sacramento River. Barging may reduce straying while providing enhanced smolt survival to the Bay, although past trucking and release at Knights Landing in the lower river only marginally lowered the straying rate compared to Bay releases. A balance between overall survival and contribution to the fishery and returns to the hatchery is the challenge for fisheries managers. Barging from Knights Landing or Elkhorn boat ramps may provide more returns to the Sacramento River above the mouths of the Feather and American rivers than trucking releases to these locations or the Bay. Regardless, barging should provide substantially higher survival and returns to the upper river than river release of fish, especially in dry years. Barging test studies conducted by the Feather Hatchery program should be expanded to test potential benefits of Coleman salmon smolt barging.

Another measure that deserves testing is rearing Coleman fall-run fry off-site in Yolo Bypass rice fields. The higher survival and growth potential and earlier ocean entry of these smolts compared with smolts released at the hatchery, should increase the numbers of adult salmon available to the fisheries. Concerns include low returns to Coleman hatchery and straying of returning adults back to the Yolo Bypass. The State’s EcoRestore Program is planning fish passage improvement projects in the upper Bypass. Barging off-site-reared smolts to the Bay from nearby Knights Landing or Elkhorn boat ramp could potentially improve return rates to the hatchery and overall survival, especially in dry years

A third proven measure that is possibly more promising and readily implementable is improving downstream migration conditions for smolts released to the upper Sacramento River from the Coleman hatchery. Smolt survival and contribution to fisheries and adult returns to the hatchery are better when flow, turbidity, and water temperature conditions are good at the time of release and in the immediate weeks thereafter in the 200 miles downstream to the Bay. To a certain extent, the hatchery can time releases to river conditions (and does so when feasible). However, the timing of smolting and the whole rearing process necessitates a week 15-17 release window (late April to beginning of May). When conditions are optimal in these key weeks, survival and contribution rates of smolts released at Coleman are nearly as high as they are for smolts transported to the Bay. Such 1-3% survival (returns) would produce hundreds of thousands of adults, compared to just tens of thousands under poor conditions when there is just 0.2-0.5% survival (Table 1). A 3% survival would yield 360,000 adult salmon returns from 12 million hatchery smolts, as compared to only 12,000 returns under a 0.1% survival.

So what are good conditions in late April? Adequate stream flows are those necessary to meet existing water quality standards, water right permits requirements, and endangered species permit requirements in the upper 200 miles of river below Shasta Dam. Such prescriptions are basically minimum targets: keeping the upper river within the 56oF limit upstream of Red Bluff and the river downstream to the Delta at 68oF or less. These standards were put in place decades ago to protect beneficial uses, including salmon survival.

The problem is that these standards are both increasingly being ignored and violated, and are also proving inadequate in providing optimal smolt survival. Figure 1 shows that standards were violated at Red Bluff, even in 2017, a record water supply year. Figure 2 shows 2017 water temperatures at Wilkins Slough in the lower Sacramento River. Though water temperatures remained below 68oF (20oC) during the period shown, they reached above the 65oF (18oC) stress level for migrating juvenile salmon. Such high water temperatures place the smolts at much greater risk to predation.3 Even in this record water supply year, water was unnecessarily held in storage in Shasta Reservoir at the expense of Coleman and wild salmon smolt survival. When water contractor demands are low and Delta conditions are “in excess,” there is a tendency in all year types to maintain Shasta storage at the expense of lower river water temperature and Coleman smolt survival.

In addition to maintaining flows and water temperatures, a flow pulse through the lower river in the late April to early May period would likely improve survival. A flow pulse in drier years would provide higher transport rates, higher turbidity, and lower water temperatures, conditions that often occur in wetter, high survival years. A one week pulse that raised flows from the “dry” year 5000 cfs flow level to a 10,000 cfs level would use approximately 10,000 acre-ft per day, or about 70,000 acre-ft for a week. At Shasta Reservoir’s current storage level in excess of 4 million acre-ft, the water needed for a one week flow pulse would be less than 2% of the total storage for the year. Even for a multiyear drought year like 2015, the amount needed would be only 3 to 4% of total annual storage. While drought year pulses would need to be weighed against losses to the Shasta coldwater pool, a 1% improvement in dry-year survival would add 120,000 adult salmon from the 12 million smolts produced by the Colman hatchery. For a dry year or drought year sequence, the increase could be over 100% over current survival rates, and could allow a salmon fishing season when there might otherwise be none.

In summary, the salmon fishery collapses that occurred as a consequence of the 2007-2009 and 2012-2015 droughts could have been at least partially alleviated by improving survival of smolts produced at the Coleman hatchery. Compliance with spring water temperature standards in the lower Sacramento River would help greatly. When water supplies are adequate, spring flow pulses should be considered. Barging Coleman smolts to the Bay and off-site rearing in lower river floodplain habitats are additional measures to test in order to increase Coleman hatchery smolt survival and contributions to ocean and river fisheries.

Table 1. Survival (return) rates of Coleman hatchery fall run Chinook salmon release groups for a range of year types.

Source of survival data: http://www.rmpc.org.

Water Year Week 15-17 Conditions Smolt Survival4
1997 Wet Year Lower River conditions were deteriorating in April with flows falling from 7000 to 5000 cfs and water temperatures rising from 59oF (15oC) to 65oF (18oC). Week 15 – 0.8%
Week 16 – 0.3%
Week 17 – 0.2%
1998 Wet Year Lower River conditions were near optimal with 18,000 cfs flow and water temperature of 15oC. Week 17 – 0.9%
2002 Dry Year Lower River conditions degraded gradually from week 15 to week 17).  Flows in lower river fell from near 10,000 cfs to less than 5000 cfs during April.  Though water temperatures remained below 68oF (20 o C) during the period, they often reached above the 65oF (18 oC) stressful level for migrating juvenile salmon. Week 16 – 0.8%
Week 17 – 0.6%
2007 Critical Dry Year Lower River conditions were poor in weeks 16-17 with flows of 4000-5000 cfs and water temperatures of 19-21oC. Week 16 – 0.01%5
2008 Critical Dry Year Lower River conditions were poor with flows of 5000 cfs and water temperatures 16oC to 18oC in weeks 16-17, but reaching 20-22oC in week 18. Week 16 – 0.1%
Week 17 – 0.1%
2009 Critical Dry Year Lower River flow decreased from 7000 cfs to 5000 cfs in weeks 15-16, while water temperature rose from 15oC to 20oC.  Flow pulsed to 10,000 cfs in week 17 dropping water temperature to 15oC. Week 15 – 0.5%
Week 16 – 0.9%
2011 Wet Year Lower river flows in April were dropping sharply from 16,000 to 8,000 cfs, with water temperature rising from 15oC to 18oC. Week 15 – 2.2%
Week 16 – 1.5%
Week 17 – 1.2%

Figure 1. May 2017 flow and water temperature conditions in upper Sacramento River. Source: CDEC.

Figure 2. May 2017 water temperature in lower Sacramento River at Wilkins Slough. Source: CDEC.

  1. The Coleman Hatchery near Redding on Battle Creek is operated by the US Fish and Wildlife Service. The hatchery operates under the Central Valley Project as mitigation for Shasta Dam on the upper Sacramento River
  2. http://calsport.org/fisheriesblog/?p=1703
  3. http://calsport.org/fisheriesblog/?p=878
  4. Survival rate is defined as percent of smolts that were subsequently collected as adults in fisheries, spawning surveys, and at Central Valley hatcheries. Average rate of multiple groups is shown.
  5. Poor ocean conditions in 2007-2009 likely contributed to poor survival.

Are Hot Rivers in Summer the New Norm?

The much anticipated salmon season opener on the Sacramento River will be a bust, just as it was last year.

USA Fishing reports on July 15, 2017: “The Central Valley rivers open to salmon fishing on Sunday July 16th. The good news is that reservoirs are full and we have cold water and much higher releases than we have seen (for the opener) in years.”

The sad news is that despite record inflow to reservoirs, the “new norm” in the lower Sacramento River is low water, high water temperatures, and no salmon during summer. This “new norm” is a consequence of the fact that federal and state regulators have changed the rules as they are applied on the ground, with little or no public input. Federal EPA and State water quality standards are no longer being enforced. The summer 68oF limit for the lower Sacramento River between Red Bluff and the Delta no longer applies. The “new norm” is 72-75oF (22-24oC), as is evident in Figures 1 and 2, below. This new norm is in direct contrast to 2006 and 2011, the last two wet years (Figures 3 and 4). The apparent reason is an absolute prioritization of using Shasta Reservoir storage for water contractors and winter-run salmon. Fall-run salmon, the backbone of ocean and river salmon fishing alike, no longer rate protection. Shasta Reservoir is just about full, but the Bureau of Reclamation is using none of the water stored there to maintain water temperatures in 200 miles of the lower Sacramento River.

Why are flows and water temperatures important in the lower 200 miles of the Sacramento River? In spring, millions of upper river hatchery and wild salmon and steelhead smolts pass through the lower river on their way to the ocean. Also in spring, white and green sturgeon spawn and rear in the lower river. Adult winter-run and spring-run salmon also pass upstream through the lower river during the spring on their way to upper river and tributary spawning grounds. In summer, adult fall-run salmon begin their upstream run in July, with a peak in August-September. The lower river is home to rearing juvenile salmon, steelhead, and sturgeon all summer; high water temperatures and low flows are detrimental to their survival and favorable to predators. High water temperatures and low flows in the river also increase the likelihood of higher water temperatures and lower flows through the Delta to the Bay, leading to poorer survival of longfin smelt, Delta smelt, and other native Delta fishes.

Figure 1. Water temperature (daily high and low) and flow at Wilkins Slough of lower Sacramento River, June-July 2017. Source for all figures: https://waterdata.usgs.gov/nwis/

Figure 2. Water temperature (daily high and low) and flow at Verona of lower Sacramento River, June-July 2017.

Figure 3. Water temperature (daily high, median, and low) and flow at Wilkins Slough of lower Sacramento River, June-July 2011.

Figure 4. Water temperature (daily high and low) and flow at Wilkins Slough of lower Sacramento River, June-July 2006.

Splittail Status end-of-June 2017

Last time I posted on splittail, it appeared that the species remained relatively abundant (though declining) in its core population centers in the Bay. I was concerned about population recruitment during the 2012-2015 drought and whether there were sufficient adults remaining to bring about a strong brood year in wet year 2017. The traditional summer and fall surveys will be the best indicator of success. At the end of spring, the best interim indicator is splittail salvage at south Delta SWP and CVP export facilities. In wet years, south Delta export salvage likely best reflects San Joaquin River splittail production.

I compare salvage in 2011 with 2017 in Figures 1 and 2 for the SWP and CVP, respectively. These were the only wet years since 2006. Wet years provide good spawning and rearing conditions for splittail. These conditions often create strong year classes of juvenile and adult splittail as shown in summer and fall fish surveys in the Delta and the Bay.

Though the density of juvenile splittail in salvage is lower in 2017 than 2011, winter and early spring flows were higher in 2017, which could have led to broader dispersal. Very high late winter and early spring flows in the lower Sacramento River system including the Yolo Bypass may have transported north-of-Delta splittail production directly to the Bay, bypassing the south Delta and its export facilities. Spring flows in the two years were similar in magnitude when young splittail traditionally move downstream through the Delta toward the Bay. It remains to be seen whether the difference in salvage plays out as a discrepancy in recruitment in the Bay populations. Local spawning recruitment in the Napa and Petaluma rivers and in Suisun Bay/Marsh could be strong in years like 2017 and could make up for lower recruitment from the Sacramento and San Joaquin river valleys. The primary concern is long term trends in the core adult population centers in the Bay that for now remain strong.

Splittail Salvage at SWP Byron Facility

Figure 1. Splittail salvage density (number per 10,000 cubic meters exported) at State Water Project Delta export facility in May and June 2011 and 2017.

Splittail Salvage at CVP Tracy Facility

Figure 2. Splittail salvage density (number per 10,000 cubic meters exported) at Central Valley Project Delta export facility in May and June 2011 and 2017.

Improving Hatchery Salmon Survival

One way to effectively increase the California coastal salmon population is to increase survival of Chinook salmon smolts released by the three large Sacramento Valley hatcheries. These three hatcheries produce nearly 30 million fall-run smolts a year and account for 70-90% of California’s ocean and river fishery catch. A one percent smolt survival leads to 300,000 adult returns to the fisheries and escapement to spawning rivers. Doubling survival to two percent would increase returns to 600,000 adults. With survival at or below one-half percent in recent drought years, returns have fallen to near 100,000.1

How can we get survival back to one or even two percent or higher? Fortunately at least a quarter of the smolts are tagged to allow estimates of their survival and contributions to fisheries and escapement back to spawning rivers. Survival estimates are now available for hatchery smolts released up to 2013. Figures 1-3 show a summary of survival from the three largest hatcheries for salmon brood years 2008-2012 (smolt releases from 2009-2013). I drew the following conclusions from the figures:

  1. Releasing smolts in the spring of drought years in the rivers near the hatcheries provides only about a half percent survival in drought years (release years 2009 and 2013). Survival improves to 1-3 % in wetter years (release years 2010 and 2011), likely a consequence of better transport flows, lower water temperatures, and lower predation because of higher turbidity.
  2. Poor ocean survival (2008-2009, and 2014-2015) likely contributes to poor survival (percent returns) for those brood years rearing in the ocean under poor conditions.
  3. Transporting the salmon smolts via truck to San Francisco Bay for release into acclimation pens markedly increases survival in dry and wetter years into the 1-3% range. The benefit appears smaller in the wetter years, but remains significant and substantial. The Feather and American state hatcheries continue transporting the bulk of their smolts in recent years, while the federal Coleman hatchery has greatly reduced the practice because of apparent higher straying rates.
  4. The program of releasing Feather smolts to coastal bay pens sharply increases returns to coastal fisheries. However, the threat of these fish straying to coastal streams with different genetic stocks now limits this practice.
  5. Lastly, barging fish from near their hatcheries to the Bay shows much promise. Barging may triple survival in drier years when survival is one percent or less, and may reduce straying. A multiyear study of barging is currently underway.

In conclusion, adult salmon stocks in coastal waters continue to benefit from transporting smolts to Bay net pens. Further benefits may derive from barging the smolts 100 to 200 miles to the Bay. Potential benefits of barging over trucking include higher survival and reduced straying. Release of hatchery smolts directly to Sacramento Valley rivers near the hatcheries provides minimal survival especially in drier years. Increasing survival factors like augmenting flow releases from reservoirs at the time of river hatchery releases may improve survival, but trucking and barging appear necessary to keep ocean and river fisheries afloat in the short term.

Figure 1. Feather River hatchery fall-run salmon return rates by release method for brood years 2008-2012 (release years 2009-2013). Source of data: http://www.rmpc.org/

Figure 2. American River hatchery fall-run salmon return rates by release method for brood years 2008-2012 (release years 2009-2013). Source of data: http://www.rmpc.org/

Figure 3. Sacramento River (Coleman) hatchery fall-run salmon return rates by release method for brood years 2008-2012 (release years 2009-2013). Source of data: http://www.rmpc.org/