Stanislaus River Salmon in 2020

The San Joaquin River watershed has contributed up to a third of the total Central Valley salmon run as recently as 2017, if one counts the Mokelumne River as a San Joaquin River tributary and includes its large hatchery contribution. Though the fall salmon run in the Stanislaus River includes many hatchery strays from throughout the Central Valley, the Stanislaus remains the biggest contributor of wild-produced salmon in the San Joaquin basin (Figure 1).

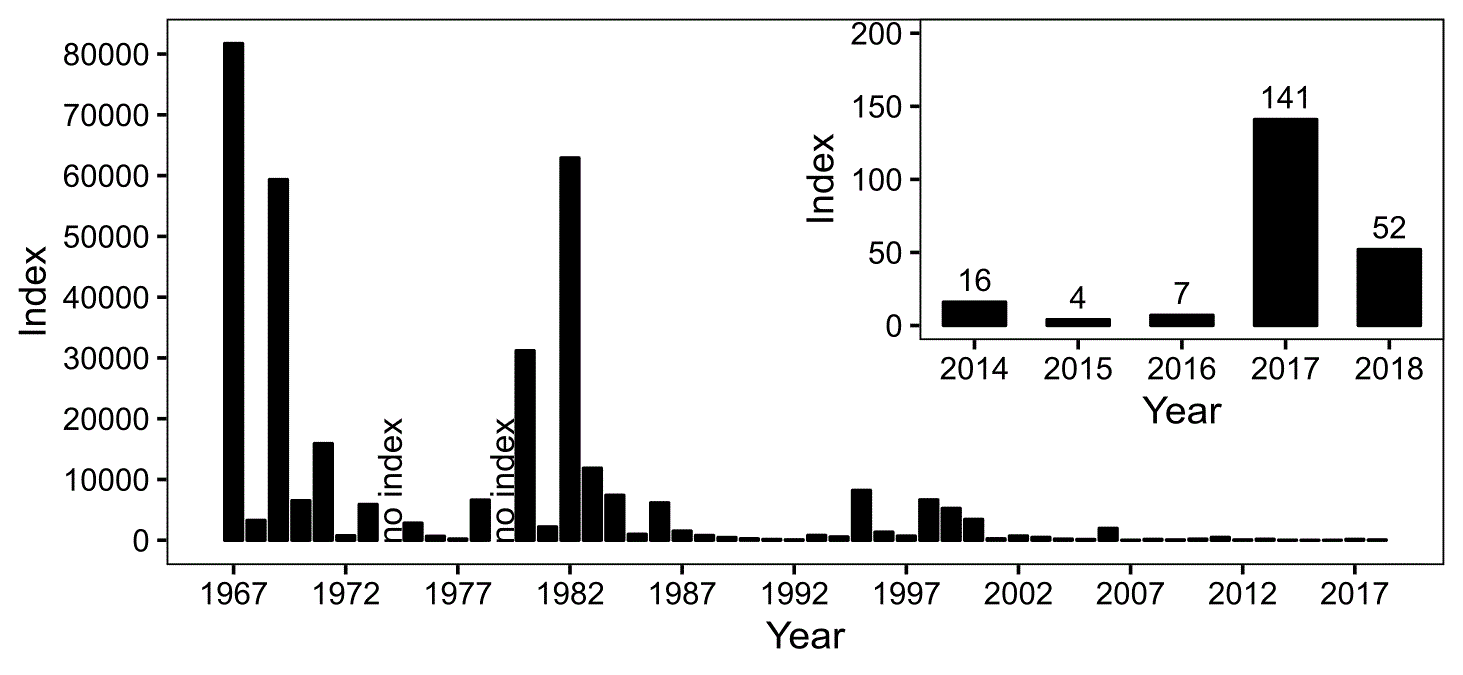
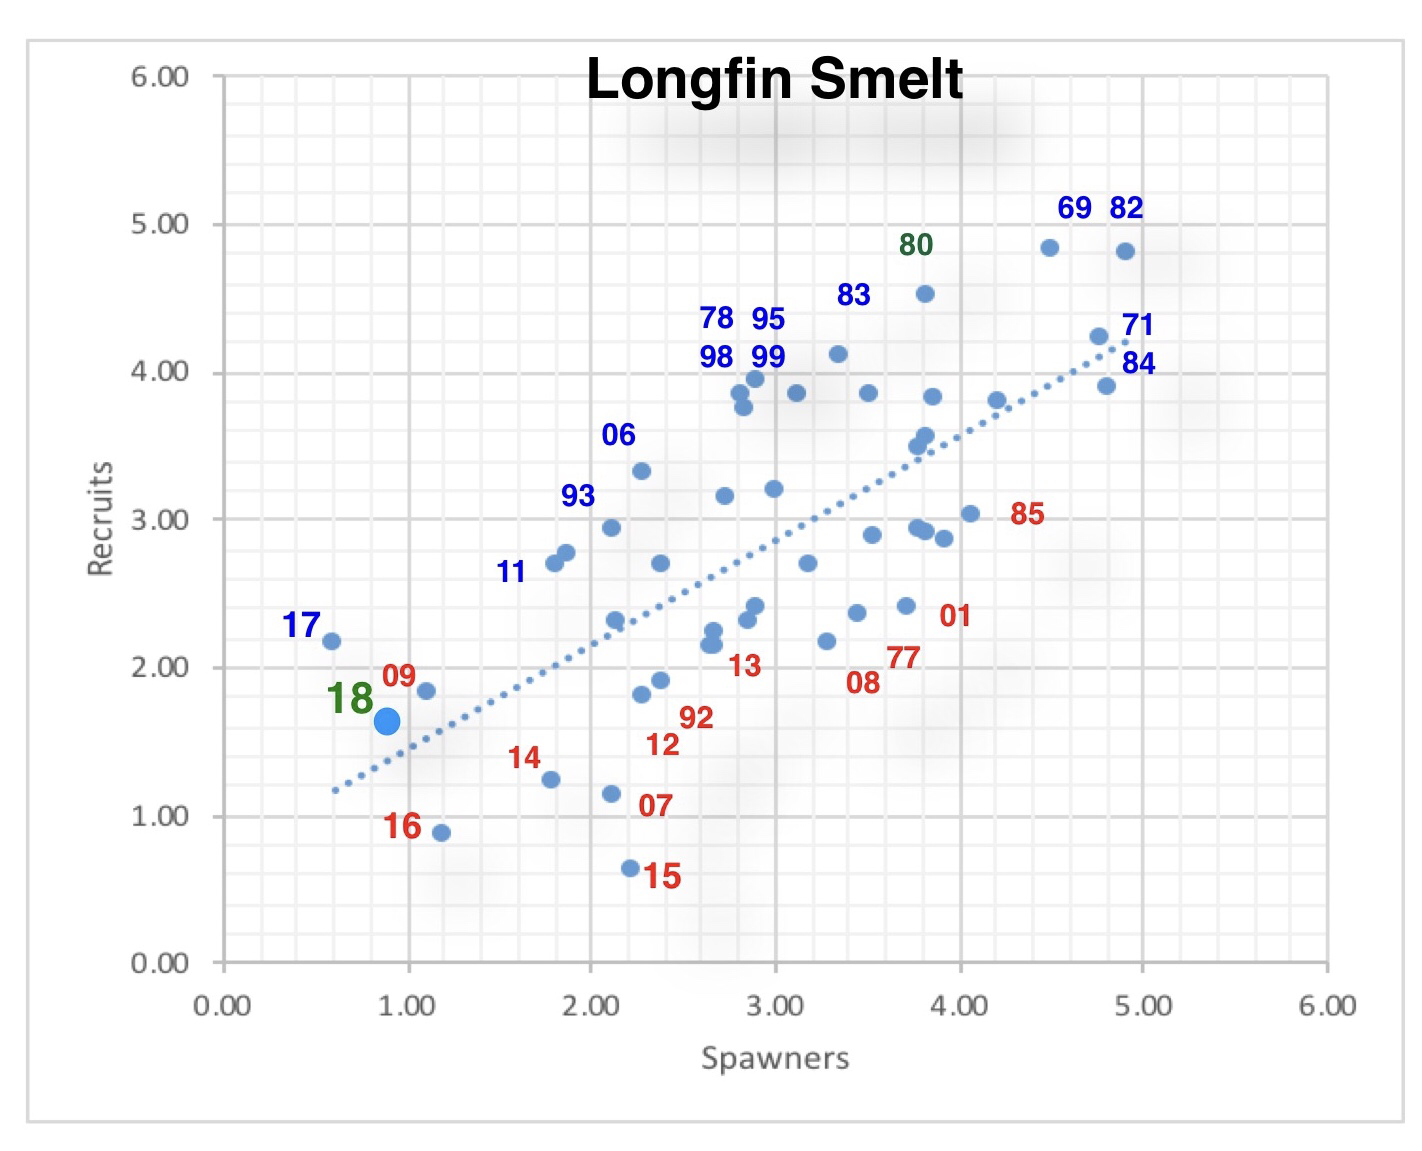
The Stanislaus spawner-recruit relationship (Figure 2) derived from escapement estimates indicates a positive relationship influenced by water-year type. Wetter years (blue) on average provide 10 times the recruitment per spawner as drier years, with normal years providing intermediate recruitment. Severe droughts in the 60’s, 70’s, 80’s, 90’s, and 00’s depressed recruitment and led to declining population trends. Recruitment during 2014-2018 drought-influenced period was much higher than in the prior droughts, thus maintaining a higher recent average population level. In a December 2019 post, I attributed the improvement to increases in hatchery strays as well as to spring and fall pulsed flows from prescribed reservoir releases (Figure 3). The spring flow pulses benefit smolt emigration survival. Fall flow pulses provide attraction flows as well as better spawning conditions (flows and water temperature).

Separating all the factors influencing recruitment is a challenge, but it is critical to prescribing future management. In a recent paper, Sturrock et al. 2019 found that emigrants-per-spawner and recruits-per-spawner through 2014 strongly related to within‐season stream flow variability during the winter-spring juvenile rearing period.

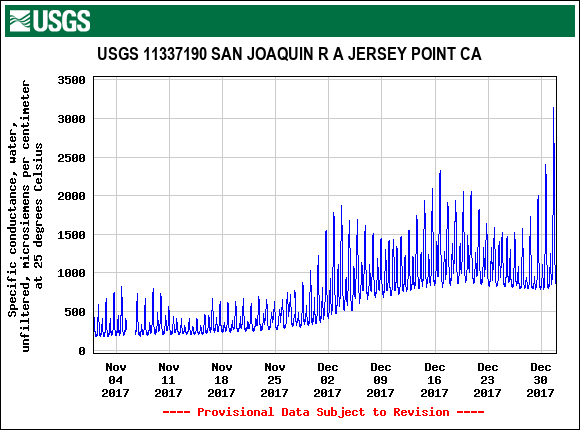
Variability in flow comes from storms, prescribed flow releases, and flood releases.1 Strong runs in drought-influenced 2015 and 2016 were likely higher due to the significant prescribed spring flow pulses in 2013 and 2014 (Figure 3). The strong run in 2017, despite overall poor drought-year 2015 flows (Figure 3), is likely related to the attraction of stray wild and hatchery spawners to late summer and fall prescribed pulsed flows and associated cool waters of the Stanislaus River in 2017 (Figure 4). Most of the 2015 Central Valley hatchery smolt production was trucked to the Bay and subject to high straying rates. The lower San Joaquin and Stanislaus rivers provided good attraction flows and cooler waters in 2017 to accommodate adult Central Valley salmon less inclined to seek their natal streams in routes warmer than the San Joaquin and Stanislaus rivers.

Based on studies of salmon in the Stanislaus, Sturrock et al. (2019) provide recommendations to improve recruitment per spawner and diversity of the life-history portfolio. In recent years, recruitment in the Stanislaus has been overly dependent on the success of parr and smolts emigrating in the early spring. Survival of emigrating fry in winter and older smolts in late spring has been poor. Analyses of otolith cross-sections (ear bones) of returning adults indicated a dominance of the early spring parr-smolt life-history pattern. Quotes below in italics are from Sturrock et al.

  1. Fry emigration success has suffered from reduced winter flow peaks (In years lacking winter pulse flows, salmon tended to emigrate later, larger, and in lower numbers… predicted fry expression was 62% lower following major dam construction… Even marginal improvements to fry survival rates could significantly boost adult recruitment rates.” Winter flow pulses would increase the contribution of fry emigrants to recruitment.

  2. Parr and smolt emigration success benefitted from CVPIA/VAMP Apr-May prescribed storage releases and reduced south Delta exports. “Peak parr emigration in April coincided with managed releases intended to improve downstream survival.” Continue these early spring prescriptions.

  3. Late spring smolt emigration survival has been very low due warm water temperatures and low flows. Late spring pulse flow prescriptions would increase the contribution of older smolt emigrants to recruitment.

  4. “[S]trong suppression of any life‐history diversity—whether evolved or plastic— could have serious demographic and evolutionary consequences… negative population growth in the absence of demographic rescue by hatchery strays.” Without flow pulses in winter, early spring and late spring, the population is at risk of significant decline and loss of genetic integrity. Hatchery strays will further dominate the population and production of wild fish will decline.

Other measures suggested by Sturrock et al. (2019) included:

  • Increasing fry floodplain habitat downstream of the Stanislaus to increase fry emigrant success and the contribution of the fry emigration component of the life history portfolio to adult recruitment. “Given the substantial numbers of fry often produced, even marginal increases in their survival rates would have significant impacts on recruitment.”

  • Increasing the portfolio diversity for other Central Valley salmon populations will reduce the overall risks to Central Valley fall run salmon because “[a]djacent watersheds often experience similar climates and manage their dams for similar goals, which could homogenize emigration timings among nearby populations. Shared bottlenecks such as the Sacramento‐San Joaquin Delta could further compress emigration timings, increasing the risk of match‐mismatch events in the ocean.”

In conclusion, the Stanislaus River fall-run salmon population dynamics provide important lessons for sustaining wild salmon in the Central Valley. Sustaining life history diversity will increase salmon recruitment per spawner. It will also reduce risks of population declines and loss of genetic integrity in the wild component of salmon populations.

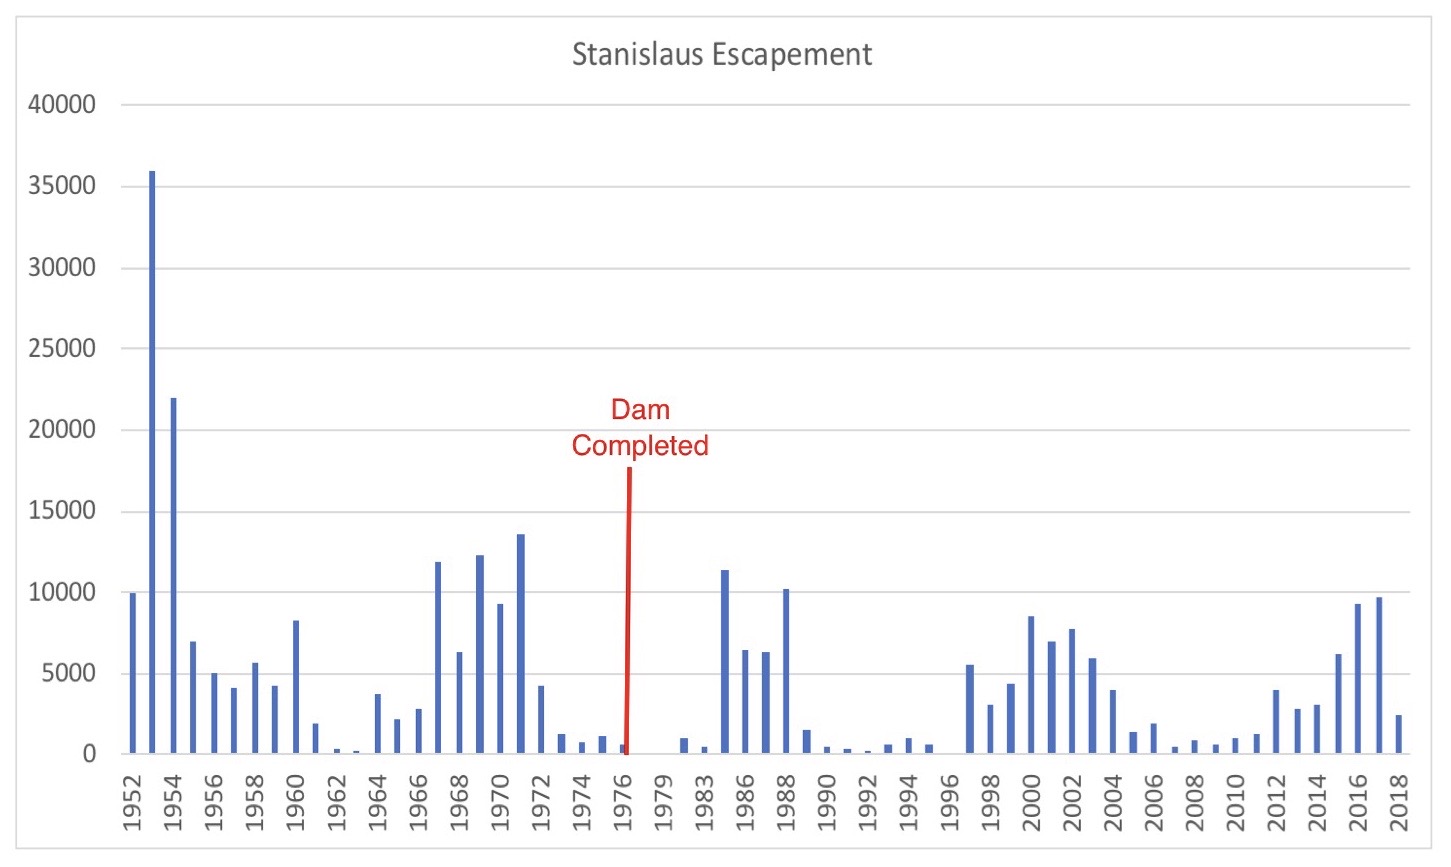
Figure 1. Stanislaus River fall-run Chinook salmon run (adult escapement) estimates 1952-2018. Note completion date for New Melones Dam in red. Data source: CDFW.

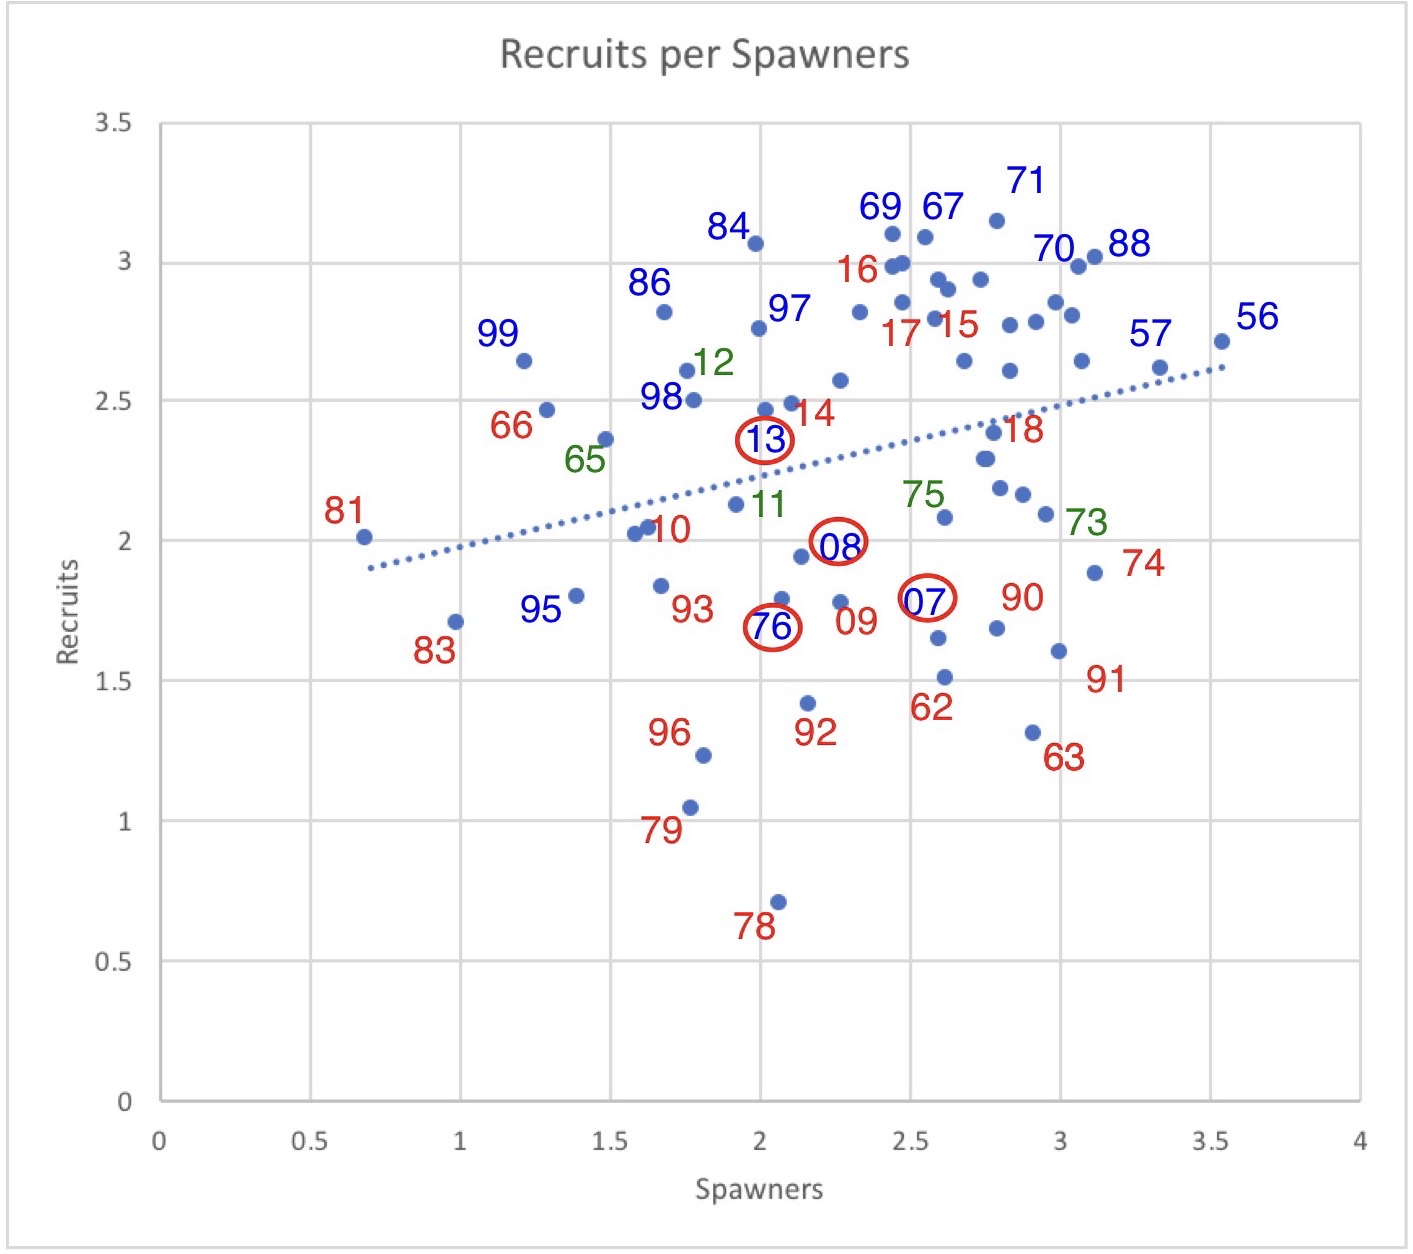
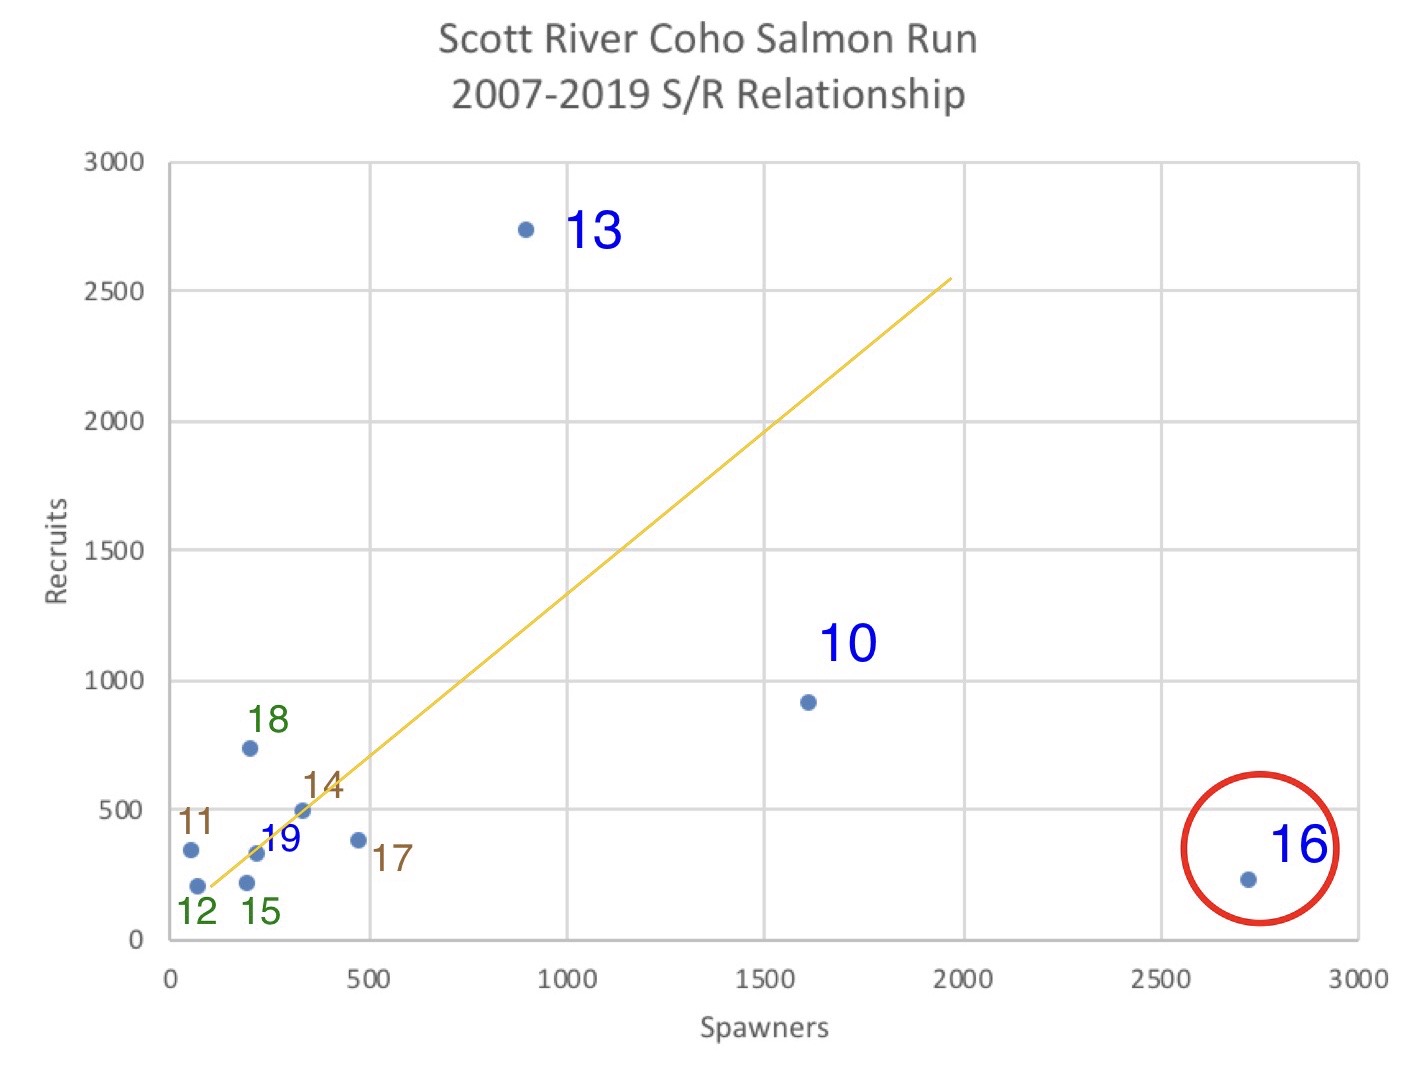
Figure 2. Spawner-Recruit relationship for fall-run Chinook for the Stanislaus River. Number represents recruit year (escapement for that year). Color represents water year type for San Joaquin basin during brood year rearing (two years prior). Blue is wet year. Red is dry-critical year. Green is normal year. Red circle is for poor ocean rearing conditions and/or poor river flows during spawning run. For example: year 08 represents 2008 recruitment (escapement) from 2005 spawners (both log10 -1 transformed); blue represents wet year 2006 during river rearing; red circle represents poor ocean rearing and poor river flows during 08 spawning run.

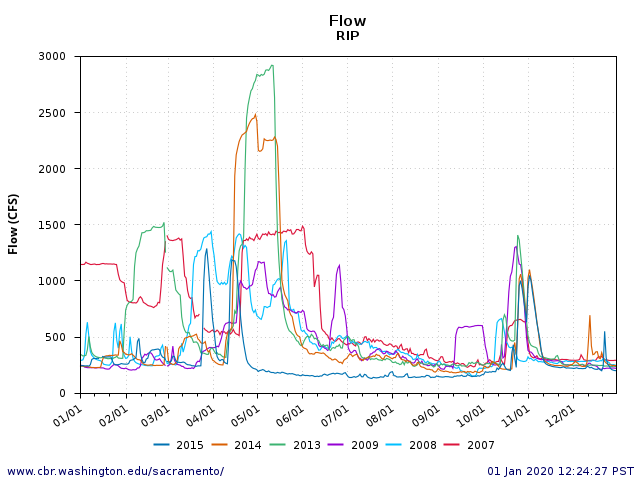
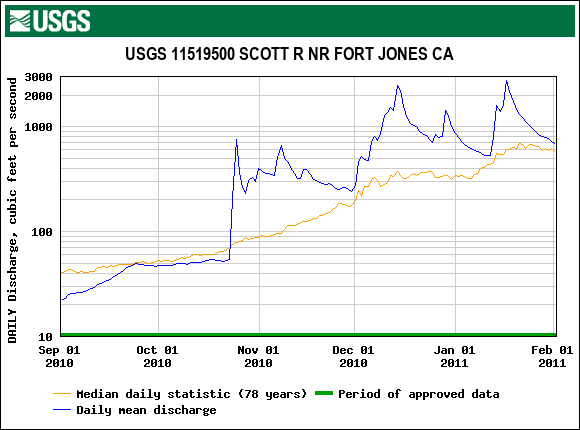
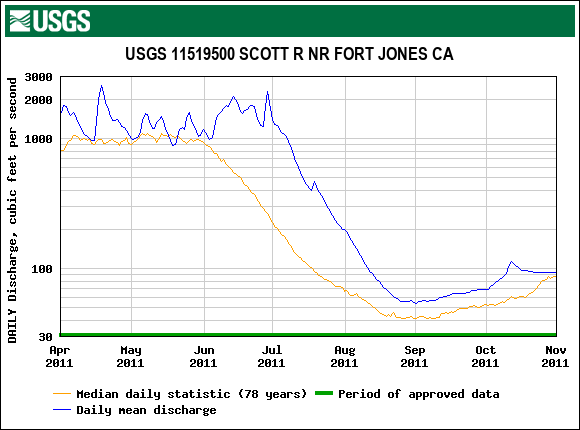
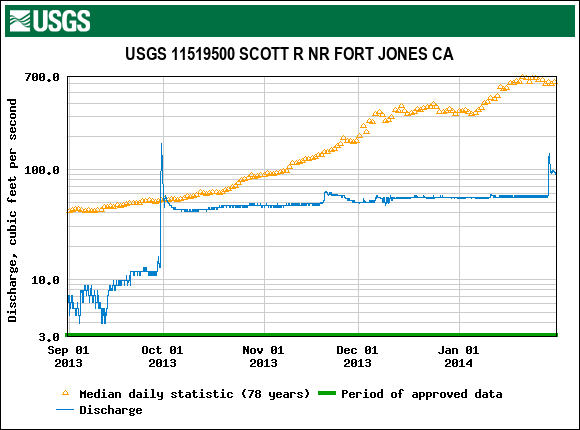
Figure 3. Stream flow in the lower Stanislaus River near Ripon in 2007-09 and 2013-15 drought years. Note prescribed reservoir releases in April-May 2013 and 2014 and October of most years.

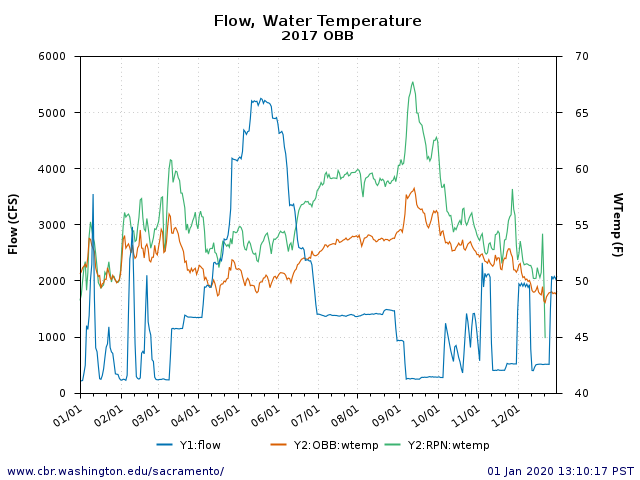
Figure 4. Stream flow and water temperature in the lower Stanislaus River at Ripon and Orange Blossom Bridge in wet year 2017. Note water temperatures below 60oF are optimal for fall spawning. The strong spring flow pulse should lead to good 2019 adult recruitment.

  1. Flood releases are rare in the Stanislaus watershed, where storage capacity is twice annual average runoff.

Predators versus River Flow

I keep emphasizing the need for fall flows to get Central Valley salmon fry, fingerling, sub-yearling smolts, and yearling smolts to and through the Delta to the Bay. This especially applies to wild spring-run and to wild and hatchery winter-run and late-fall run, the Chinook salmon runs most in danger of extinction. Extinction comes from population decline and loss of genetic diversity from lower river flows and fragmented habitat. 1

The reason river flow is important is that flow affects habitat, growth, migration, and predation of emigrating salmon.

The long, slow reservoirs behind the mainstem dams on the Columbia River studied by Conner and Tiffan (2012)2 have habitat similar to the long, slow reaches of the lower Sacramento and San Joaquin rivers in the Central Valley. Furthermore, the Delta with its tides acts as a “main-stem” dam, slowing the outward movement of water through the Delta and salmon exiting to San Francisco Bay. The Delta has also been described as the place “where predators meet prey” – where the effectiveness of predation and the role played by “Anthropogenic Contact Points” is accentuated by modified freshwater flows.

The Sacramento River channel at Walnut Grove is one of the key “anthropogenic” contact points in the Delta. The major outlets from the Sacramento River channel to the central Delta, the Delta Cross Channel and Georgiana Slough, are located here (Figure 1). Lehman et al. (2019)3 describe the predator contact points at this location in Figure 1, including submerged aquatic vegetation, rip-rapped levees, docks, and diversions. The role of these particular contact points in predation on juvenile salmon is no doubt significant.

Lehman et al. point out the difficulty in removing the predators and the problematic contact infrastructure. However, they don’t address the role river flow and associated hydrodynamics play in modifying the effects of predators or specific contact points.

In the fall during the peak of winter-run emigration, Walnut Grove is the place where the Sacramento River channel in the north Delta slows and is “diverted” into the abyss of the central Delta. Few salmon escape the central Delta’s many predators and its “anthropogenic contact points”, including the south Delta export pumping facilities. Under low Sacramento River fall inflows (around 12,000 daily average flow at Freeport), high tides cause most of the water and salmon coming down the Sacramento River to divert into the central Delta via the Delta Cross Channel (DCC) and Georgiana Slough (Figure 2). Those young salmon remaining in the Sacramento channel are then vulnerable to the contact points and predators under lower water velocities. If river inflows are higher and the DCC is closed, the risks to young salmon is greatly reduced (Figure 3).

In conclusion, the Lehman study funded by the Metropolitan Water District describes the role of predators and contact point infrastructure including submerged aquatic vegetation, docks, riprap, and diversions. However, the Lehman study does not address the key factors in the fall loss of juvenile fish in the Delta: lower flows and the diversion of water into the central Delta for export. Closing the Delta Cross Channel and increasing river flows are the prescriptions needed to cut losses of emigrating endangered Central Valley salmon. Cutting south Delta exports in the fall would also be beneficial.

Figure 1. Predation contact points near Walnut Grove in the north Delta. Source: From Lehman et al. 2019.

Figure 2. Measured streamflows at USGS gages near Walnut Grove on 12/1/2019 at 8:00 am high tide. The DCC was open and the Sacramento River at Freeport inflow to the Delta was 12,500 cfs.

Figure 3. Measured streamflows at USGS gages near Walnut Grove on 12/5/2019 at the noon high tide. The DCC was closed and the Freeport inflow to the Delta was 21,000 cfs.

  1. Sturrock et al. 2019. https://onlinelibrary.wiley.com/doi/10.1111/gcb.14896
  2. Connor, W. P., and K. F. Tiffan. 2012. Evidence for parr growth as a factor affecting parr-smolt-survival. Transactions of the American Fisheries Society 141:1207–1218, 2012.
  3. Lehman, B.M., et al. 2019. https://escholarship.org/uc/item/2dg499z4

Scott River Coho Salmon Run – Status Fall 2019

The Scott River Coho salmon population is one of the last remaining self-sustaining wild Coho salmon runs in California and in the Southern Oregon Northern California Coho (SONCC) Evolutionarily Significant Unit (ESU).  The SONCC ESU is listed as “threatened” under the federal and California endangered species acts.  The ESU includes the Rogue River in Oregon and the Klamath River in California.

The Scott Coho run is the major wild Coho population in the Klamath River system.  Scott Coho spawn and rear in Scott Valley, once called “Beaver Valley,” located near Fort Jones.  The run has numbered over 1,000 adult Coho spawners as recently as 2013, but numbered less than 100 as recently as the 2008-09 drought years (Figure 1).

Scott Coho include three distinct sub-populations that have developed because the vast majority of spawners are three years old.  One subgroup, the 2007-2010-2013 sub-group, dominated the population in the recent past, but declined sharply in 2016.  The other two sub-groups have increased slightly since 2008 and 2009 lows.

The spawner-recruit relationship (Figure 2) shows a generally positive relationship between the number of spawners and recruits three years later for each sub-group and the overall population with one distinct outlier (the sharply lower 2016 run).  So why was the 2013 run so high and the brood-year 2013 run in 2016 so poor?

1.      2013’s Good Run

The 2013 run (brood year 2010) got off to a great start in wet water year 2011.  Flows for the fall 2010 spawning run were good from November through January [Figure 3), which ensured spawner access and good spawning conditions throughout Scott Valley.  Flows were also good through the spring and fall of 2011 (Figure 4), ensuring good smolt production and a subsequent strong run in 2013.

2.      2016’s Poor Run

The strong run in 2013 spawned in brood year 2013, which got off to a rocky start in dry water year 2013-14.  Flows in fall-winter 2013-14 encountered by the strong 2013 run were very low through the early winter spawning season (Figure 5), leading to an unusually protracted run of adult spawners (Figure 6) and poor accessibility to good spawning areas.  Spawning habitat quality and quantity likely also suffered from low flows.  Flows were then very low from spring through fall of 2014 (Figure 7), likely resulting in poor over-summer survival and low smolt production for brood year 2013.

In conclusion, the Scott Coho salmon population continues to suffer from low seasonal streamflow, especially in drought years like water year 2013-14.  The population would benefit from improved summer-through-fall streamflows.  It will also benefit from the watershed habitat restoration actions being implemented by landowners, CalTrout,  the Scott River Watershed Council, Siskiyou RCD, Scott River Water Trust, California Department of Fish and Wildlife, Quartz Valley Indian Reservation, and other stakeholders.

Figure 1. Escapement of adult Coho salmon to the Scott River from 2007 to 2019. Data source: CDFW, Yreka, CA.

Figure 1. Escapement of adult Coho salmon to the Scott River from 2007 to 2019. Data source: CDFW, Yreka, CA.

Figure 2. Spawner-recruit relationship for Scott River Coho salmon. The number represents recruits (spawner counts) for that year versus spawners counts from three years earlier. For example: “13” represents spawner counts (recruits) in fall 2013 versus spawner numbers three years earlier in 2010. Number color represents different spawner subgroups (blue=subgroup 10-13-16-19). The Red circle highlights significant outlier in 2016. The Yellow line is trend-line for years other than 2016.

Figure 3. USGS gaged daily average flow (log scale) in lower Scott River, Klamath River tributary, 9/1/2010-2/1/2011, with 78 year average daily median flow for that date.

Figure 4. USGS gaged daily average flow (log scale) in lower Scott River, Klamath River tributary, 4/1/2011-11/1/2011, with 78 year average daily median flow for that date.

Figure 5. USGS gaged daily average flow (log scale) in lower Scott River, Klamath River tributary, 9/1/2013-2/1/2014, with 78 year average daily median flow for that date.

Figure 5. USGS gaged daily average flow (log scale) in lower Scott River, Klamath River tributary, 9/1/2013-2/1/2014, with 78 year average daily median flow for that date.

Figure 6. Scott River adult salmon collection weir counts of Coho salmon for fall-winter 2013-14. Data source: CDFW Yreka, CA.

Figure 7. USGS gaged daily average flow (log scale) in lower Scott River, Klamath River tributary, 4/1/2014-10/31/2014, with 78 year average daily median flow for that date.


Essential Needs for the Recovery of Endangered Winter-Run Salmon

Summer spawning and egg incubation water temperatures in the upper Sacramento River below Shasta Dam is a well-known and documented key to the recovery of winter-run salmon Chinook salmon. In a December 2018 post, I noted the importance of early-fall flows to support the emigration of juvenile winter-run salmon from spawning and early rearing areas of the upper Sacramento River near Redding. In this post, I add another measure to the list of essential needs.

  • Late-fall flows – Flows to move winter-run juveniles from the upper and lower river into and through the Delta in the late fall.

What kind of late-fall flows are specifically needed? The type that occurred in December 2019 from a spate of storms (Figure 1). The 10,000+ cfs flow in the lower Sacramento River got wild winter-run salmon smolts through the lower Sacramento River, as seen from the Knights Landing screw-trap catches. The 20,000+ cfs early-December pulse of Delta outflow got wild winter-run salmon smolts moving through the Bay toward the ocean, as seen in the Chipps Island Suisun Bay trawl catches.

I have previously recommended extending Fall X2 Delta outflow protections1 and reducing Delta exports2 to help the winter-run smolts during their emigration to the ocean. As it was, 10,000+ cfs exports in the latter half of December 2019 took over half of the potential Delta outflow. Figure 1 clearly shows the importance of the late-fall flows to the emigration of winter-run.

Observed patterns of winter run emigration provide further evidence of the need for flows in the late fall. Figure 2 shows late fall 2017 conditions when there was no late fall flow pulse. The movement of winter-run smolts through the Bay was delayed, occurring in small spurts from late January through March. There is no doubt that one-to-three-month delays in smolt migrations from the river and Delta to the ocean are detrimental to the population and to recovery.

Figure 3 shows the latefall flow pattern over the past decade. Recovery of winter-run salmon depends on protecting the flow pulses. The tendency is to export as much of the first flows of the water supply season as possible and get it stored in south-of-Delta reservoirs. Most of the late-fall rainfall was already captured in upstream reservoirs, so these flow pulses are just a fraction of Central Valley’s natural flows.

A close look at Figure 3 shows minimal Delta outflow in the late fall of 2011 and 2017. Both years were just coming off wet water years. Shasta Reservoir had above-average storage for December in both years (>3 MAF, two-thirds full). Modest commitments of reservoir water could have greatly benefitted winter-run emigration. Inflows to Shasta reservoir in December of both of those two years were over 200 TAF. An added release of less than half that inflow (100 TAF) could have provided five days of 10,000 cfs pulse flow to the December release pattern in both years. Such a pulse flow, in combination with reduced Delta exports (Figure 4), would have provided five days of 20,000+ cfs Delta outflows in December 2011 and 2017 to support wild winter-run smolt emigration and winter-run recovery.

Figure 1. Catch patterns of juvenile wild winter-run salmon in the upper Sacramento River at Red Bluff, the lower Sacramento River at Knights Landing, and at Chipps Island in the upper Bay in fall 2019. Red circles denote catch peaks associated with fall pulsed flows.

Figure 2. Catch patterns of juvenile wild winter-run salmon in the upper Sacramento River at Red Bluff, the lower Sacramento River at Knights Landing, and at Chipps Island in the upper Bay in fall-winter 2017-18. Red circles show dispersed timing of emigration and lack of large catch peaks in the absence of fall pulsed flows.

Figure 3. Delta outflow in late fall 2010-2019. Note lowest flows were in 2011, 2013, 2015, and 2017.

Figure 4. December 2011, 2017, and 2019 south Delta exports at the state Banks (HRO) and federal Tracy (TRP) pumping plants. Capacities are 7500 and 4400 cfs, respectively. Note the extremely high and unusual December 2019 exports.

Downward Trend in San Francisco Bay Longfin Smelt

In my last posts on longfin smelt, I expressed some optimism about their recovery from the 2013-2015 drought based on 2017 and 2018 population data (Figure 1).1 I have changed my mind. In this wet water year 2019, the longfin have again crashed.

The long-term trend over four wet-year November adult trawl surveys, including this year (2019), continues downward (Figures 2-5). The trend portrays the underlying strong spawner-recruit relationship: the number of spawners (eggs) is the key factor that determines recruits. On top of that, poor recruitment in drier years (Figure 6) is driving recruitment-per-spawner down. There is 10-100 times higher recruitment from wetter years.

What is it about both dry years and wetter years like 2019 that is so bad? It is low Delta outflow and high exports in the November-December period.

Longfin smelt spawn in November-December in fresh water.2 When their freshwater habitat is in the San Joaquin channel in the central Delta upstream of Jersey Point (See location in Figure 2, Figures 7 and 8), the newly hatched larvae are highly susceptible to unlimited November and December exports. Although 2019 was a wet year, these conditions were present in November and December (Figures 9 and 10).

The prognosis for longfin smelt under current and planned water operations in the Delta is grim. The state and federal water projects need to increase Delta outflow and reduce exports in November and December to reduce spawning of longfin smelt in the central and south Delta.

Figure 1. Fall Midwater Trawl Index for longfin smelt, 1967-2018. Source: http://www.dfg.ca.gov/delta/data/fmwt/indices.asp

Figure 2. Catch distribution of longfin smelt adults in the November 1998 fall midwater trawl survey.

Figure 3. Catch distribution of longfin smelt adults in the November 2011 fall midwater trawl survey.

Figure 4. Catch distribution of longfin smelt adults in the November 2017 fall midwater trawl survey.

Figure 5. Catch distribution of longfin smelt adults in the November 2019 fall midwater trawl survey.

Figure 6. Longfin Recruits (Fall Midwater Trawl Index) vs Spawners (Index from two years prior) in Log10 scale. The relationship is very strong and highly statistically significant. Adding Delta outflow in winter-spring as a factor makes the relationship even stronger. Recruits per spawner are dramatically lower in drier, lower-outflow years (red years). Spawners in 2017 and 2018 were at record low levels. Recruits in 2011 and 2017 were relatively high because the Fall X2 provision in the 2008 Biological Opinion was implemented. Source: http://calsport.org/fisheriesblog/?p=2513.

Figure 7. Salinity (EC) in November and December 2017 at Jersey Point in the lower San Joaquin River channel of the west Delta. Spawning would occur in fresh water (below 500 EC).

Figure 8. Salinity (EC) in November and December 2018 at Jersey Point in the lower San Joaquin River channel of the west Delta. Spawning would occur in freshwater (below 500 EC), which occurred upstream of Jersey Point.

Figure 9. Salinity (EC) in November and December 2019 at Jersey Point in the lower San Joaquin River channel of the west Delta. Spawning would occur in freshwater (below 500 EC), which occurred upstream of Jersey Point.

Figure 10. Tidally filtered flow in two channels in the lower San Joaquin River upstream of Jersey Point, portraying net flows toward to the south Delta export pumps.