The Next Threat to Winter-Run Salmon – Rising Delta Exports

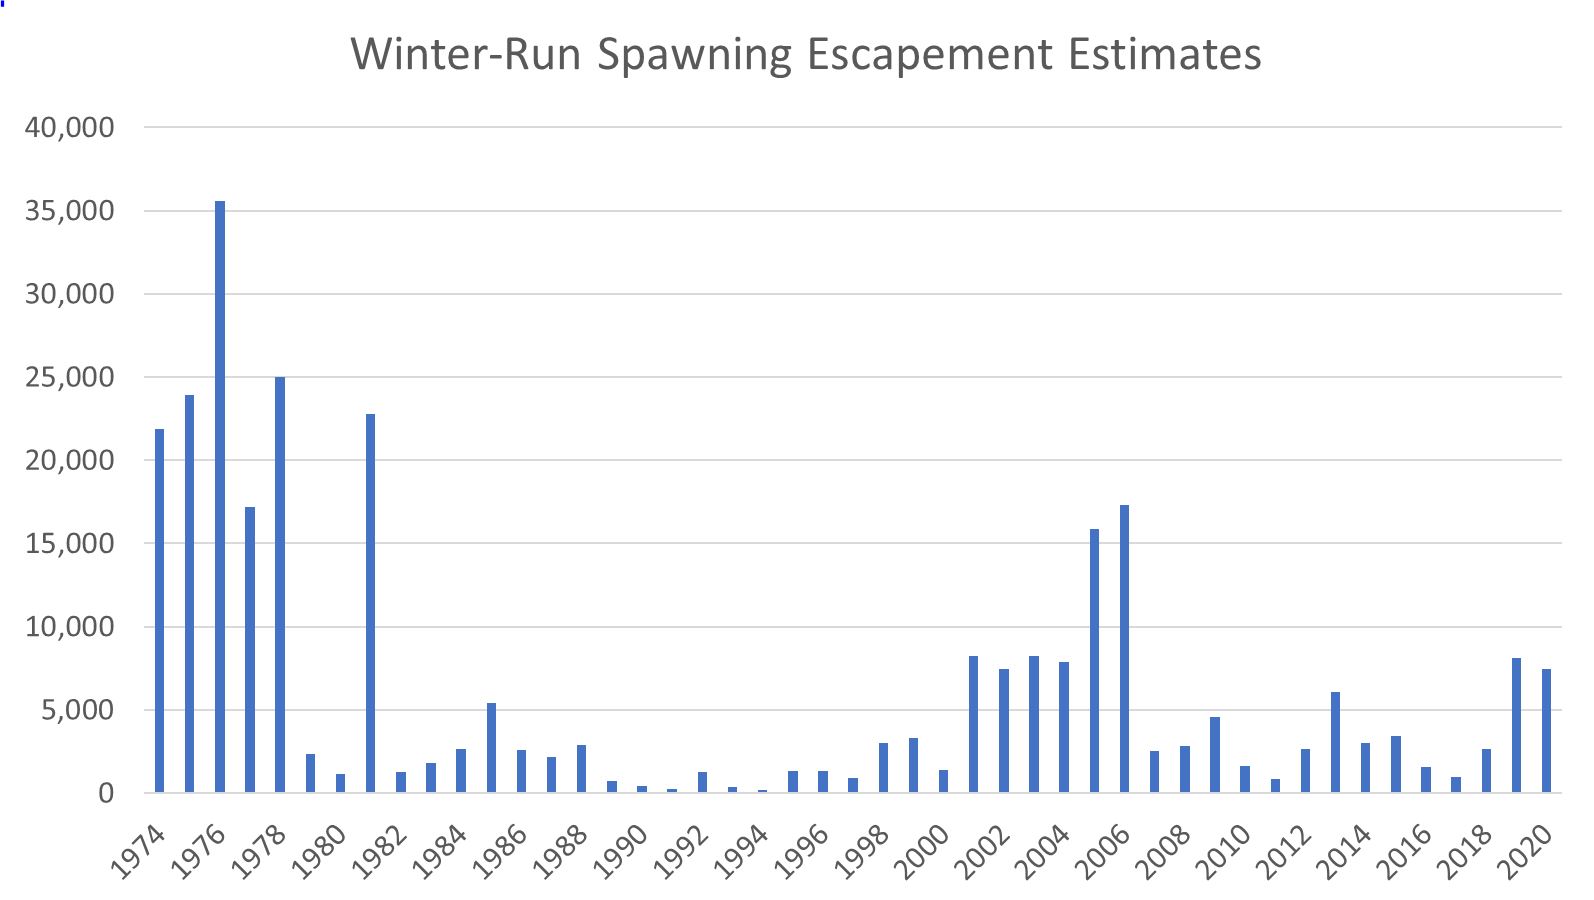
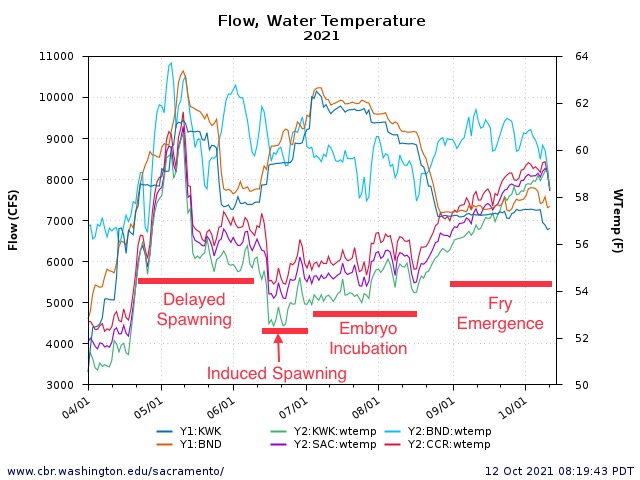
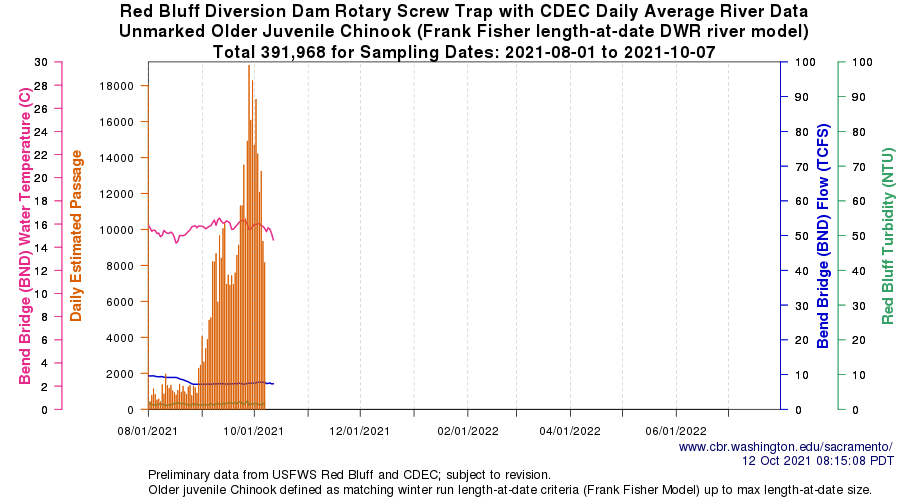
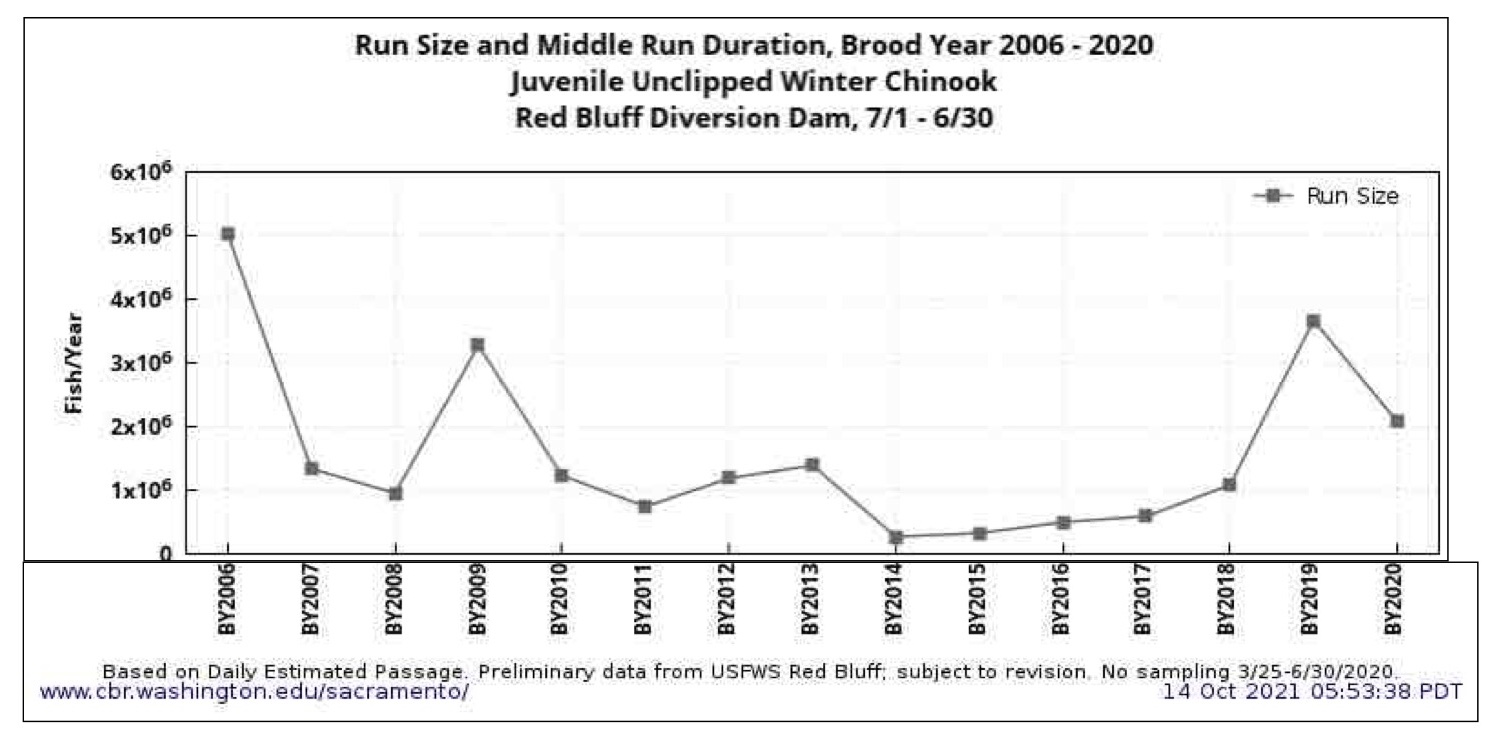
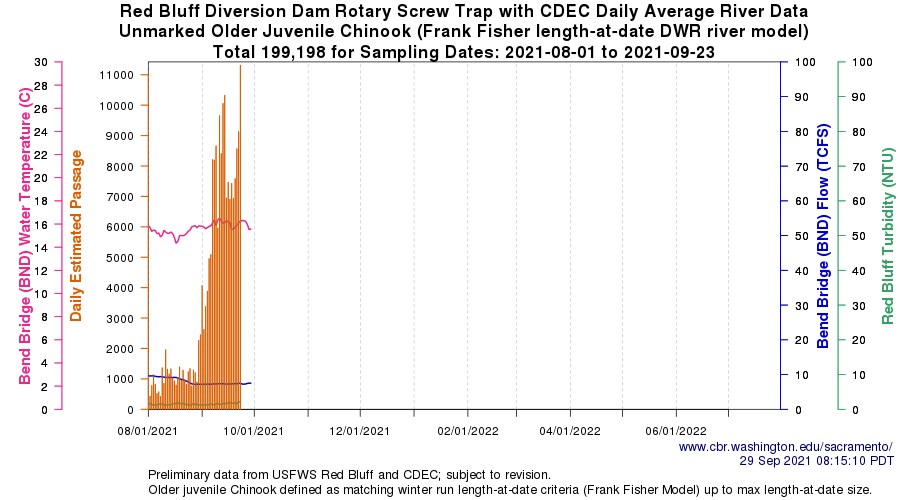
A modest production of winter-run salmon fry was achieved in the Sacramento River near Redding this summer (Figure 1).1 With the recent storm that peaked on October 24, these young salmon are now moving down the river toward the Delta (Figure 2).

Upon entering the Delta, these young salmon face the grim fate of passing through the Delta Cross Channel (DCC)/and Georgiana Slough into the central and south Delta, where they are drawn to Delta pumps by sharply increased exports (Figure 3).

The diversion of Sacramento flows increases with the periodic opening of the Delta Cross Channel (Figure 4). On an outgoing tide, the diversion via the DCC and GS can be higher than 50% under these circumstances.

Once they enter the interior Delta, it is difficult for young salmon to navigate out to the Bay. Many are drawn with reverse net flows to the south Delta, especially in periods when the DCC is closed. The risks to salmon fry in Clifton Court Forebay (predation) and at fish facility screens are severe.

Closing the DCC during the flow pulse only increases flow through Georgiana Slough and traps any diverted salmon in the interior Delta. Keeping the DCC open minimizes the reverse flows in the interior Delta, but draws more salmon in. It is a tough call either way. So the best option for this first fall pulse of winter-run fry is to minimize exports. This type of protection has been considered many times in the past. It is currently required in the Incidental Take Permit (p. 80) for the operation of the State Water Project, but not until after December 1.

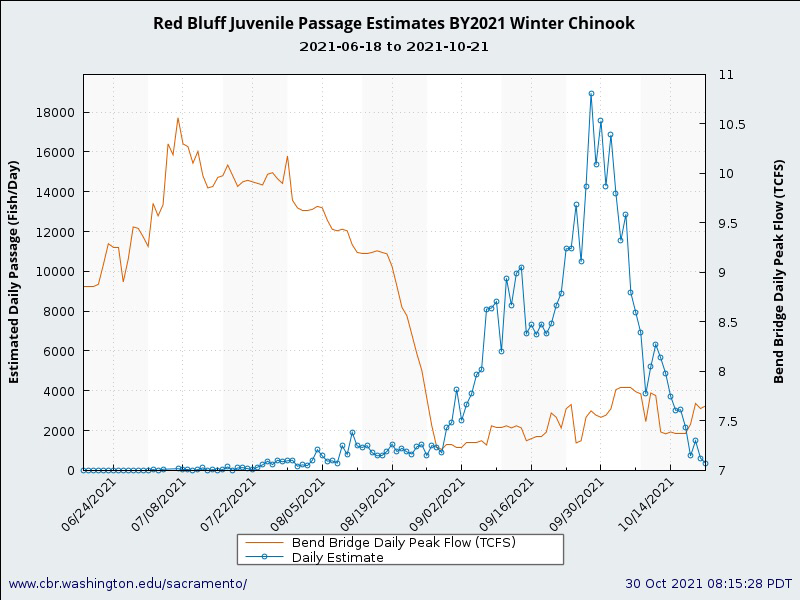
Figure 1. Passage of juvenile winter-run salmon past Red Bluff, September-October 2021.

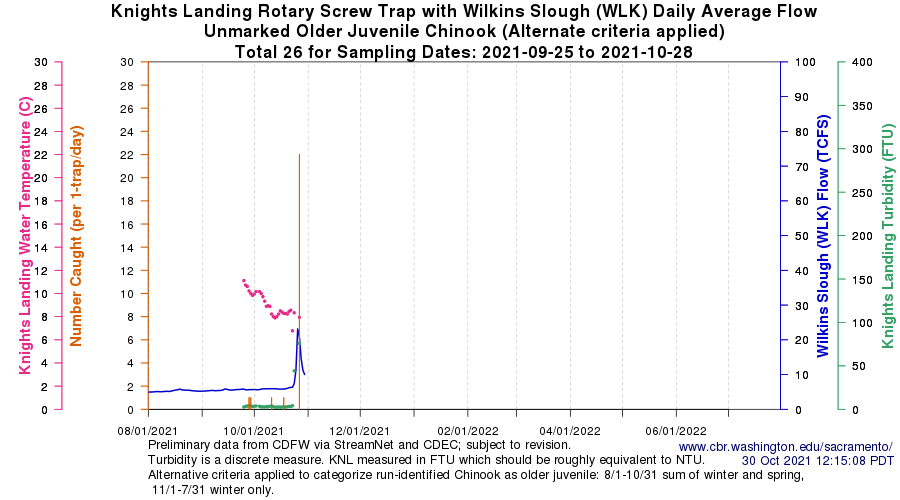
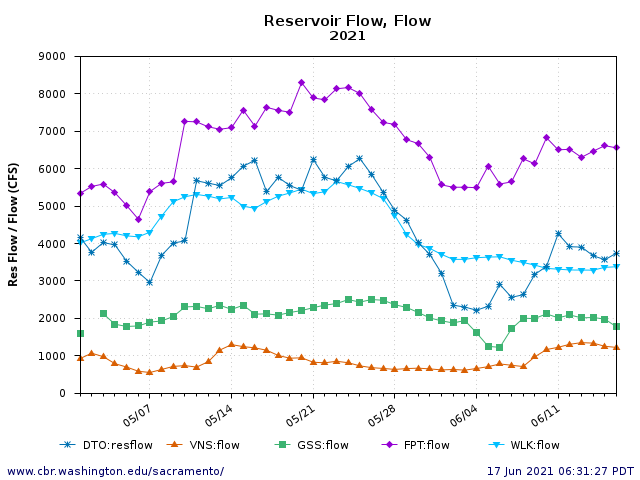
Figure 2. Catch of winter-run fry in lower Sacramento River near Wilkins Slough (RM 120) in fall 2021.

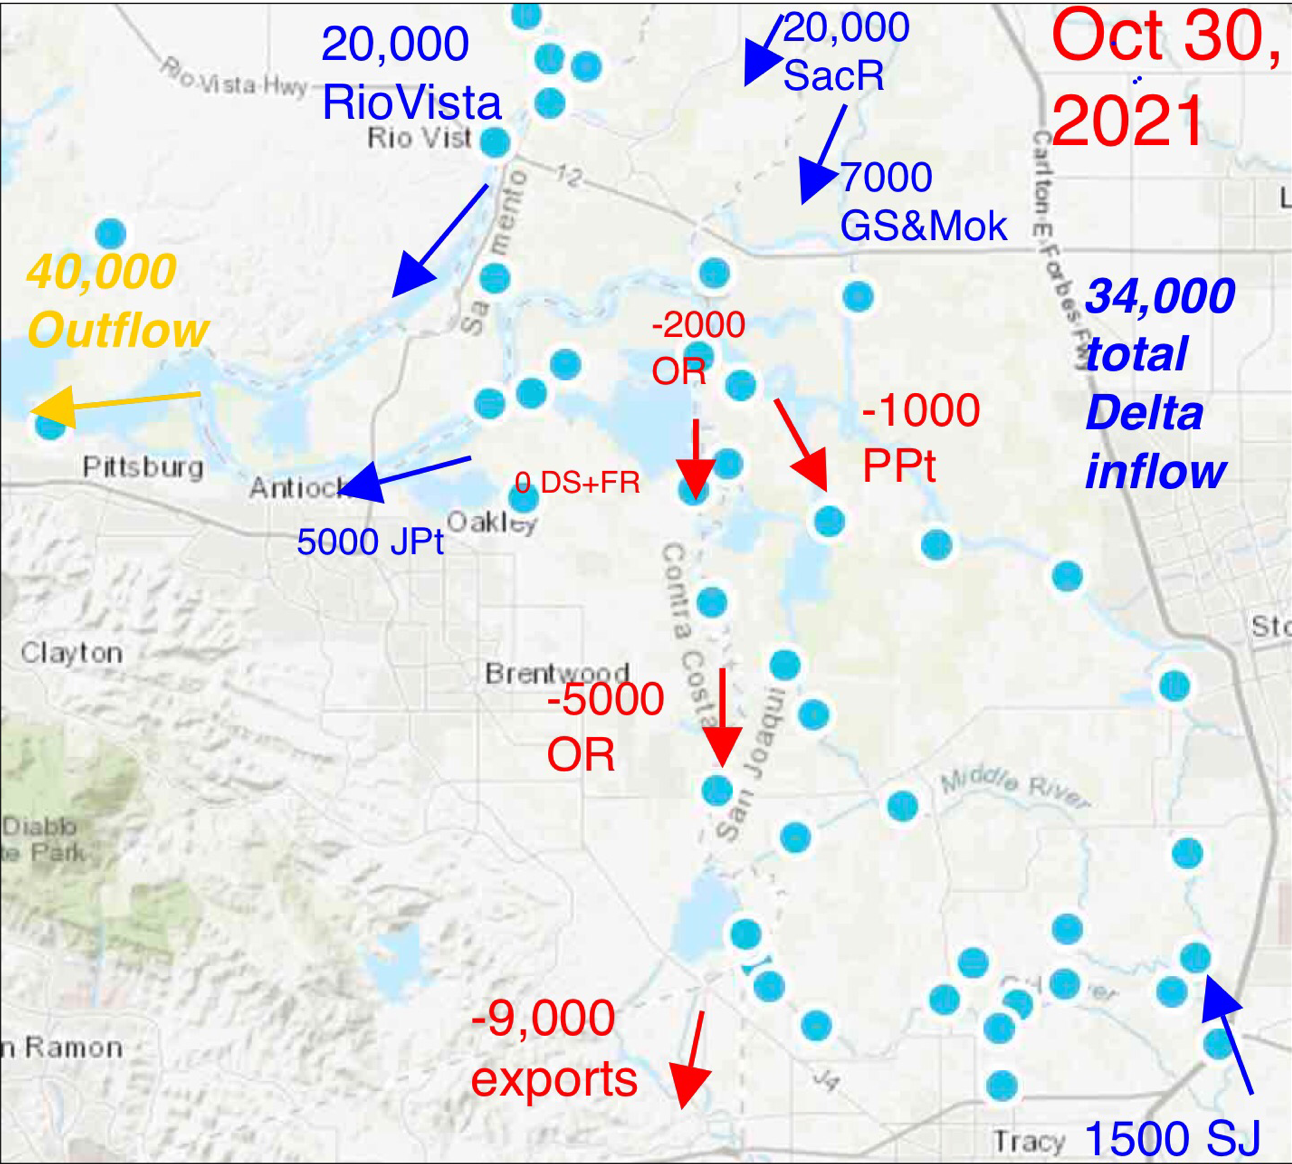
Figure 3. Graphic depiction of Delta net flow (cfs) conditions in late October 2021.

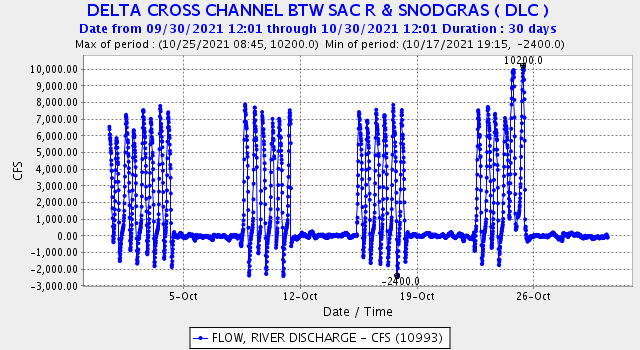
Figure 4. Hourly flows through Delta Cross Channel in October, 2021.

The Delta – Where do we go from here?

(Editor’s note: The opinions expressed in this post do not necessarily represent the positions of CSPA.)

The Delta is still here, albeit not what it used to be.  Yes, the Delta smelt are gone, the striped bass are at historic lows, and largemouth bass and bluegill abound.  Plankton densities are way down and their species-composition is highly altered.  Waters are warmer and saltier, and less turbid in dry-year summers.  Invasive aquatic plants are taking over.  Tidal flows now dominate over river inflows and Delta outflows.  Winter flushes still occur in odd years, but droughts predominate.  Climate change, heavy water use, and pollution have taken a toll.  But the Delta is still home to a vast array of native fish and other aquatic organisms, and remains a seasonal critical rearing and migrating habitat of endangered salmon, steelhead, sturgeon, lamprey, and smelt.  So what does the future have in store for the Delta, and how can we influence the outcome, especially for the aquatic ecosystem and its fish community?

To me, it has always been a simple solution involving the following array of strategic actions, although they are a very hard sale.  I have seen little progress and further damage to the Delta in my nearly 50 years working on the Delta issues, because of uncertainties and high costs, slow planning processes, and oh so many delays.

  1. Stop exporting from the south Delta. Most of the water supply comes in from the north, so why pull it through and export it from the south?  It has always been the main problem.
  2. Cut back on taking water from the Delta. Projects take a quarter of inflow and other users take another quarter or more (Figures 1 and 2).  In early June 2021, just 2000 cfs was reaching the Bay, out of 6000 cfs of Delta inflows.
  3. The Delta needs more inflow in most years. The Delta is too warm in summer (Figure 3), and now more prone to blue-green algae blooms.  Inflow from the San Joaquin is especially important to the Delta ecosystem.
  4. The Delta needs more nutrients to produce more plankton and benthos; it lacks nutrients because nutrients and aquatic productivity are exported/diverted and replaced by reservoir water that is very low in nutrients and productivity.
  5. The low salinity zone should be located west of the Delta in the cooler eastern Bay where it can be more productive – more outflow is needed. This is especially important in spring of dry years (Figure 4), when low outflow results in the low-salinity zone being located in the Delta.
  6. Invasive aquatic plants should be cut back as much as possible – this will help improve plankton, lesson water clarity, lower water temperature, and reduce habitat of non-native fishes.
  7. The biomass and productivity of non-native fishes should be reduced by whatever means possible.
  8. Pollutant inputs to the Delta should be minimized. Herbicides and pesticides and other pollutants inputs are too high.
  9. Ship-channel dredging and shoreline-shoal habitat degradation should be lessened.
  10. The tidal-prism should be increased with expansion of flow-through Delta tidal channels. Avoid shallow floodplain enhancements that increase water temperatures.
  11. Restore Delta channel riparian habitats to increase shoreline protection, provide shade, and increase aquatic and terrestrial food for fish.
  12. Release hatchery-raised delta smelt in optimal habitats in the Delta to reduce the imminent threat of their extinction.

There are more planning and restoration efforts today than 50 years ago.  So much more information is available.  It should not be this hard.

Figure 1. Delta outflow (DTO) plus major sources of Delta inflow in May-June 2021. Wilkins Slough (WLK) is contribution from upper Sacramento River system (mainly Shasta/Trinity reservoir water). Freeport is Sacramento channel in north Delta including Feather and American system reservoir inputs (total Sacramento Valley inputs minus its diversions). Vernalis (VNS) is San Joaquin Valley inputs to Delta. Flow through Georgianna Slough is water crossing over from Sacramento to San Joaquin channel including some from Delta tributaries (primarily Mokelumne River). In early June, only slightly over 2000 cfs was reaching the Bay out of slightly more than 6000 cfs of Delta inflows.

Figure 2. The major inputs and outputs from the Delta in summer 2021. DTO = Delta outflow. VNS = San Joaquin River inflow to Delta at Vernalis. FPT = Sacramento River inflow to Delta at Freeport.

Figure 3. Water temperatures in Delta plus Delta outflow in June-July 2021. FPT = Freeport. DLC = Delta Cross Channel. OH4 = Old River in central Delta.

Figure 4. Salinity (specific conductance or EC) in the western Delta near Jersey Point 2014-2021. Note three April-July periods highlighted in drought years 2014, 2015, and 2021.

Winter Run Chinook Salmon 2021 – Update 10/15/2021

When I last updated the status of the winter-run salmon population of the upper Sacramento River in an April 2020 post, trends in spawning escapement indicated the population was recovering in 2018 and 2019 after the poor runs in 2016 and 2017. That trend continued in 2020 and 2021 (Figures 1-3). These recent runs benefited from wet years in 2017 and 2019, and near-normal 2018 that contributed to better natural egg and fry survival as well as hatchery smolt survival. The only negative trend in the adult escapement is the higher proportion of hatchery-produced adults in the recent year returns that reflects the enhanced hatchery efforts1 during and after the 2013-2015 drought. The prognosis for the 2022 run remains good, as 2019 was a wet year and 2020 was near normal. Both years had flow and water temperature much better than during the 2013-2015 drought.

The prognosis for the 2023 and 2024 runs does not look as good, given the extreme drought conditions in 2021 that have likely limited survival of the 2021 brood year.2 Reclamation undertook unusual operations in 2021 in an attempt to maintain a modicum of winter-run egg and fry survival given the drought conditions (Figure 4). The first indicator of potential success is from screw trap collections at Red Bluff that indicate survival in 2021 has been better than 2015 but poorer than 2018 and 2019 (Figures 5-8). The screw trap collections also produce an end-of-season estimate of total passage (Figure 9), which is another way of summarizing these same data. These indices also show a post-drought recovery from 2018-2020, where 2021 brood-year production would likely fall back to a level below brood year 2018.

In a recent post, the Northern California Water Association (NCWA) expressed a more upbeat prognosis, although tempered by poor drought year 2021 conditions.

“To be sure, the dry and hot conditions in 2021 are not ideal for salmon nor any other part of the ecosystem that depends upon water and they are having challenging years. Yet, despite these dry and hot conditions, salmon are amazingly resilient and they: 1) have returned to the Sacramento Valley in record numbers; 2) will continue to spawn, and 3) are now beginning their journey down the river in large numbers. Importantly, there continues to be a concerted effort throughout the region to improve conditions for every freshwater life-cycle stage of all four runs of Chinook salmon.”

I generally agree on item 3, noting that “large numbers” are relative, as discussed above and shown by comparing the figures below. I do not agree with the other assertions. Much of the “record number” are hatchery fish, as also discussed above. And spawning conditions in the Sacramento River for the rest of the fall will be poor.

NCWA is one of the major users of Sacramento River water. High drought-year allocations of Shasta storage to NCWA users led to high spring demands on storage by NCWA water users (see Figure 4) and in part to the current near-record-low storage in Shasta Reservoir (Figure 10). Unless it rains and snows a considerable amount this winter, salmon and water users will be in dire straits next year.

Figure 1. Winter-run Chinook salmon escapement (run size) to the Sacramento River 1974-2020. (Source: CDFW)

Figure 2. Winter-run Chinook salmon annual aerial redd counts in the upper Sacramento River 2003-2021. (Source: CDFW)

Figure 3. Winter-run Chinook salmon annual carcass counts in the upper Sacramento River 2003-2021. (Source: CDFW)

Figure 4. Winter-run Chinook salmon spawning season conditions in the Sacramento River in 2021. River flows at Keswick Dam (KWK, rm 300) and Bend (BND, rm 250). Water temperatures KWK, BND, and Redding (SAC, rm 290; CCR, rm 280).

Figure 5. Juvenile winter-run salmon counts in Red Bluff screw traps 8/1-10/7, 2021.

Figure 6. Juvenile winter-run salmon counts in Red Bluff screw traps 8/1/15-8/1/16.

Figure 7. Juvenile winter-run salmon counts in Red Bluff screw traps 8/1/18-8/1/19.

Figure 8. Juvenile winter-run salmon counts in Red Bluff screw traps 8/1/19-8/1/20.

Figure 9. Estimated total passage past Red Bluff of unclipped (naturally produced) juvenile winter-run salmon for brood years 2006-2020.

Figure 10. Lake Shasta water level conditions in water year 2021-2022 and other water years, plus historical averages. Source: DWR-CDEC.


Long-Term Downward Trends in the Klamath River

Over the past dozen-odd years, there have been significant negative trends in flow, water temperature, and lake levels in the upper Klamath River in California.  The trends likely reflect global warming, climate, and patterns in water supply use in the Klamath watershed.  The parameters contribute to declines in toxicity and fish populations, which are the subject for a future post.

Klamath Lake Storage

Klamath Lake elevation and storage over the past dozen years have been significantly below average in five years: 2010, 2014-15, and 2020-2021 (Figure 1).  Year 2021 is the worst year in terms of lake level.  Minimum lake levels occurred at the end of drought years 2009, 2012, and 2014.

Klamath Lake Releases (Outflow)

Klamath Lake outflow patterns indicate low levels of outflow in drought years, but also a general decline in winter minimums over the past dozen years (Figure 2).  The low outflow minimums may reflect efforts to recover lake storage in low-storage years (e.g., winter 2012-13).

Klamath Lake Outfall Water Quality

The water temperatures of Klamath Lake outflow have risen significantly over the past dozen years, especially in drought years (with 2021 being the warmest), but also in some wetter years like 2017 (Figure 3).  Dissolved oxygen and pH have trended downward over the years (Figure 4).  Dissolved oxygen and pH have generally fallen in the summer, possibly an indication of lower summer algae production in the lake.  Low late-summer and fall oxygen levels likely reflect high organic loads and lower algae production in the lake above.

Lower Klamath River Flows into California

There has been a general downward trend in Klamath River flow releases from the JC Boyle Dam and Iron Gate Dam into California (Figures 5-7).  Minimum flow periods reflect the minimum flow periods from Klamath Lake (see Figure 2).  The dominant features are lower flows in periods of drought generally and the unusually low 2020 and 2021 flows in particular.

California Tributary Inflows to Klamath River

California tributary inflows to the Klamath (Figures 8-10) reflect the dry-wet year patterns of the upper river.  Years 2020 and 2021 have had unusually low tributary flows, especially in the Scott River.

Summary

The water levels, river flows, and water quality in the Klamath River watershed  from 2008 through 2021 have declined overall, dominated by drought in 2008-2009, 2013-2015, 2018, and 2020-2021. Current conditions are the worst during this thirteen-year period.

Figure 1. Water levels in Klamath Lake 2008-2021.

Figure 2. Water releases from Klamath Lake 2008-2021.

Figure 3. Water temperature of water flows from Klamath Lake 2008-2021.

Figure 4. Water quality of water flows from Klamath Lake 2008-2021.

Figure 5. Klamath River stream flow near Keno, Oregon.

Figure 6. Streamflow to lower Klamath River below Iron Gate Dam 2008-2021.

Figure 7. Streamflow to lower Klamath River below Scott and Shasta Rivers near Seiad Valley, California 2008-2021.

Figure 8. Shasta River flows 2008-2021.

Figure 9. Scott River flows 2008-2021.

Figure 10. Salmon River flows 2008-2021.


Poor First Indicators of 2021 Winter-Run Salmon Fry Production

The first indicators of winter-run salmon spawning survival in the Sacramento River in 2021 indicate poor production, as expected.1 The drought and Reclamation’s operations in 2021 have provided production levels on par with 2014 and 2015, the last two critical drought years.

Red Bluff screw-trap collections since August 1, 2021 have been very low (Figure 1). The spawning delay in 2021 due to high spring water temperatures and low flows may be delaying downstream movement. However, outmigration patterns are similar to 2014 and 2015 (Figures 2 and 3). Even 2020, a dry year with poor production, had numbers five times higher than 2021 to date (Figure 4). Historical wet years with good production like 2006 had collection numbers ten times higher (Figure 5). There is a slim chance that the spawning delays and low flows of 2021 will provide screw-trap collection patterns similar to 2018, a dry year with a later collection peak (Figure 6).

Regardless of the low fry production, the young winter-run salmon must still make it 300 miles to the ocean this fall and winter, a phenomenal hurdle under the best of circumstances. Low fall flows will make the journey difficult. The class of 2021 will get no help from storage releases. Like almost every other user of California water in the beginning of water year 2022, outmigrating winter-run salmon are wholly dependent on future rain to provide the water they need.

Figure 1. Late summer 2021 catch of salmon fry at Red Bluff traps with water temperature, streamflow, and water turbidity.

Figure 2. The 2014 catch of salmon fry at Red Bluff traps with water temperature, streamflow, and water turbidity.

Figure 3. The 2015 catch of salmon fry at Red Bluff traps with water temperature, streamflow, and water turbidity.

Figure 4. The 2020 catch of salmon fry at Red Bluff traps with water temperature, streamflow, and water turbidity.

Figure 5. The 2006 catch of salmon fry at Red Bluff traps with water temperature, streamflow, and water turbidity.

Figure 6. The 2018 catch of salmon fry at Red Bluff traps with water temperature, streamflow, and water turbidity.