July-Aug 2020 Delta Outflow – New State Standard Needed

The State’s Delta outflow standard for July and August varies from 3000 to 8000 cfs on a 14-day average. The standard in in the drier years is 3000 cfs. The standard in wetter years is 8000 cfs in July and 4000 cfs in August.

These standards have been met for the most part over the past five years (Figure 1). Outflow was greater in 2017 and 2019 than these numeric outflow standards since the State also had to meet the Delta salinity standard that in wet years extends into August. The outflow standard in August 2015 (3000 cfs) was not met under a State Board emergency order in the third year of drought.

The July and August Delta outflow standard should be a 10,000 cfs minimum daily average tidal flow at Rio Vista in the Sacramento River (Figure 2) and 2000 cfs minimum daily average tidal flow at Jersey Point in the San Joaquin River (Figure 3). In addition, a standard of -2000 cfs in False River (Figure 4) is needed to protect endangered smelt and salmon, as well as to protect water quality in the central Delta.1

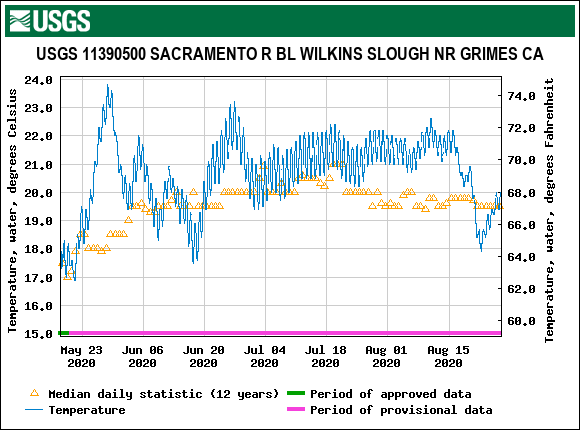
Standards should also be set to protect against extreme events and circumstances. An example is salt intrusion and high water temperatures in the Delta, such as occurred in a heat wave in mid-August 2020 (Figure 5 and 6). Water temperatures of 23-25oC in the low salinity zone (500-6000 micro-mhos conductivity) are rare and highly detrimental if not lethal to smelt and salmon. Delta exports were raised from 6,000 cfs to 10,000 cfs from 8/10 to 8/22. Delta inflows were raised 4000 cfs during the period to accommodate increased exports (Figure 7). The increasing inflows helped bring warm water from the interior Central Valley into the Delta (Figure 8).

Such conditions should be avoided at all costs. This can be achieved by limiting exports, reservoir releases, or both. August is a peak month of the fall-run salmon migration into the Sacramento Valley. Such high water temperatures would be lethal or avoided with the run being delayed and salmon holding in the Bay. The Delta smelt population concentrates primarily in the low salinity zone, and water temperatures higher than 25oC are lethal to Delta smelt.

I acknowledge the difficulty in meeting these proposed standards, especially in drier years, but they must be adopted to protect the salmon and smelt. New standards are essential for the Delta’s recovery.

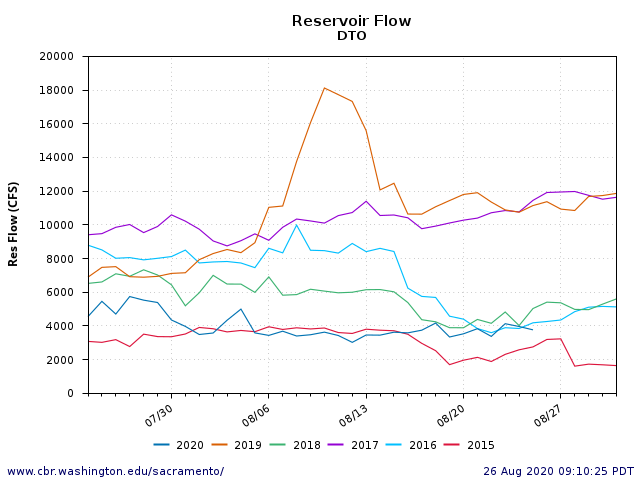
Figure 1. Delta outflow in summer of years 2015-2020. Note difference in August between wet (2017, 2019) and drier (2015, 2016, 2018, 2020) years.

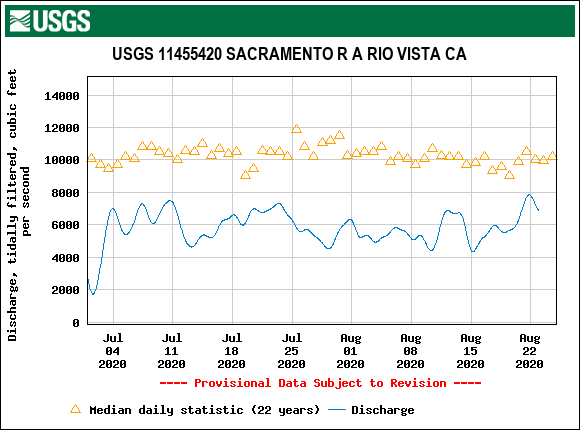
Figure 2. Daily average (tidally filtered) flow in the Sacramento River channel at Rio Vista in the north Delta in summer 2020 and average of last 22 years.

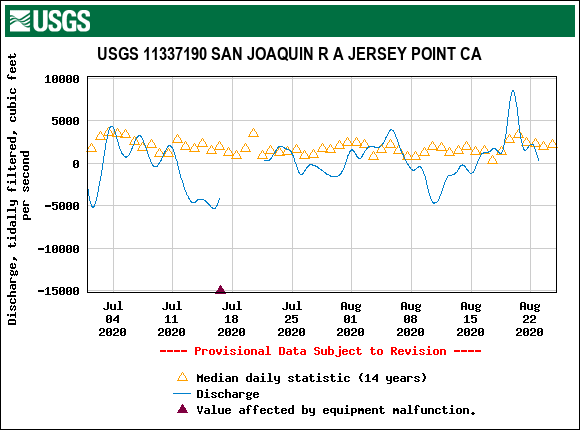
Figure 3. Daily average (tidally filtered) flow in the San Joaquin River channel at Jersey Point in the west Delta in summer 2020 and average of last 22 years.

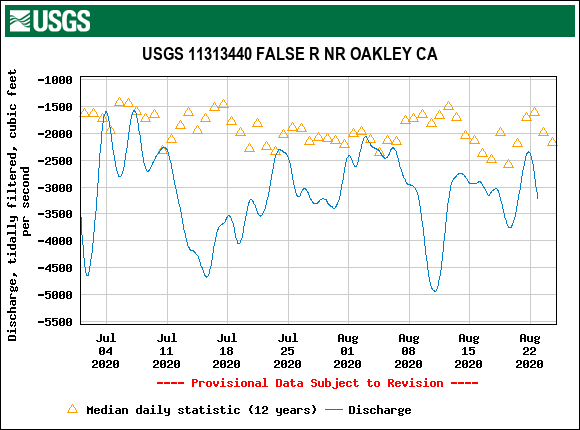
Figure 4. Daily average (tidally filtered) flow in the False River channel in the west Delta in summer 2020 and average of last 22 years.

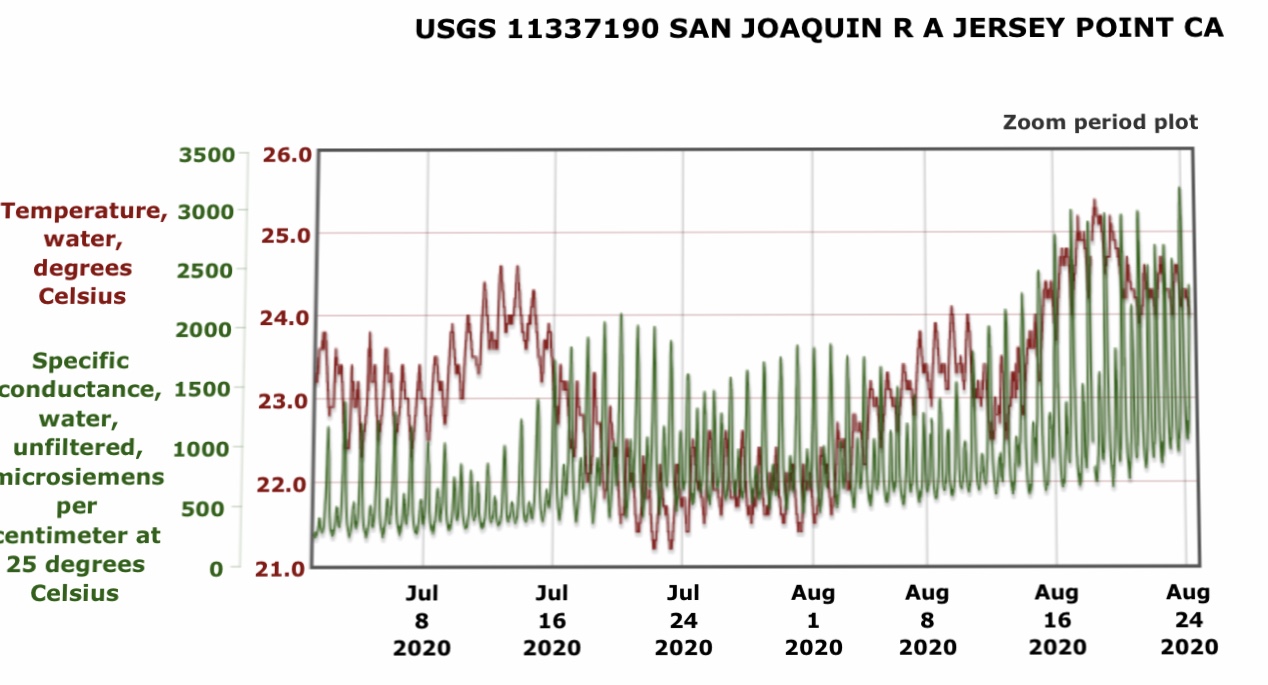
Figure 5. Water temperature and salinity (specific conductance) at Jersey Pt in the San Joaquin channel of the west Delta in summer 2020.

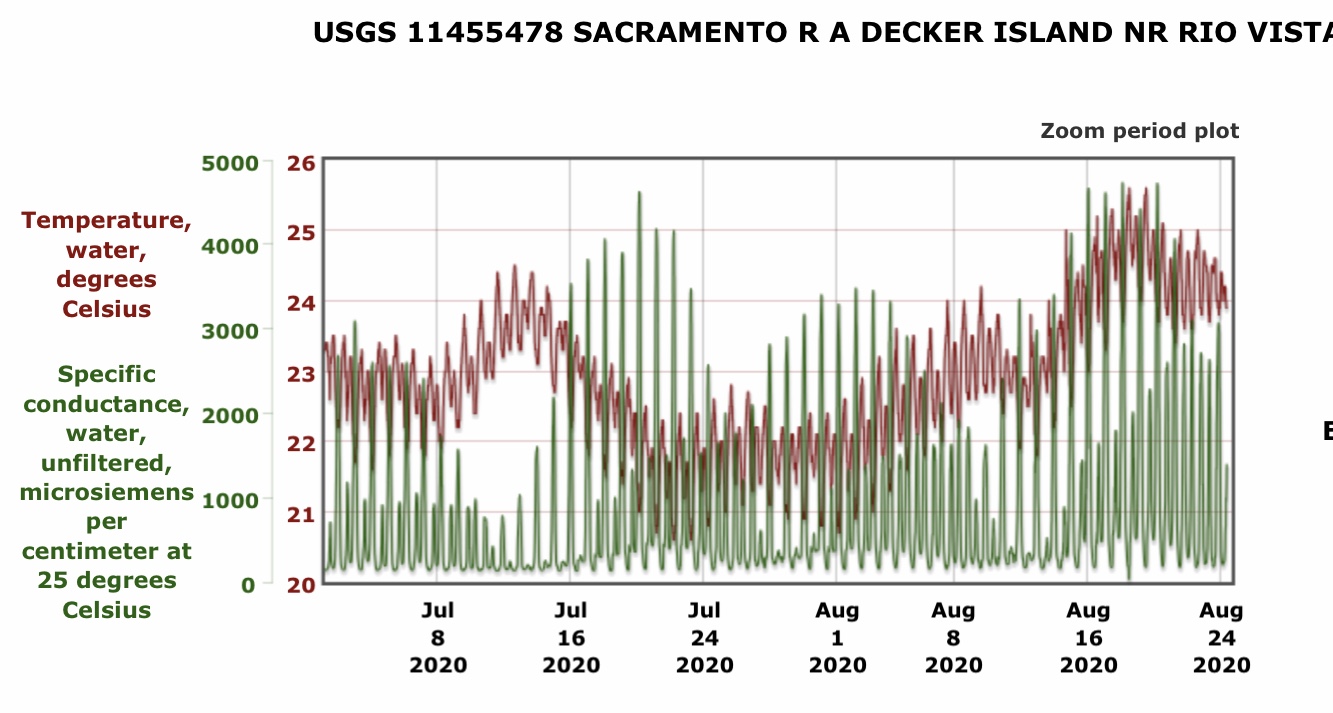
Figure 6. Water temperature and salinity (specific conductance) at Decker Is in the Sacramento River channel of the west Delta in summer 2020.

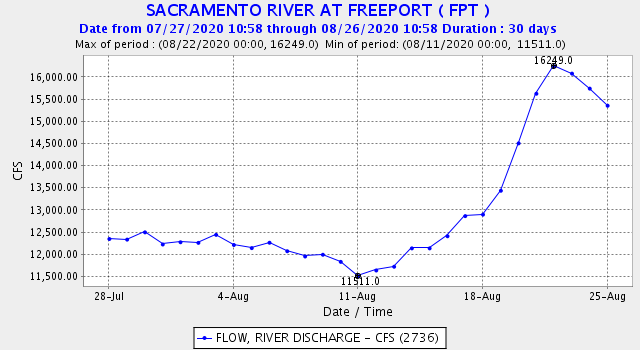
Figure 7. Daily average flow in the Sacramento Rivers channel in the north Delta near Freeport in July-August 2020. Note the flow pulse in late August from reservoir releases to meet Delta export increase.

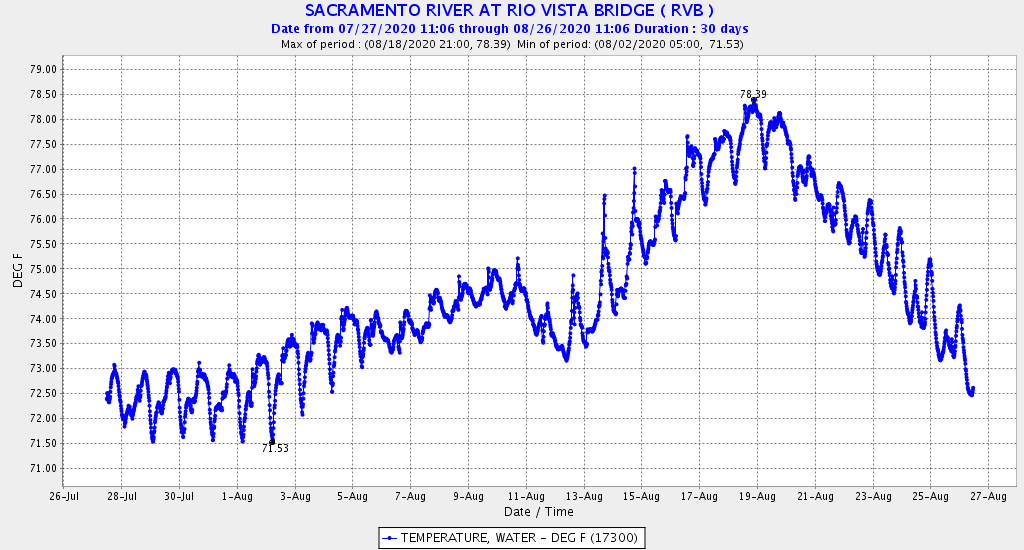
Figure 8. Hourly water temperature of the Sacramento River at Rio Vista in July-August 2020.

  1. A tide gate on False River would help accomplish this objective.

Winter-Run Salmon Update – August 2020

In my last update, March 2019, I summarized the population trends of winter-run Chinook salmon through 2017. In this post I include run estimates for 2018 and 2019. The trend indicates the population is recovering from the poor runs in 2016 and 2017 (Figures 1and 2), which were the consequence of poor spawning and rearing conditions.

The improvement is the result of more hatchery contributions and better natural contributions. The strong spawner-recruit relationship continues (Figure 3), with an improved 2019 run that spawned (in hatchery and wild) in summer of normal year 2016 and reared and emigrated during wet water year 2017. In contrast, the poor 2016 and 2017 runs were a consequence of critical drought conditions during spawning (2013 and 2014) and rearing/emigration (fall-winter of water years 2014 and 2015). The 2017 run could have been even worse had hatchery smolt releases not been doubled in winter 2015.

NMFS (2019) concluded the recovery was due to increased hatchery contributions and “better water management”. The latter is simply not true. Year 2017 was a wet year that contributed to good fall-winter survival of broodyear 2016 (Figure 4). By December 2019 NMFS knew that its draft biological opinion was being revised to limit protections.1

The prognosis for the 2020 run (from brood year 2017) is good given wet year summer spawning and incubation conditions in 2017 and normal year winter 2018 conditions. With hatchery stocking back to the normal 200,000 annual smolt level in the Sacramento River at Redding, a run of 3000-5000 can reasonably be expected despite the depleted spawning run in 2017. High summer egg-to-fry survival in 2017 (Figure 4) will also contribute. The 2020 run may also benefit from the initial release of 215,000 winter run hatchery smolts into Battle Creek in 2018. Some of these will return as two-year-old “jacks and jills” in 2020.

Several factors make the prognoses for the 2021 and 2022 (and future) runs less optimistic. Egg/fry survival of wild winter-run was lower again in 2018 and 2019 (Figure 4). The new (October 2019) federal Biological Opinion for winter-run is less protective than the Opinion it replaced,2 and the Bureau of Reclamation’s new water management is explicitly directed toward maximizing water deliveries.

On the positive side, hatchery releases including releases into Battle Creek continued in 2019 and 2020, and the estimates of migrating juvenile winter-run were higher for brood year 2019 in wet summer 2019 (Figure 5). As a result of a Settlement Agreement with CSPA, the State Water Board has required the Bureau of Reclamation to develop new protocols to meet water temperature requirements in the Sacramento River. It remains to be seen how these protocols translate into practice.

In the past three decades, the essential needs for winter-run salmon have not been met.3 Management of winter-run salmon must improve survival of wild eggs and juveniles in the summer spawning and fall-winter rearing-emigration seasons, with supplementary hatchery smolt releases as necessary. We cannot simply rely on wet years to keep wild winter-run salmon going in the Sacramento River.

Figure 1. Spawning population estimates of adult winter-run salmon in the upper Sacramento River from 1974 to 2019. Source: CDFW GrandTab and NMFS.

Figure 2. Spawning population estimate since 1997 showing proportion of hatchery and wild adult spawners. Source: NMFS (2019).

Figure 3. Spawners versus recruits (spawners three years later) transformed (logx minus 2). Year is recruit year spawners. For example, 2017 is the run size for 2017, representing spawners from brood year 2014. Color denotes water-year type in fall-winter rearing/emigration year: bold red is critical year, non-bold red is dry year, yellow is below-normal year, and blue is wet year. For example, red 15 and dot margin represent critical water year 2013. Yellow dot fill represents spawning year was a below-normal water year. Note 2016 and 2017 had both critically dry year summer spawning and fall-winter rearing-emigration. The blue 2019 point is a preliminary estimate.

Figure 4. First summer survival rate by brood year based on egg and fry production rate estimates. Egg number is derived from adult spawner estimates. Fry number is derived from Red Bluff screw trap estimates. Source: NMFS.

Figure 5. Brood year winter-run salmon early life history and abundance (2005-2019) as measured at Red Bluff. Source: http://www.cbr.washington.edu/sacramento/tmp/hrt_1599751617_74.html


Partnership Shares Science to Find Fish and Water Solutions

“This month six California and federal agencies representing water management, fish, and wildlife, along with the Sacramento River Settlement Contractors, signed onto the Sacramento River Science Partnership. The Partnership establishes an interagency science collaborative in which members will develop, share and discuss science to inform water management activities and protection of fish in the mainstem Sacramento River.” (8/25/20 News Release)

  •  The seven signatories will foster and advance science to inform sustainable solutions to water management challenges including conflicts between water supply delivery and fish survival.

The time when anyone thought that the problems confronting Central Valley salmon could be solved with more science is long gone. The problems and solutions have not really changed in the 40+ years I have been involved. And the problems are only getting worse. Why is it so hard to address them?

The Problems

As a consequence of rainfall, snowmelt, reservoir storage and release, and water diversions, flows in the Sacramento River, have become so low and erratic that they strand salmon spawning redds and create prolonged high water temperatures in the juvenile rearing and migration reaches of salmon. It is a wonder that there are any wild salmon left. Without hatcheries, there would be few if any salmon in the Central Valley at all.

Spring-Summer Water Temperatures

Spring-summer water temperatures in the lower Sacramento River are bad. They kill salmon and sturgeon, block migrations, lead to poor juvenile salmon growth, early migration, high predation, and cause huge predation problems for young hatchery and wild salmon. The high temperatures exceed state water quality standards and water project permit requirements. Yes, water temperatures were bad during the 2013-2015 critical drought, as might be expected (Figure 1). But they have also been bad in the five normal and wet years (2016-2020) since the drought (Figure 2). The safe level is 65°F, but the standard is set at 68°F, above which stress and higher mortality occurs. 68° is supposed to be an upper limit that should not be exceeded, and in past decades it rarely was. It is now the accepted norm, and even then it is not enforced.

In 2020 (Figure 3) spring water temperatures were detrimental to the upstream migration of endangered winter-run and spring-run salmon, emigrating juvenile fall-run salmon, and larval and juvenile sturgeon. High summer temperatures hinder migration of adult fall-run salmon and are detrimental to survival of winter-run fry, over-summering late-fall-run and fall-run salmon smolts, and rearing juvenile sturgeon.

Fall Drops in Water Levels

Often, usually in October-November, flow releases from Shasta reservoir drop sharply in response to decreasing downstream irrigation demands. The decreases lead to fall-run salmon redd dewatering in the upper river spawning area near Redding and poor habitat and emigration flows for winter-run and late-fall run juvenile salmon.

Stranding

Adult and juvenile salmon are stranded throughout the Sacramento River floodplain after winter-spring, high-flow events. In addition, drops in water surface elevation of four feet in the fall (Figures 4 and 5), soon after spawning de-water the vast majority of fall-run spawning redds in the 20-mile spawning reach downstream of Keswick Dam. Drops in flows after floodway weir spills (Figures 6 and 7) strand adult salmon and sturgeon that are migrating upstream, and also strand juvenile downstream emigrants in the Sutter and Yolo floodway bypasses.

Hatchery Releases

Releases of millions of hatchery-raised salmon and steelhead smolts in winter and spring into the lower Sacramento River from federal and state hatcheries compromise wild salmon and steelhead fry, fingerling, and smolt survival throughout the lower Sacramento River. Hatchery salmon and steelhead prey upon and compete with wild salmon and steelhead, and attract non-native predatory striped bass that also feed on wild salmon and steelhead.

Solutions

A new science plan for the upper reaches of the lower Sacramento River is not going to solve the problems that stem from failure to act on what science has told us for decades.

Solutions to the problems outlined above abound. These solutions are well documented in the Central Valley Salmon and Steelhead Recovery Plan (NMFS 2014) and other stakeholder plans.1 The most important solution, is water temperature limits in the lower Sacramento River, which were adopted decades ago in state water permits and water quality control plans. These limits designed to protect salmon are simply no longer enforced.

Figure 1. Water temperature in the lower Sacramento River from 2013-2015 critical drought years near Grimes, CA. Also shown is average for the past 11 years of record. https://nwis.waterdata.usgs.gov/nwis/

Figure 2. Water temperature in the lower Sacramento River from 2016-2020 post-drought years near Grimes, CA. Also shown is average for the past 11 years of record.

Figure 3. Water temperature in the lower Sacramento River in 2020 near Grimes, CA. Also shown is average for the past 11 years of record.

Figure 4. Sacramento River flows in fall of 2013 below Keswick Dam near Redding.

Figure 5. Sacramento River water surface elevation in fall of 2013 below Keswick Dam.

Figure 6. Spills of water from Sacramento River over Tisdale flood control weir during the period from December 2013 to February 2015. Source: CDEC

Figure 7. Spills of water from Sacramento River over Tisdale flood control weir during the period from January 2016 to May 2017. Source: CDEC