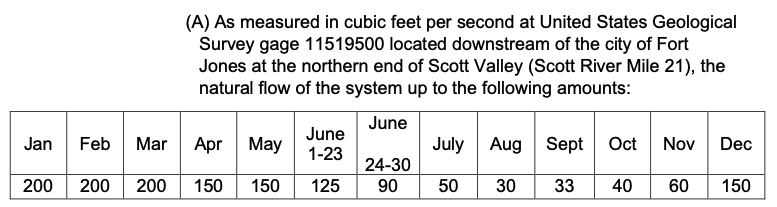
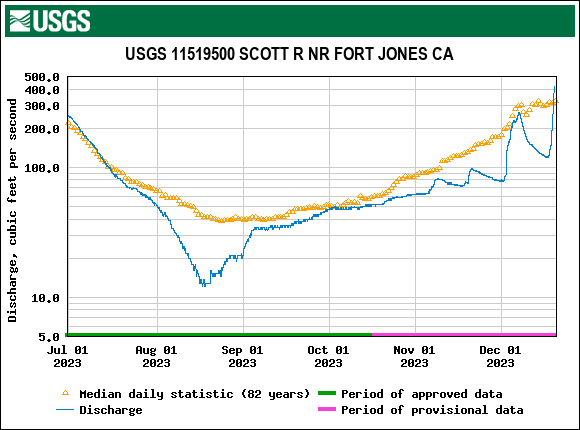
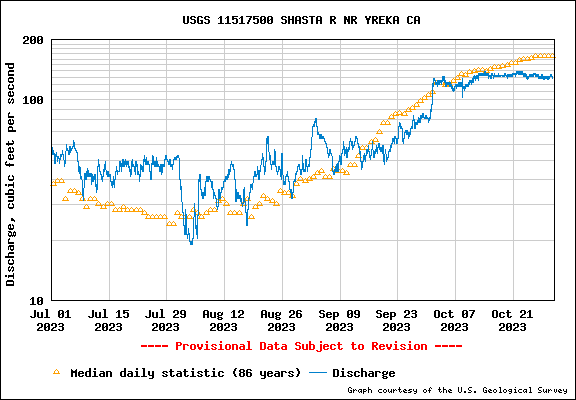
This is my first update of the status of the Klamath River coho salmon population since the removal of four Klamath River dams in 2024. My initial focus was on the Chinook populations.1 The adult coho run during late fall 2024 seemed unperturbed by the effects of dam removal in 2024. Adult coho in 2024, from Broodyear 2021, came back to the Scott River in relatively good numbers. (Figures 1 and 2).
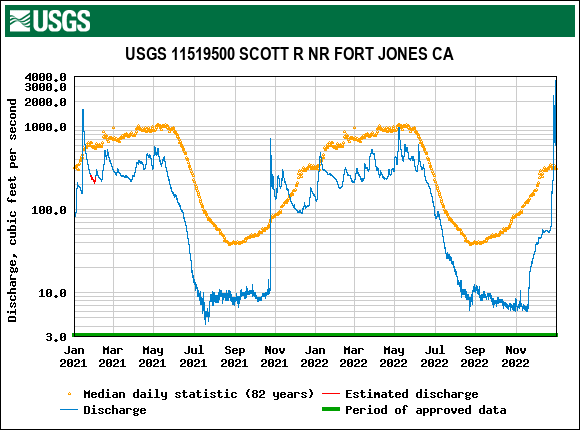
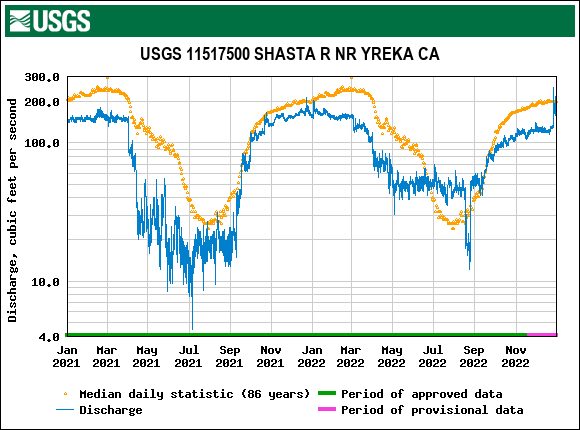
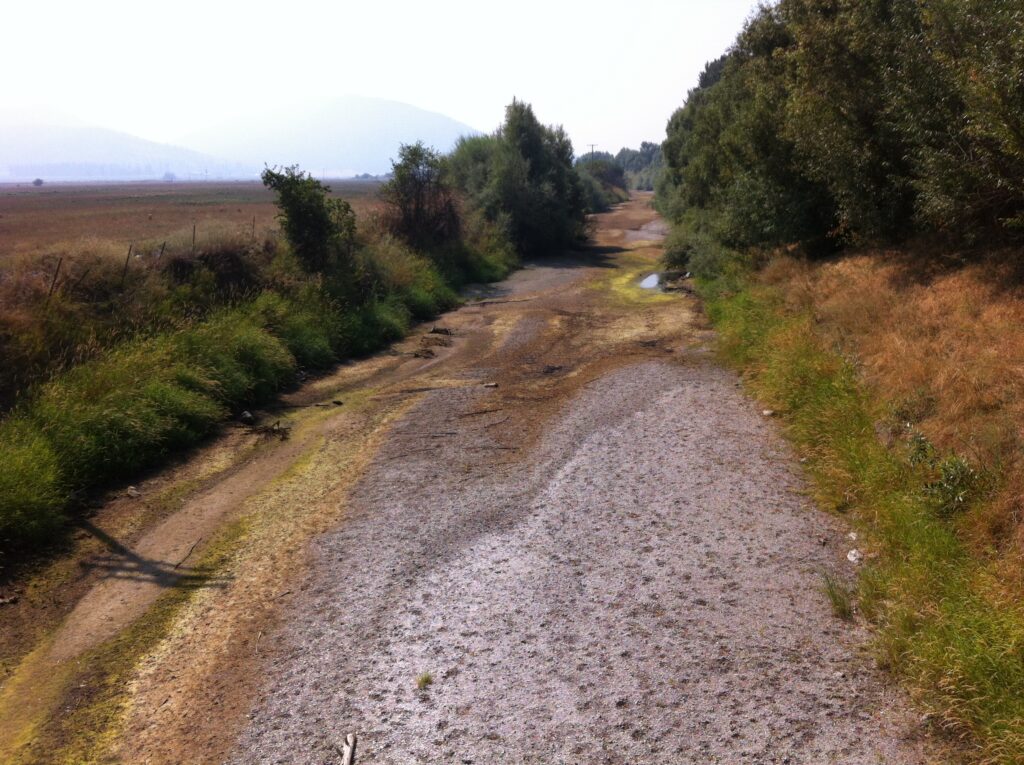
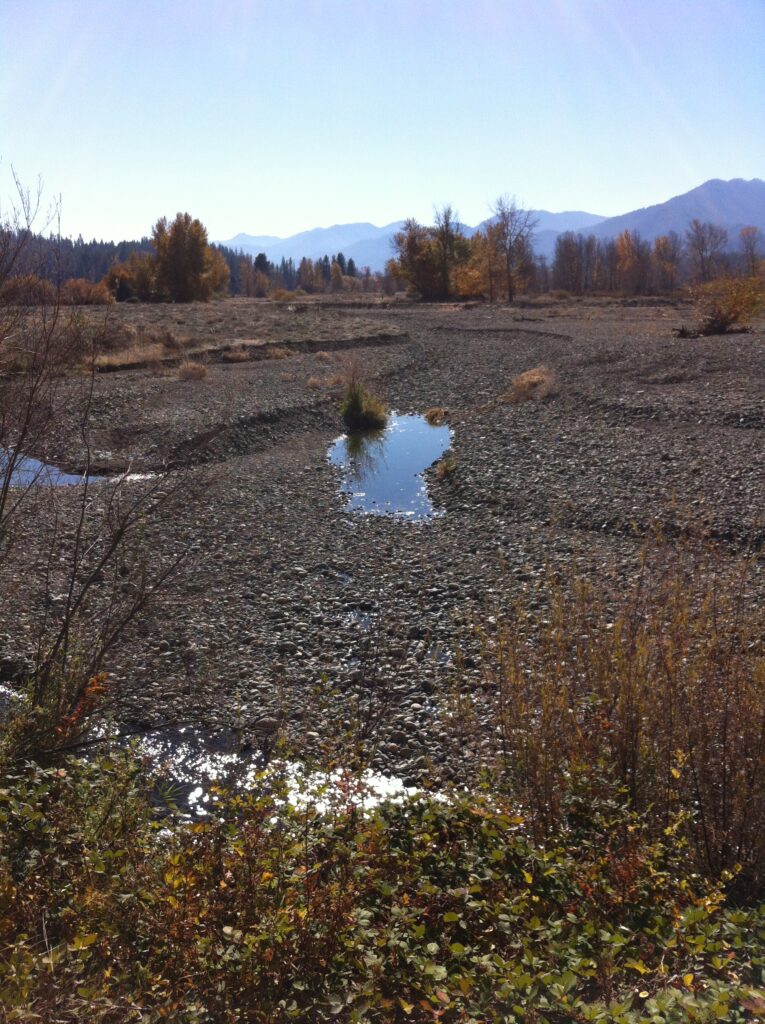
The progeny of Broodyear 2021 were in the ocean prior to the fall of 2024. They returned to the Scott River late enough in 2024 to miss the last of the high turbidity events of late summer 2024, when the remnants of the dams were removed (Figures 3 and 4).
Unlike Broodyear 2021, Broodyear 2022 was subject to the full impact of dam removal in 2024 (see Appendix). Broodyear 2022 spawned in the late fall and early winter of 2022-2023. During the first year (2023), juvenile coho from Broodyear 2022 reared in the Scott River and mainstem Klamath. They then migrated to the ocean during winter-spring 2024 freshets as yearling smolts. Winter and early spring mainstem conditions in 2024 were characterized by high turbidities (see Figure 4) from reservoir drawdown and dam removal activities, including assisted sediment evacuation in the dam-removal reach and downstream mainstem (Figure 5).
The first indication of the effects of the 2024 dam removal process is in the escapement number of Broodyear 2022 in fall 2025. Preliminary escapement estimates in fall 2025 are markedly reduced compared to recent past runs (Figures 6 and 7). Updates by CDFW of escapement numbers for the winter 2026 will provide a full assessment of Broodyear 2022 effects and initial indications of the spawning run represented by adult from Broodyear 2022.
For now, I can only assume that Broodyear 2022 was compromised by the events of 2024 dam removal process. The high fall and early winter flows of 2025 (Figure 8) likely led to widely dispersed spawning of Broodyear 2022 adult in the Scott River. Much of the egg/fry production will be subject to isolation and the potential of eggs/fry becoming stranded and eventually lost. Past efforts to rescue stranded fish should be redoubled in 2026 to save what is likely limited production. Mainstem Klamath flows should be carefully regulated through the summer and fall to sustain juvenile rearing and migration habitat conditions for wild and hatchery coho during 2026.
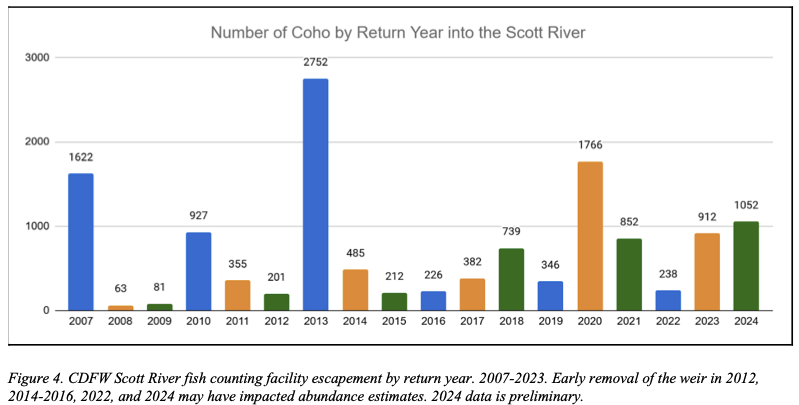
Figure 1. Source: CDFW and Scott River Watershed Council.
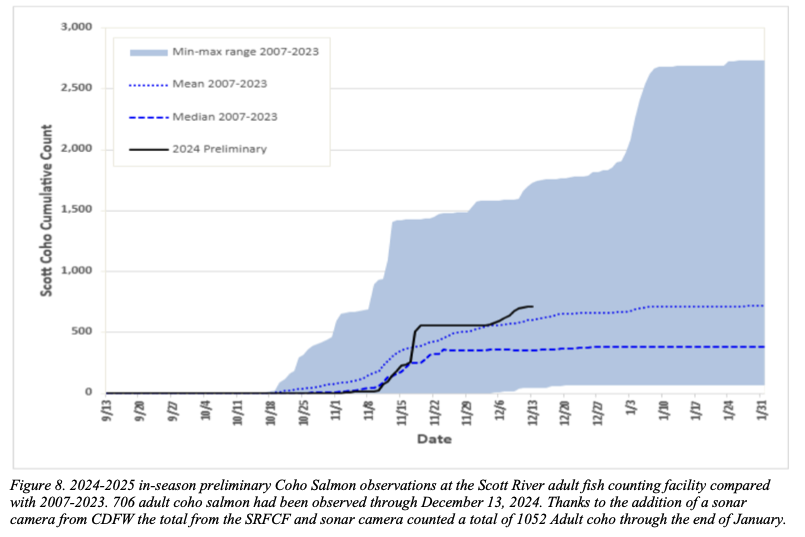
Figure 2. Source: CDFW
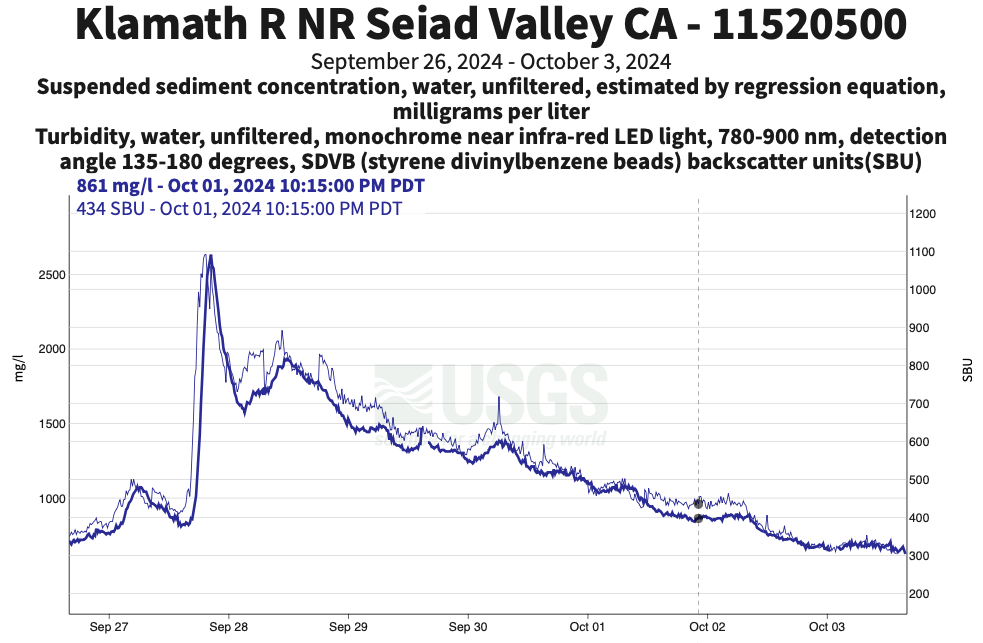
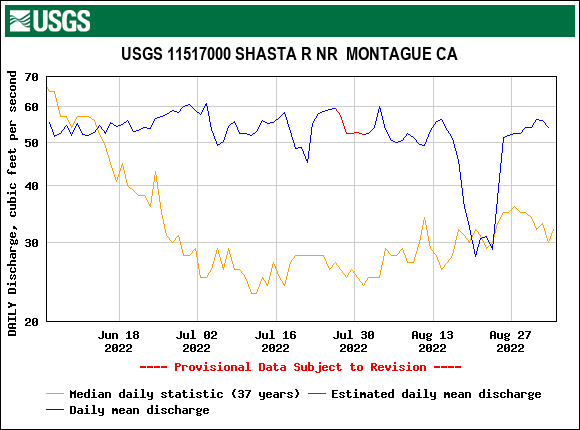
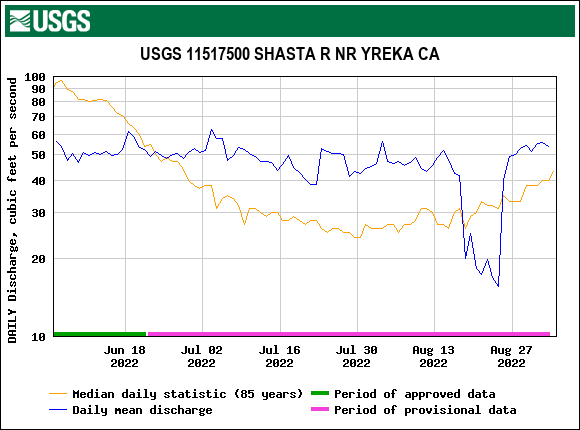
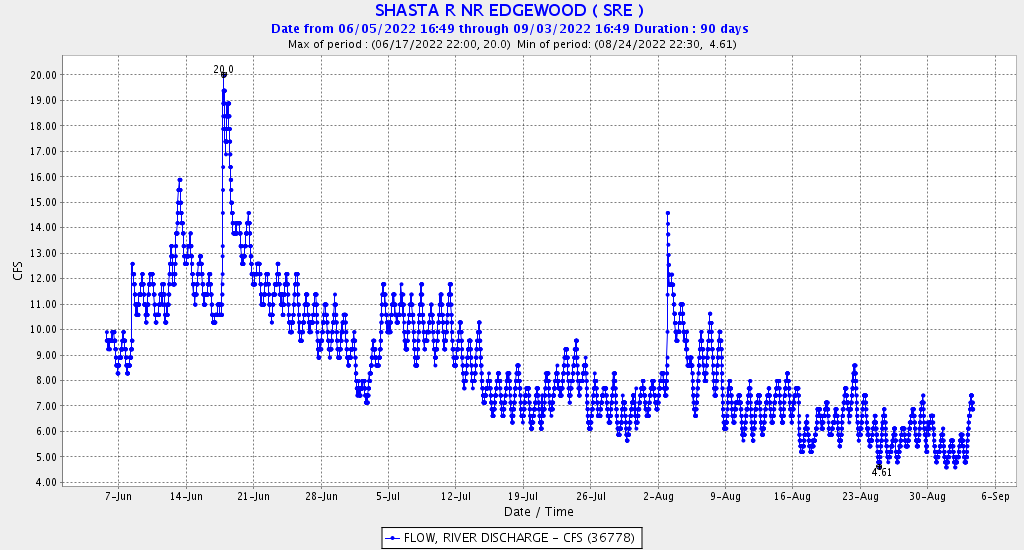
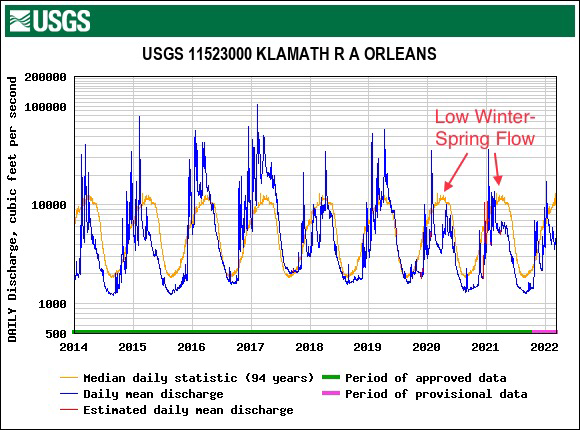
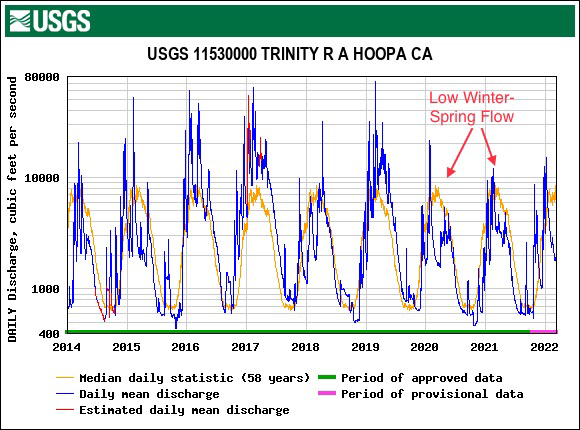
Figure 3. Source: USGS.
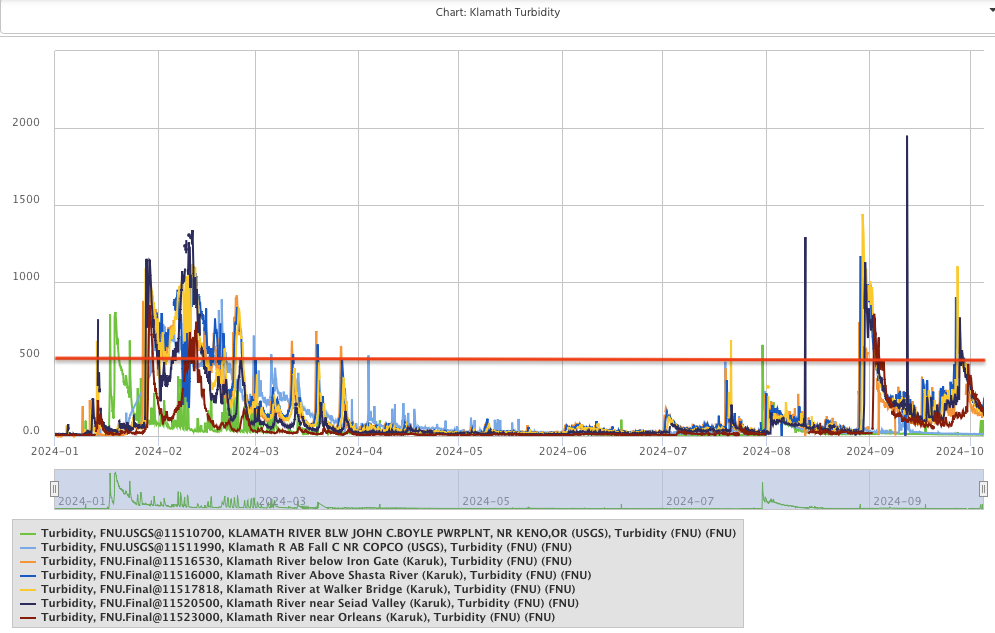
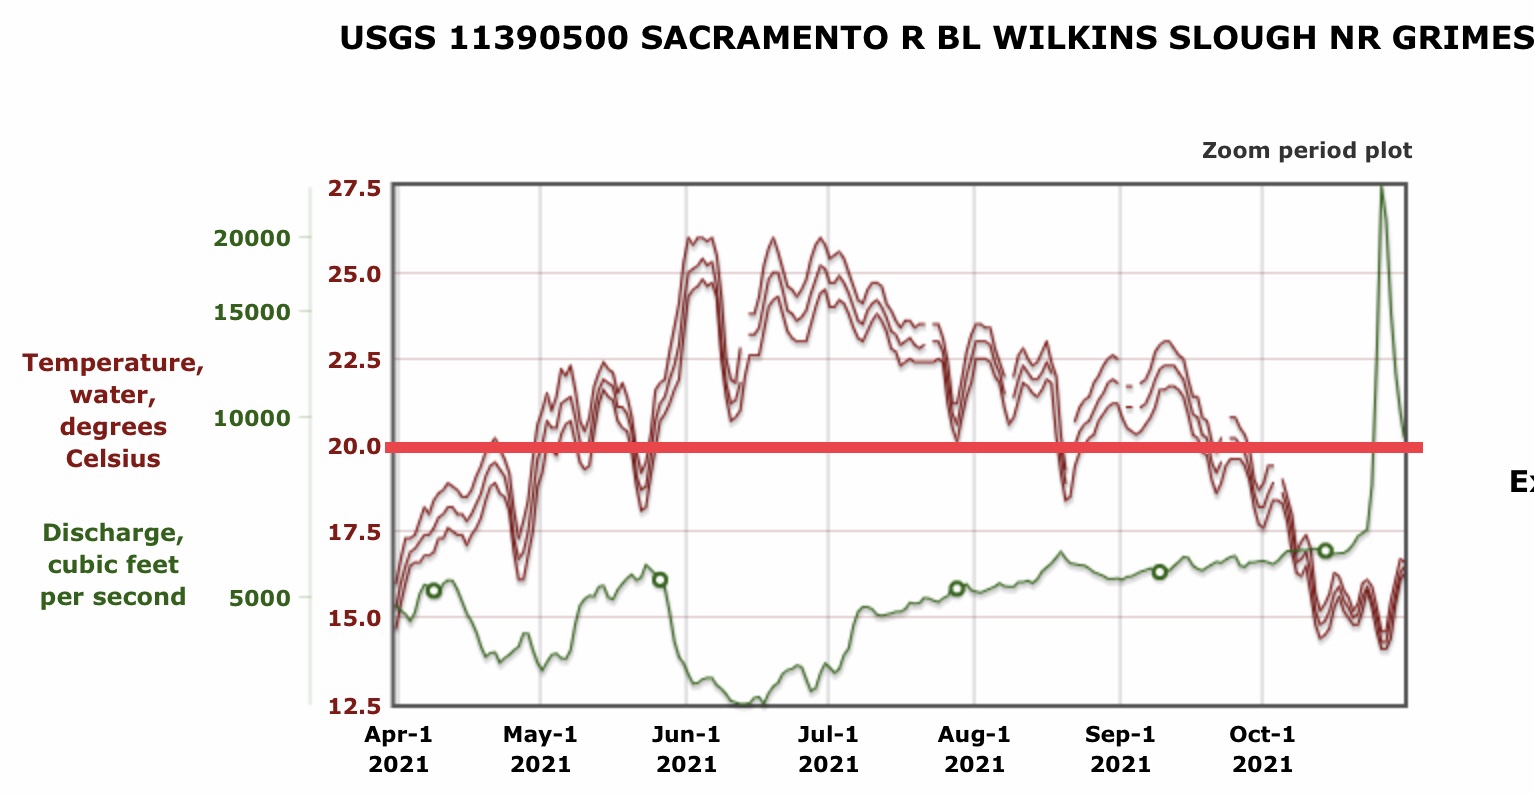
Figure 4. Water turbidity in Middle Klamath from Iron Gate Dam to Orleans in 2024. Source: Karuk Tribe. Author added the red stress line based on coho salmon science literature.
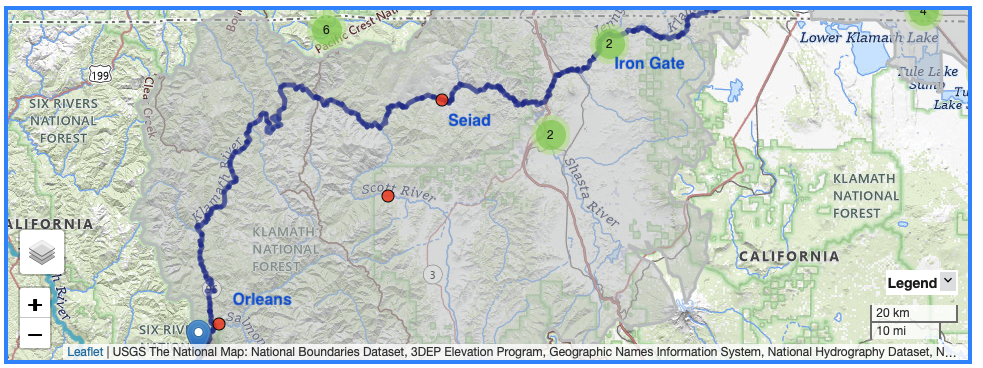
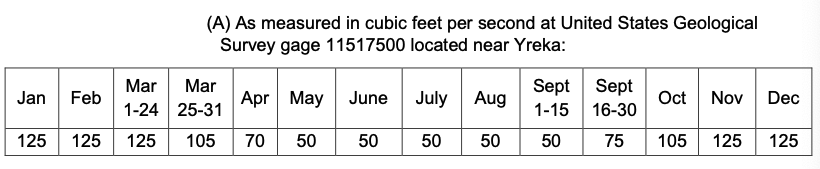
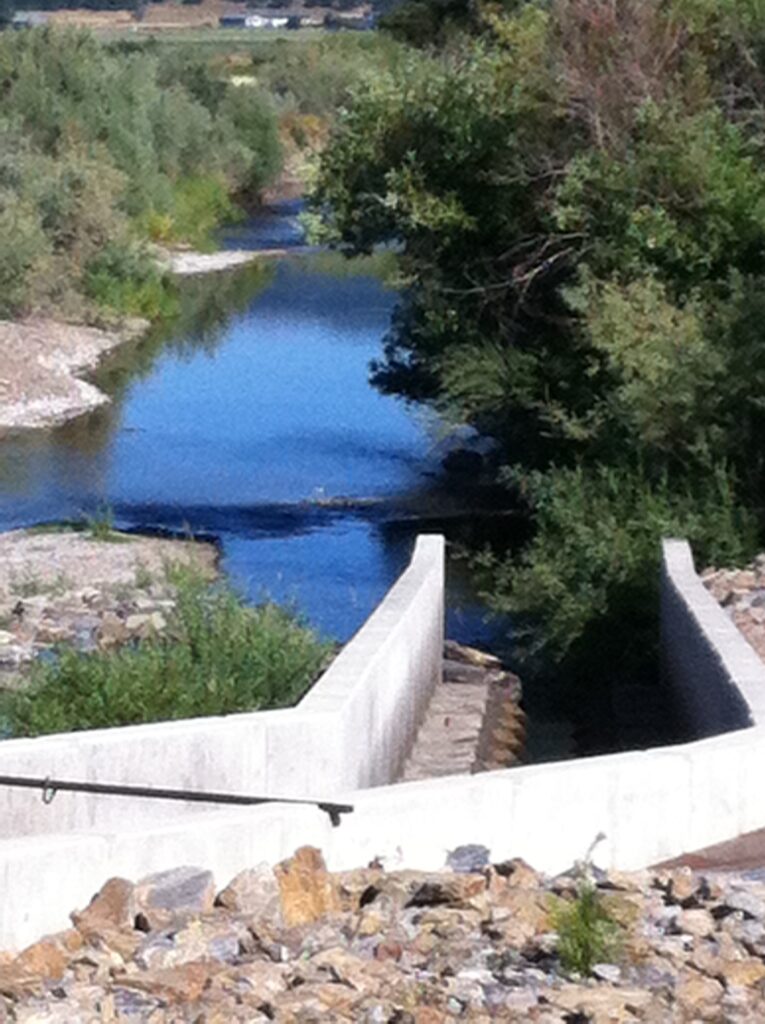
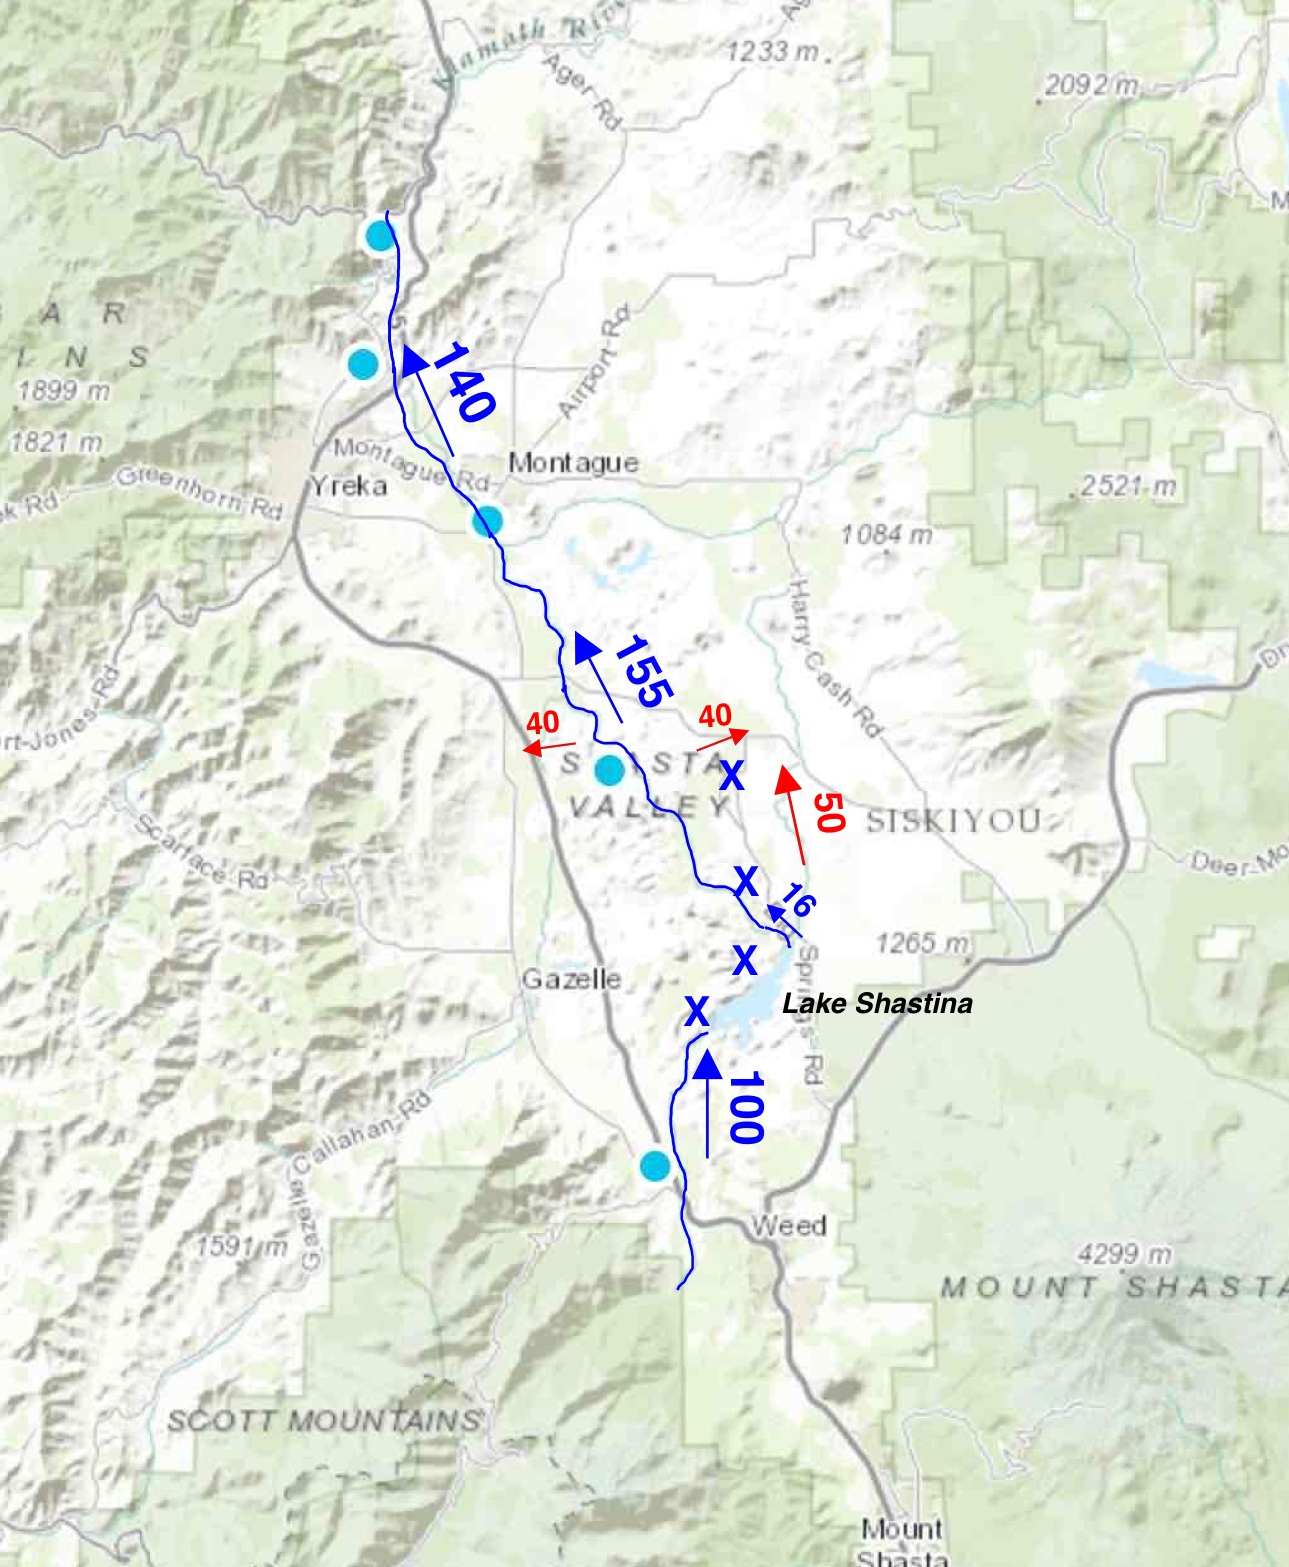
Figure 5. Source: USGS gaging station map. The Salmon, Scott, and Shasta rivers are the main Klamath salmon spawning tributaries below Iron Gate Dam, the lowermost impassable dam removed in 2024.
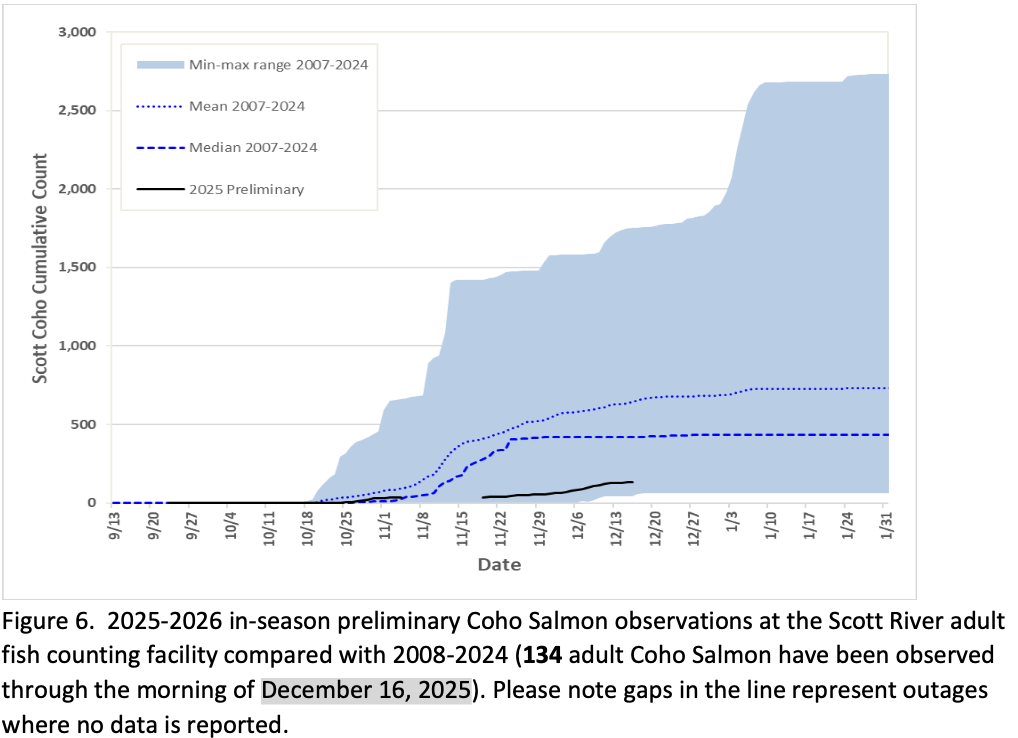
Figure 6. Source: CDFW.
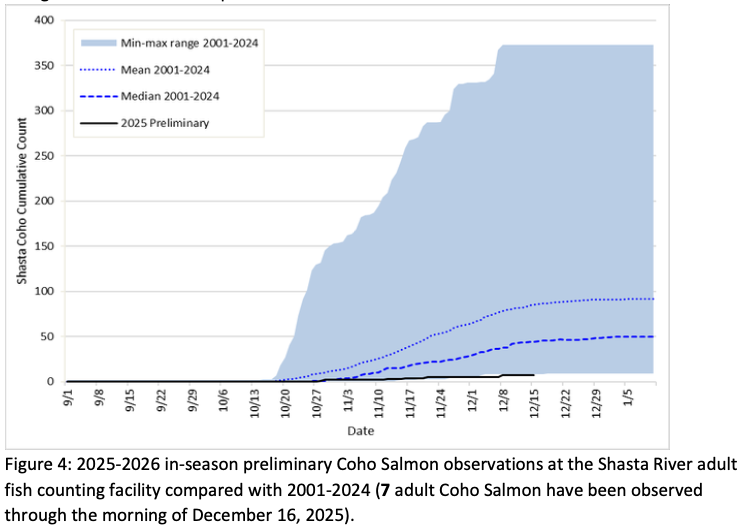
Figure 7. Source: CDFW.
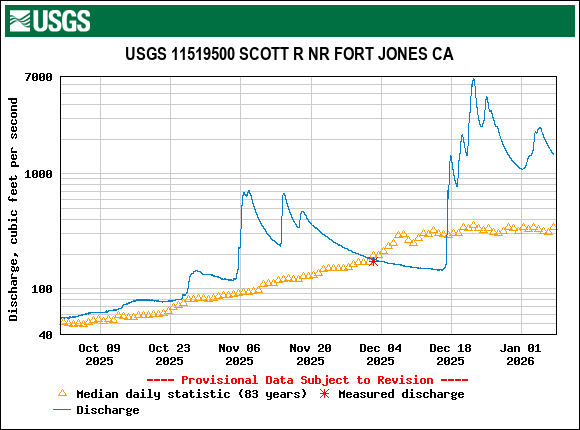
Figure 8. Source: USGS.
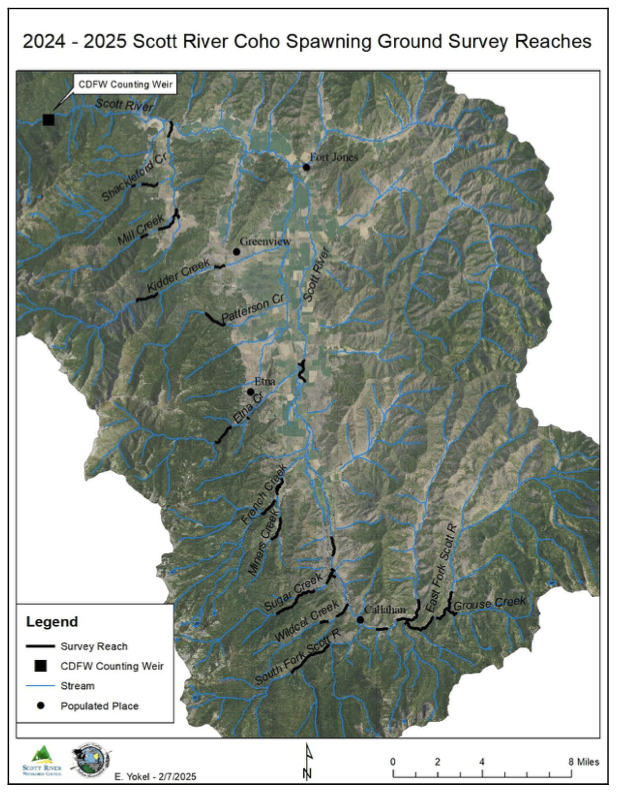
Figure 9. Source: Scott River Watershed Council.
Appendix: National Marine Fisheries Service’s 2021 Summary of Potential Dam Removal Effects:
The primary effects of dam removal on Klamath salmon were disruption of habitat conditions in 2024 affecting various life stages of Chinook and Coho salmon and steelhead brood years 2020-2024. The following are excerpts from the National Marine Fisheries 2021 Biological Opinion on the Klamath Dam Removal Project potential effects on coho salmon.
- Food resources for coho salmon are expected to be impacted during drawdown due to elevated SSCs as described in Section 2.5.1.2.3. Food resources may be impacted downstream as far as Orleans (about 134 miles downstream of Iron Gate) (FERC 2021a), affecting juvenile coho salmon from the Upper Klamath, Shasta, Scott, and Mid-Klamath populations. Only juveniles that rear in the mainstem during the winter or utilize the mainstem during outmigration in the spring may be exposed to conditions with fewer prey sources.
- In a summary of literature reporting effects of suspended sediment on salmonids, Lloyd (1987) reports several studies that document stress at 300 mg/L (McLeay et al. 1984) and 50 mg/L (McLeay et al. 1987). Redding et al. (1987) found that juvenile coho salmon showed signs ofstress at high levels of suspended sediment (2000-3000 mg/L), but not at low levels (400 to 600 mg/L). Servizi and Martens (1991) found that at 18°C, 8100 mg/L was the concentration where50 percent of the exposed coho salmon juveniles died.
- Behavioral effects resulting from elevated suspended sediment include alarm reactions, avoidance, and reduced feeding. Cederholm and Reid (1987) found that juvenile coho salmon prefer low to medium concentrations of suspended sediment, and that juvenile coho salmon prey capture success significantly declined at concentrations of 100 to 400 mg/l. Salmonids have been observed to prefer clear over turbid water (Bisson and Bilby 1982), and move vertically near the water surface (Servizi and Martens 1992) and/or downstream to avoid turbid areas (McLeay et al. 1984; McLeay et al. 1987). More than six weeks of exposure to concentrations of 100 mg/L reduces feeding success, reduces growth, causes avoidance, and displaces individuals (Spence et al. 1996).
- All populations of coho salmon in the Klamath Basin have the potential to be exposed to elevated SSC during project implementation. All populations use the mainstem Klamath River as a migratory corridor during both the adult life stage and outmigrating smolt life stage. Additionally, some juvenile (i.e., young-of-year, subyearling, yearling) individuals from each population will use the mainstem for over-summer and over-winter rearing, although the proportion of populations using the mainstem for rearing varies.
- Juveniles may rear in the mainstem throughout the year, and consist of sub-yearlings (0+) and yearlings (1+). Juvenile coho salmon have been observed residing within the mainstem Klamath River downstream of Iron Gate Dam throughout the summer and early fall in thermal refugia during periods of high ambient water temperatures (>22 °C). Sub-yearling juveniles may be present in the mainstem from the time they leave the tributaries to the following winter. However, most juveniles from the tributaries are assumed to rear in the tributaries. A small number of sub-yearling juveniles that successfully emerged from mainstem redds will be present in the mainstem until they redistribute in the fall. The Renewal Corporation modeled suspended sediment concentrations associated with reservoir drawdown using trap data, run timing, and location information to estimate exposure and potential risk to rearing 0+, rearing 1+, and outmigrating 1+ smolt coho salmon (Appendix H of FERC 2021a). Because coho salmon have complex life history strategies, we cannot predict with certainty the timing of exposure. Spring and seasonal redistribution of 0+ juveniles and outmigration is timed based on a variety of environmental cues. For example, the outmigration period may start in February and last into June. However, no individual fish spends that entire period of time in the mainstem.
- Coho salmon smolts (1+ yearlings) are expected to migrate to the ocean beginning in late February, although most natural origin smolts outmigrate to the mainstem Klamath during April and May (Wallace 2003). Courter et al. (2008), using USFWS and CDFG migrant trapping data from 1997 to 2006 in tributaries upstream of and including Seiad Creek (e.g., Horse Creek, Seiad Creek, Shasta River, and Scott River), reported that 44 percent of coho salmon smolts were trapped from February 15 to March 31, and 56 percent from April 1 through the end of June.