Water temperatures are reaching lethal levels (22oC) for the newly spawned sturgeon eggs and fry in the lower Sacramento River. To save this broodyear of sturgeon, resource managers must immediately increase flows in the lower Sacramento River. Right now, those flows are unusually low.
The San Francisco Bay-Delta watershed is home to two native sturgeon species: white sturgeon and green sturgeon. White sturgeon are popular among sport fishers in major rivers and the Bay-Delta. Green sturgeon are less common and are protected under state and federal endangered species laws, making their harvest illegal.
Both species migrate from the ocean or Bay into rivers to spawn—a behavior known as anadromy. Green sturgeon tend to spend more time in marine environments and travel further upstream to reproduce. White sturgeon are larger and sought after by anglers. Both types feed along river and bay bottoms, often attracted by bait that has a strong scent. The introduction of non-native clams has given sturgeon an abundant food source, potentially boosting their growth. However, they are sensitive to warm water and thrive best in cooler, saltier environments below 68°F (20°C).
Spawning poses significant challenges for sturgeon. They use stored energy in late winter and spring to reach clean, cool, fast-flowing rivers with deep, rocky bottoms where they lay sticky eggs. After several days, these eggs hatch. The young fry drift down to the Delta and Bay over about a month, feeding and growing along the way. Their survival depends on river conditions—low flow and warm water can be fatal in dry years. During wetter years, strong currents help them safely reach the Bay.
Once in the Bay, sturgeon can take 10 to 15 years to mature before returning upstream to spawn. Unlike salmon, sturgeon live long lives and can reproduce multiple times.
The frequency of wet years and the quality of Bay conditions both affect how many adult sturgeon persist in the population. Recently, recreational fishing has removed about 5–10% of adults annually. Droughts pose bigger risks—especially to white sturgeon—by warming Bay waters and encouraging algae blooms that deplete oxygen, sometimes causing mass die-offs during the summer.
Measures needed to support sustainable sturgeon populations amidst climate change include maintaining adequate river flows and suitable water temperatures in the Sacramento River, Delta, and Bay. This is especially important during spring and early-summer spawning and rearing periods.
Under current water management, most young sturgeon fail to survive the Delta due to poor flows, high temperatures, predation, and entrainment into water diversions. Summer is a critical season in the Bay, where most sturgeon reside, and healthy conditions are vital. Some years, large tides associated with Super Moons bring warm water into the Bay, triggering harmful algal blooms. Consistent freshwater inflow is necessary to support the food web and keep the Bay cool and oxygenated.
During consecutive dry years, population maintenance involves options like hatchery releases, rescuing stranded sturgeon, and stricter controls on fishing. The top priorities should be protecting breeding adults over 15 years old, ensuring adequate recruitment of younger subadults, and improving the survival of eggs and juveniles. Achieving these goals requires enhanced scientific monitoring and assessment of both the fish and their habitats, as is commonly recommended for other native fish like salmon and steelhead.
The current status of sturgeon is less well documented than other species like salmon, steelhead, smelt, and striped bass. Unlike others, there is no formal recovery plan for sturgeon. There are increasing calls to end the sport fishery and list white sturgeon as endangered. However, some scientists and resource managers argue that more pressing threats should be addressed first, and recommend focusing on gathering data from the fishery and data on population abundance.
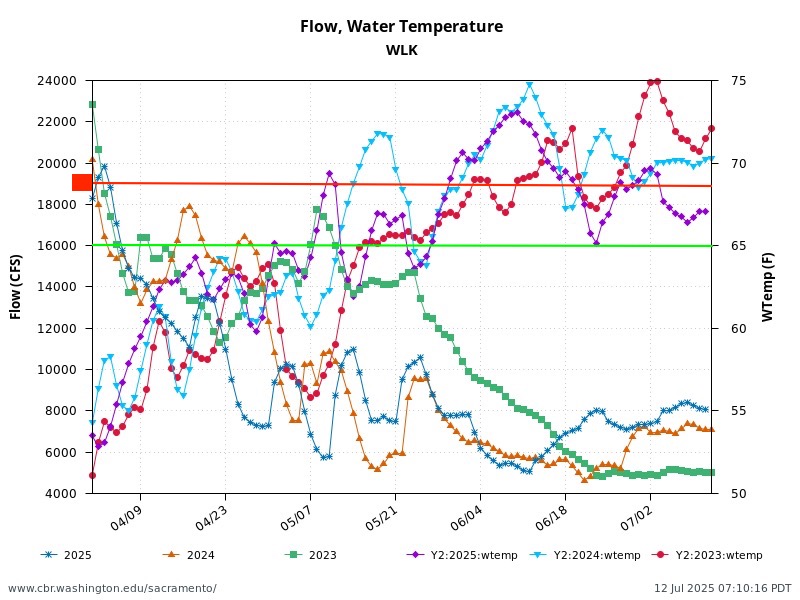
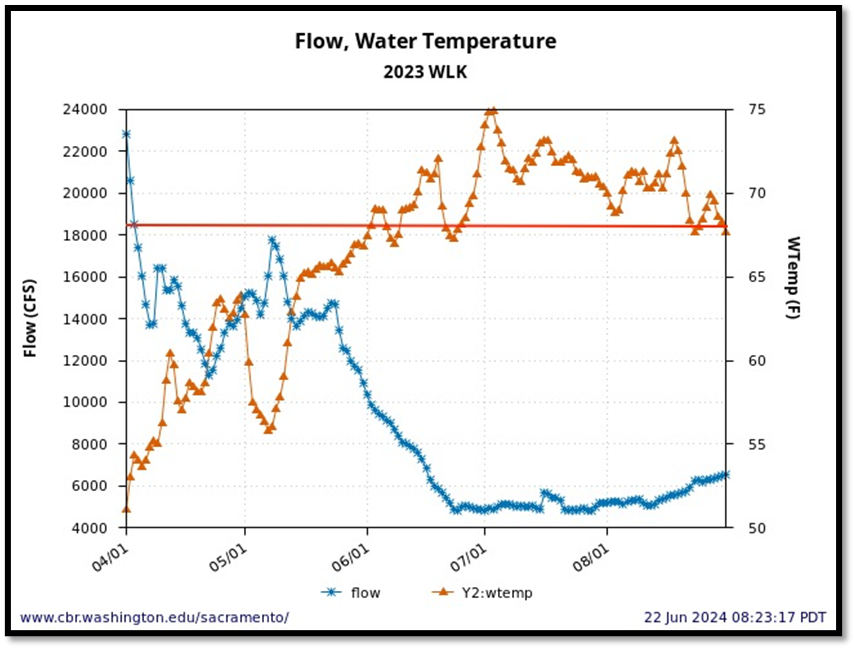
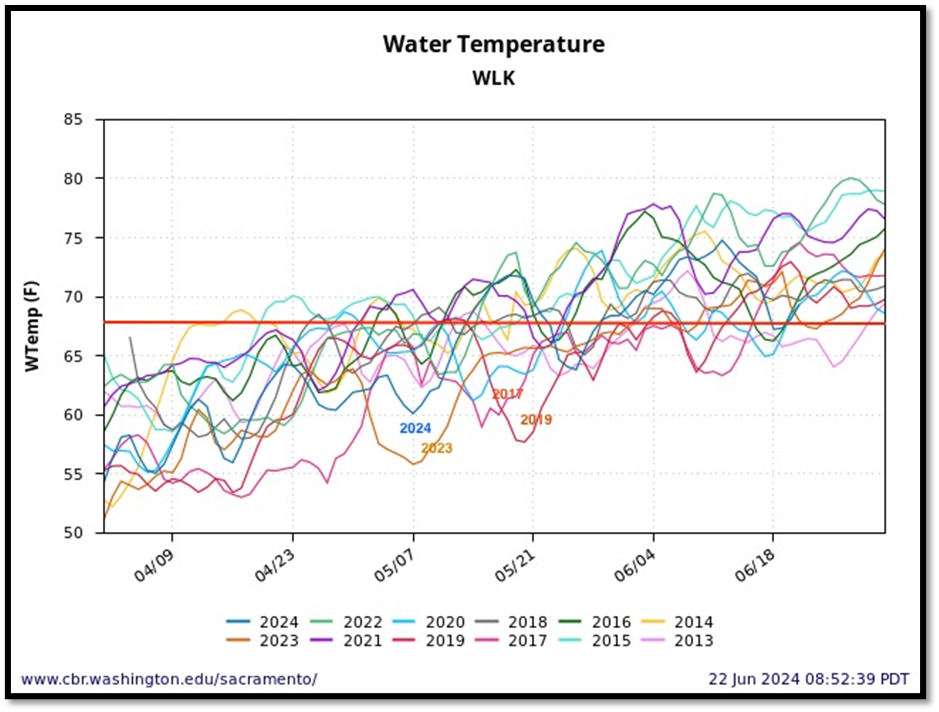
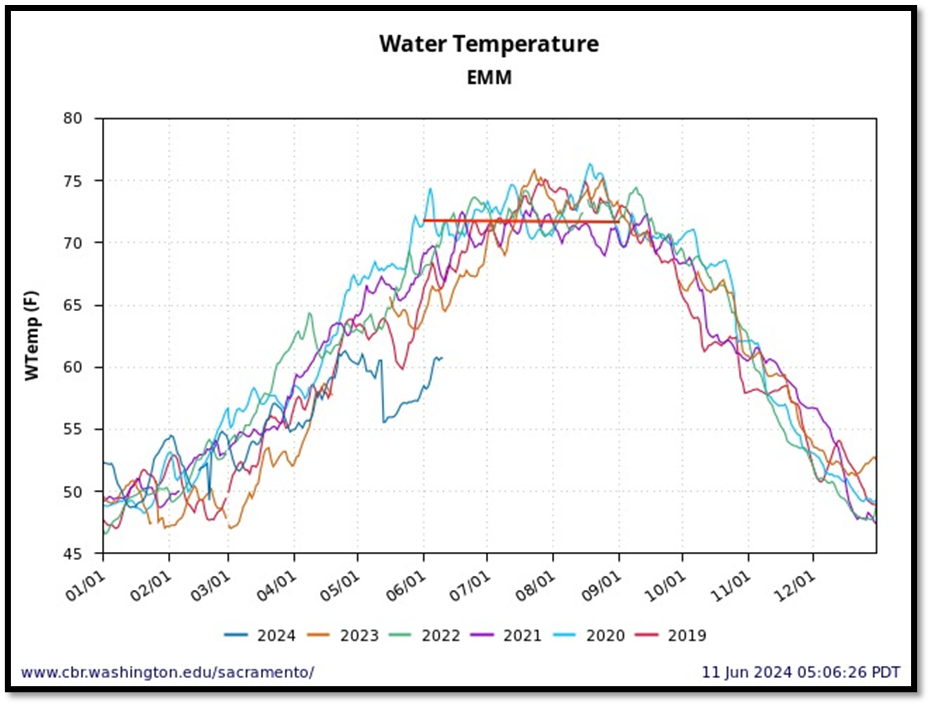
In my last post on the sturgeon (February 2026), I hypothesized that the big reason for the unsuccessful sturgeon reproduction in water years 2024 and 2025 was poor conditions in the spring spawning and early rearing reach of the middle Sacramento River. Water temperatures were above optimal (>65oF) and at times stressful (>68 oF) or even lethal (>72 oF) in spring 2024 and 2025. Few juvenile sturgeon survive to reach the Delta under these habitat conditions. This was one of the factors that led the State Water Board and USEPA to set 68 oF as the water quality standard for the Sacramento River two decades ago. This standard is also a condition of the State Water Board water right permits for the state and federal water projects.
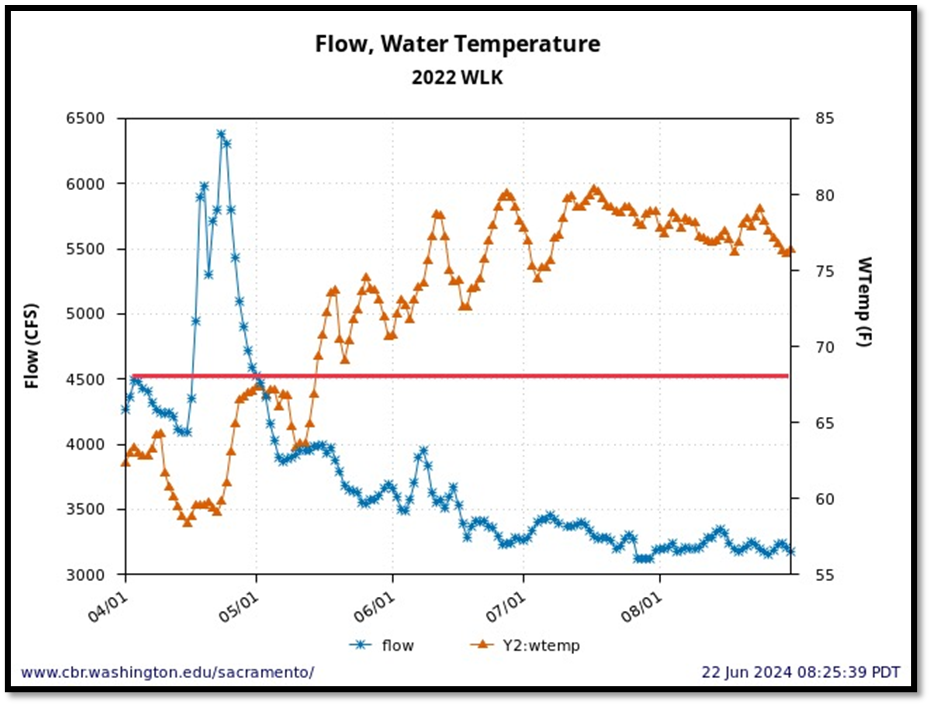
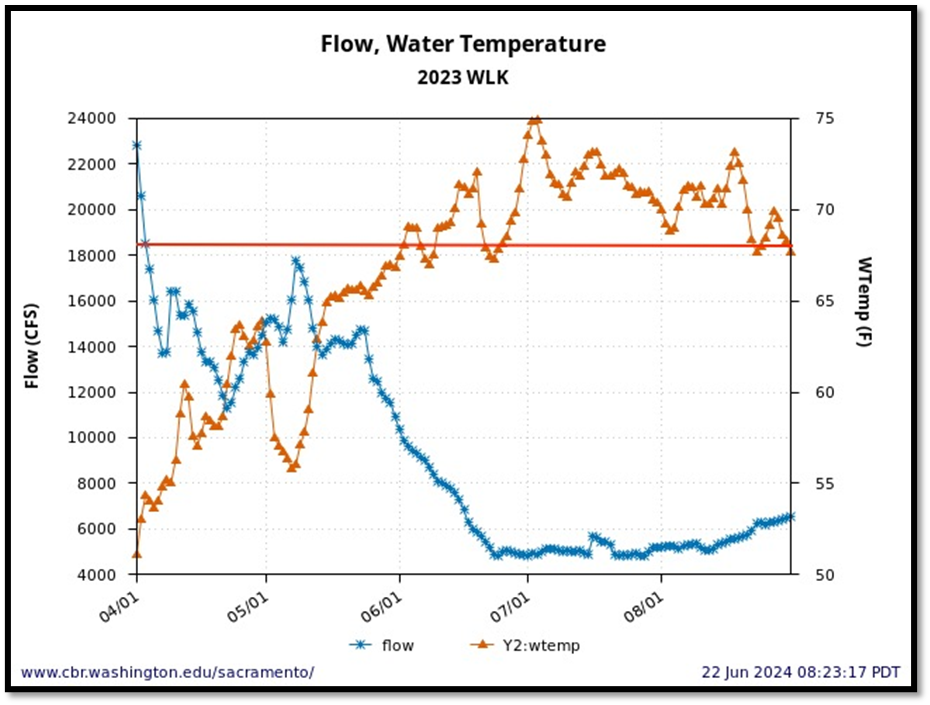
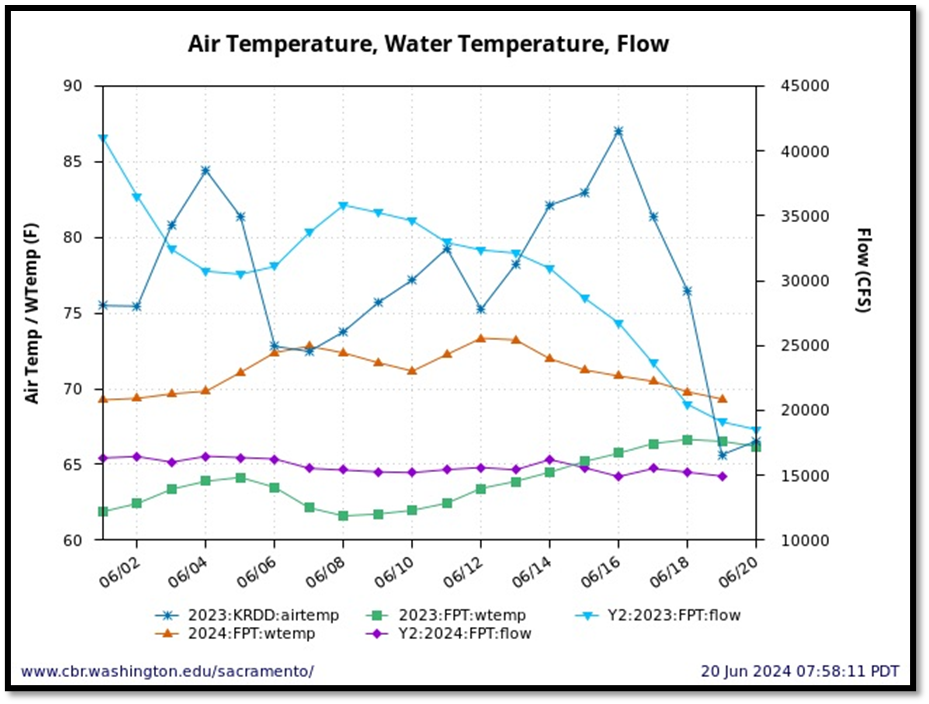
Once again, during a relatively wet winter-spring, both the sturgeon and the water quality standard seem to be overlooked (see Figure 1).
To save this broodyear of sturgeon, resource managers must immediately increase flows in the lower Sacramento River. Right now, those flows are unusually low.
For more on white sturgeon science, monitoring, and fisheries management see https://wildlife.ca.gov/Conservation/Fishes/Sturgeon/White-Sturgeon.
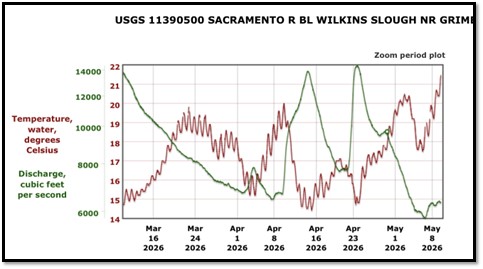
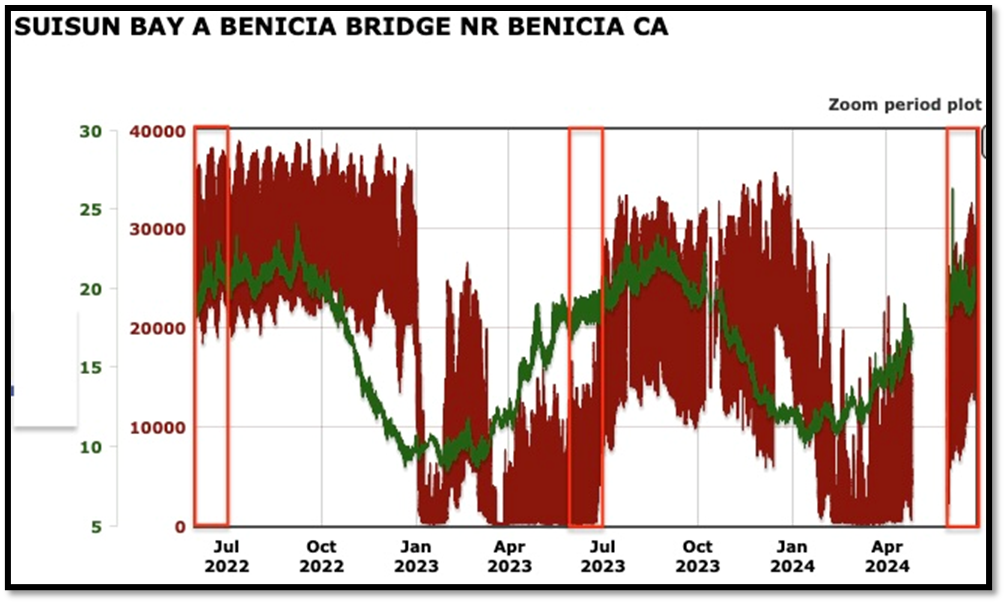
Figure 1. Sacramento River streamflow and water temperature at Wilkins Slough in the lower prime spawning reach of white sturgeon in spring 2026.