
In prior posts in December 2022 and November 2021, I described the status of listed delta smelt and of longfin smelt. More recent information shows little change in the dire outlook for these two native Bay-Delta fish (Figures 1-4).
Delta smelt and longfin smelt populations have declined severely over the past few decades due to poor water management. In the Bay-Delta, where the smelt spend most of their lives, south Delta water exports and warming of the Bay and Delta from reduced inflow and outflow has limited their production. Temporary urgency change petitions (TUCPs) during multiyear droughts and subsequent orders by the State Water Board have allowed reduced Delta outflow, leading to higher water temperatures and increased Delta salinity. The State Board is again considering yet another TUCP in winter 2023 that would reduce Delta outflow to allow higher exports.
In this winter 2023, the Low Salinity Zone has again moved further upstream (eastward) into the Delta because of falling freshwater inflow to the Delta after the January storms. Delta exports have fallen with lower Delta inflows as State Board conditions kick in. The TUCPs are an obvious and direct threat to these population remnants living in the Low Salinity Zone. Further allowing these weakened standards to be violated is a direct disregard for these nearly extinct species. Water management places them at extraordinary risk by (1) bringing them further into the Central-Delta zone of the two large South-Delta water diversions, (2) degrading smelt habitat with lethal water temperature, (3) further degrading their already depleted food supply, and (4) increasing the concentrations of toxic chemicals being relentlessly discharged into the Delta.
The scientific literature, and water and resource management agencies, all recognize these major problems. Many management and recovery schemes have been developed and implemented over the decades. However, nothing has stopped water managers’ relentless excessive use and abuse of the Central Valley hydrology. The salmon, smelt, sturgeon, and steelhead are not just the victims but serve as “canaries in a coal mine”, all dying while the water is continually mined from the system. Meanwhile, water managers blamed this mass extinction event on on climate change, cynically gaming worsening conditions to extract even more water.
There is more and more talk of employing “ecosystem-based management” that integrates the environment into all phases of decision-making, effectively giving the environment a seat at the table. But the reality is more like giving the chickens a say in how the foxes manage the depopulation of the hen-house. There is also talk about providing more flexibility in how and when water is used – allocating environmental water as “functional flows” or “environmental water storage” to optimize the ecosystem benefits of what little water is allocated for the environment. Placed in he hands of water managers, such efforts simply give them more flexibility to game the system to their advantage. When they think they can get more water, they just ask for it and usually get it. One policy group proposes: “Making this work may require establishing assets for the environment—such as water budgets, reservoir storage space, and funding to restore physical habitat—that can be flexibly used to adapt to changing conditions.” No, a piece of bread and a cup of water on the survivors’ deathbeds are all they get. Even the water managers get to choose the physical habitat and how its restored, and how much extra water they can take as a result.
It is time to change this pattern of abuse of public trust resources by standing up to abusers in the State’s TUCPs, the Update of the Bay-Delta Water Quality Control Plan, and the public review of the Delta Tunnel Project. The Tunnel simply adds another straw in the Delta, but further upstream, closer to the mouths of the Feather and American rivers, the main sources of Bay-Delta freshwater inflow.
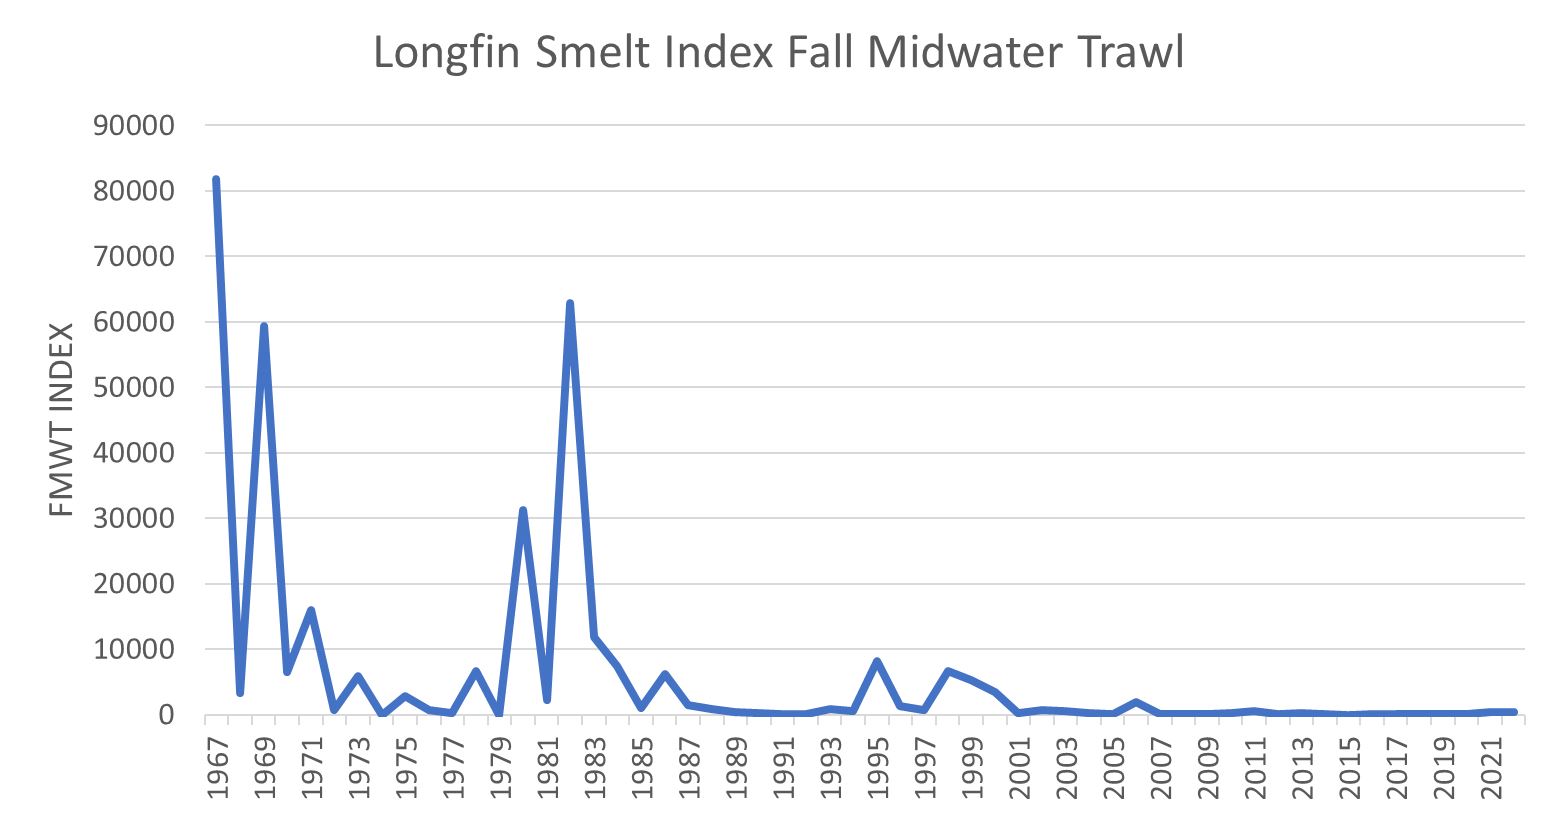
Figure 1. Bay-Delta fall-midwater-trawl longfin smelt catch index 1967-2022.
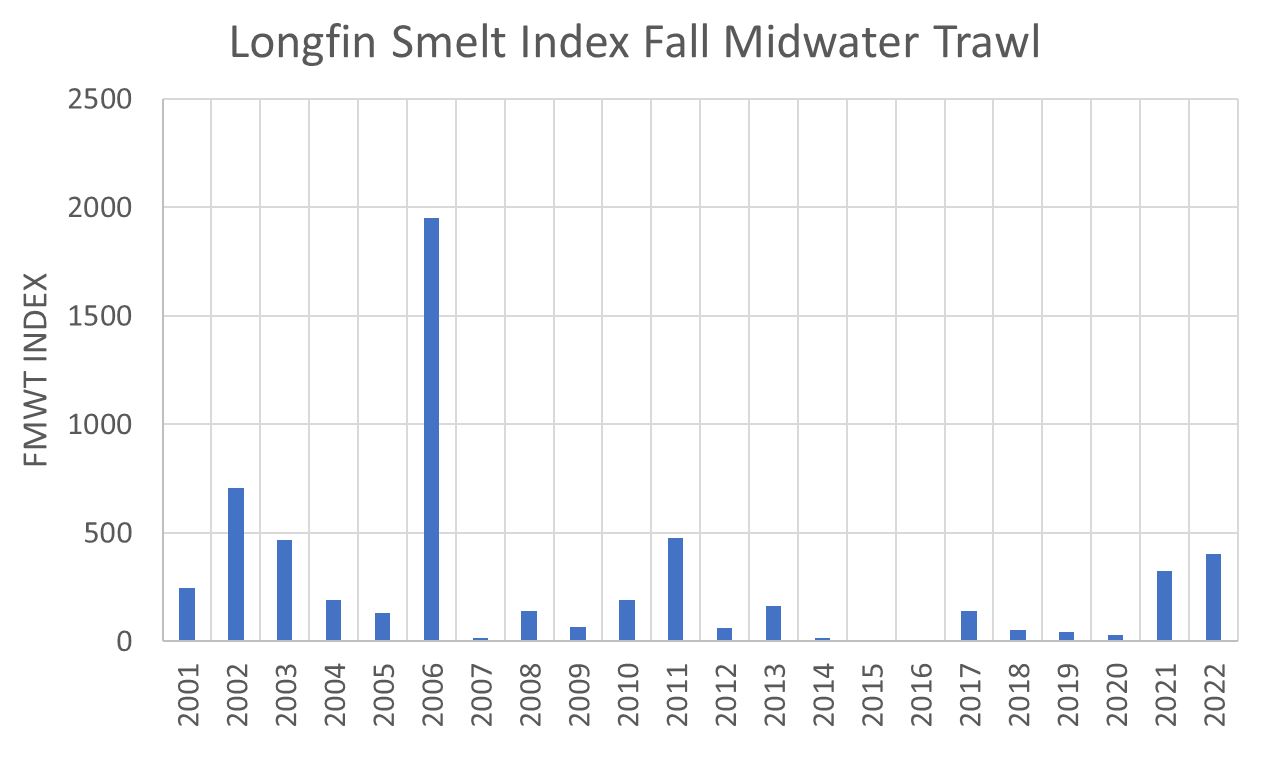
Figure 2. Longfin Smelt Fall Midwater Trawl Index in recent two decades 2001-2022.
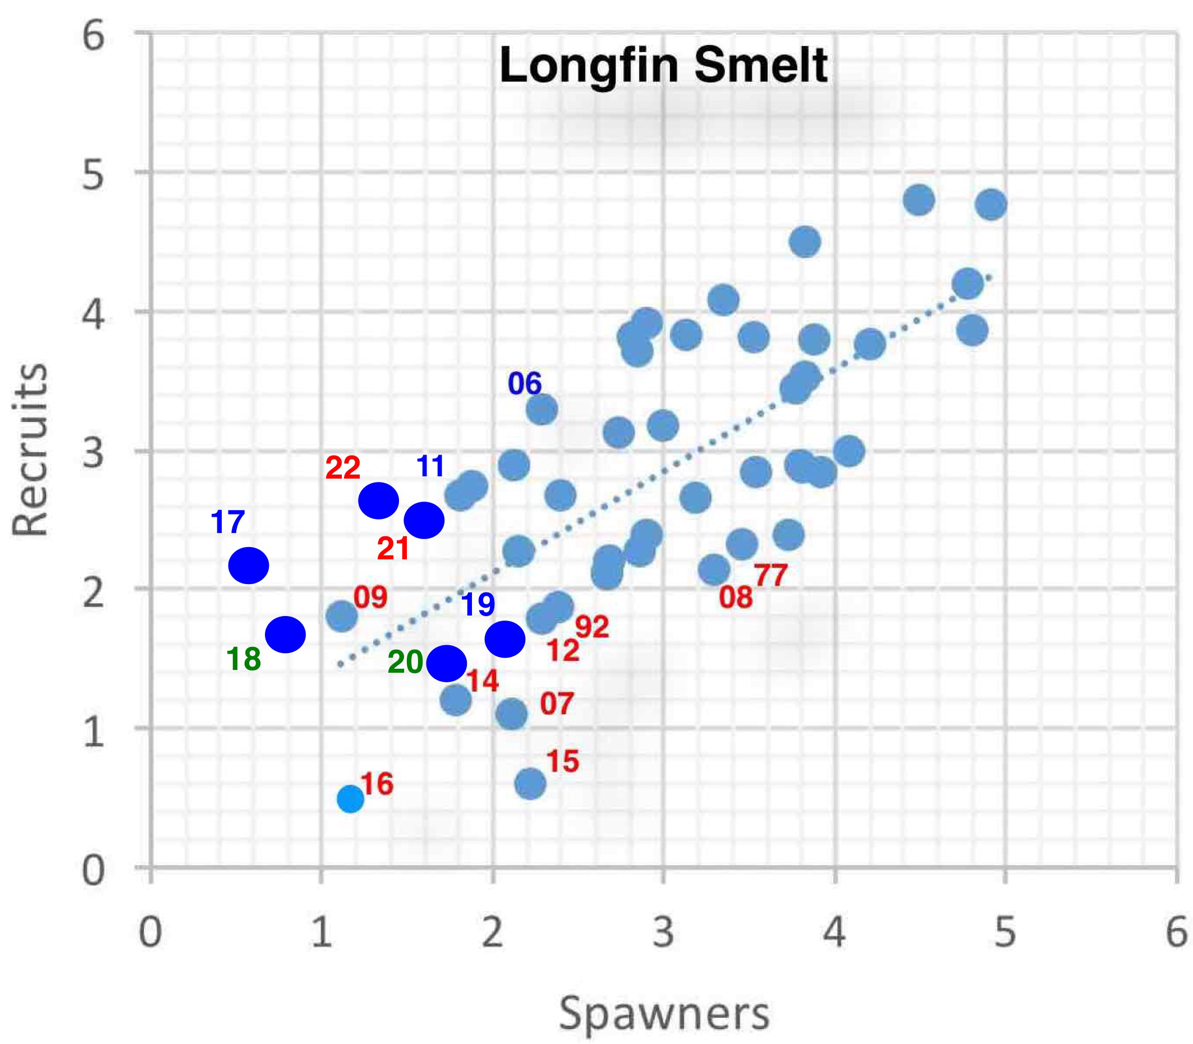
Figure 3. Log-Log relationship for longfin smelt index year (number shown are brood year “recruits”) vs index two years prior (spawners). Red numbers represent brood years that were the product of dry water years, green numbers = normal water years, and blue = wet water years. Blue dots are six most recent years, 2017-2022: fewer spawners produce fewer recruits.
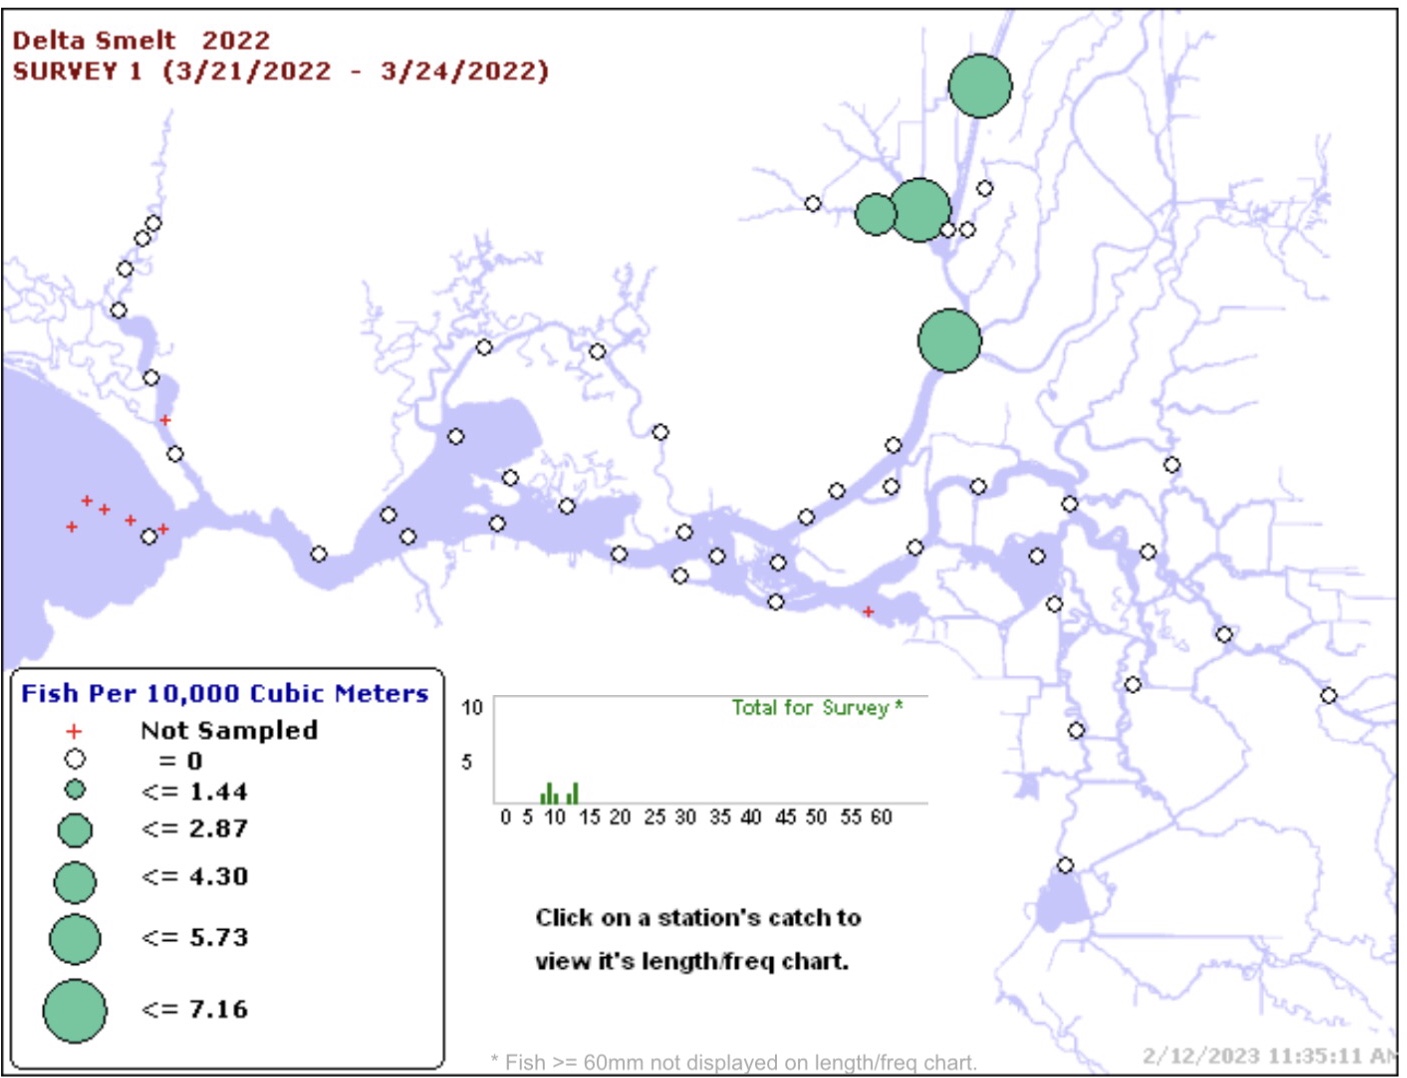
Figure 4. Catch of Delta smelt in 20-mm Survey in late March 2022. Seven were captured in the north Delta just upstream of where adult hatchery smelt were released in December 2021.