Reclamation is misleading on raising Shasta

A September 2018 Bureau of Reclamation “fact sheet” on raising Shasta Dam is misleading.

Enlarging the reservoir will provide an additional 630,000 acre-feet of stored water for the environment and for water users.

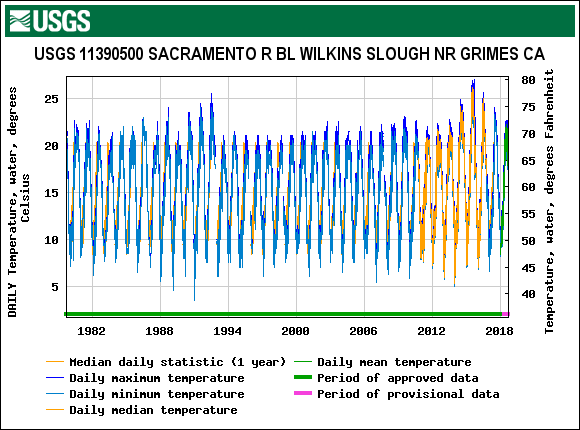
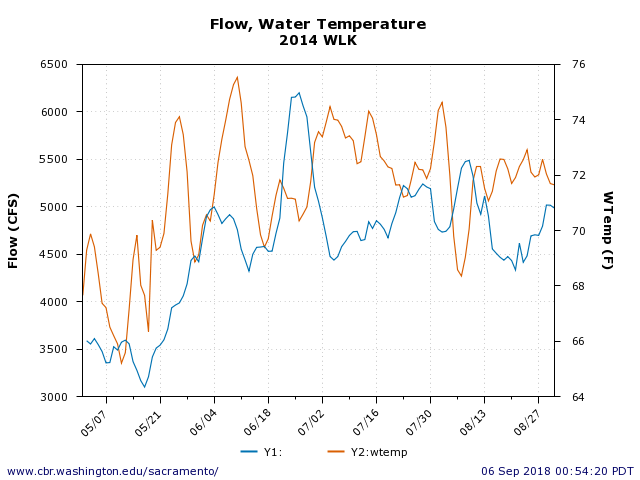
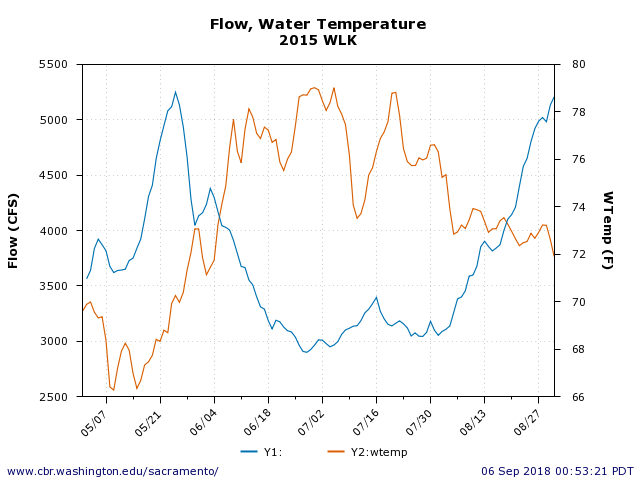
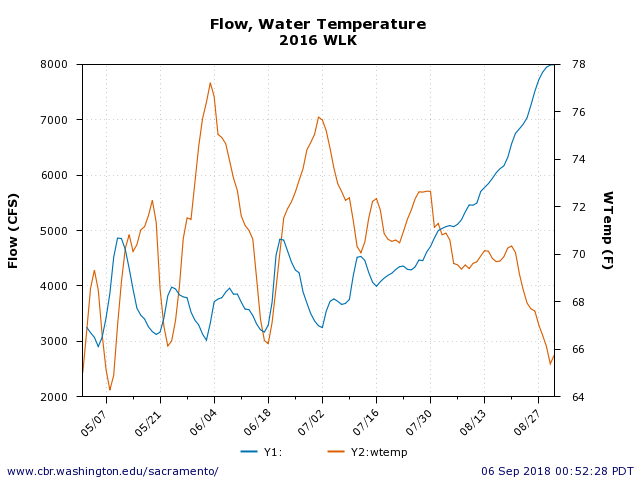
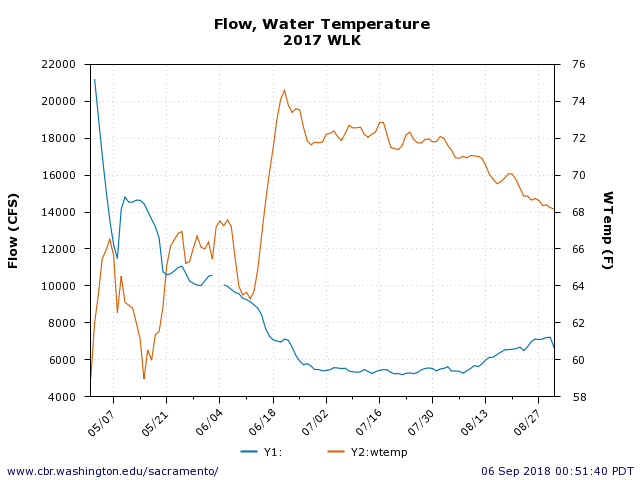
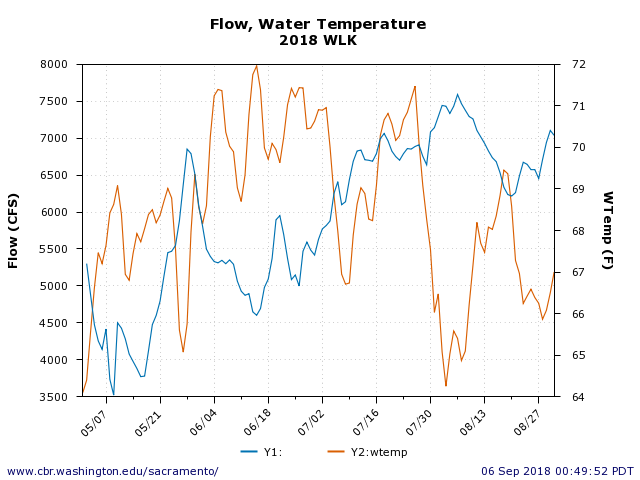
Comment: Additional storage would have been accomplished in only two years of the last decade (Figure 1). There would have been no additional cold-water pool volume in critical years 2013-2015, when the loss of cold water was a problem (Figure 2). Water users already had 100% allocations in the years in which raising Shasta would have added storage. Water allocations would likely increase in some dry years following wet years, offsetting any prospective environmental benefit by drawing down storage.

Enlarging the reservoir will improve water supply reliability for agricultural, municipal and industrial, and environmental uses; reduce flood damage; and improve water temperatures and water quality in the Sacramento River below the dam for anadromous fish survival.

Comment: there would have been no flood benefits in the past decade. Critical-year water temperatures from 2013-2015 would not have changed. Sacramento River water quality suffers the most in critical drought years. This would not benefit from raising Shasta.

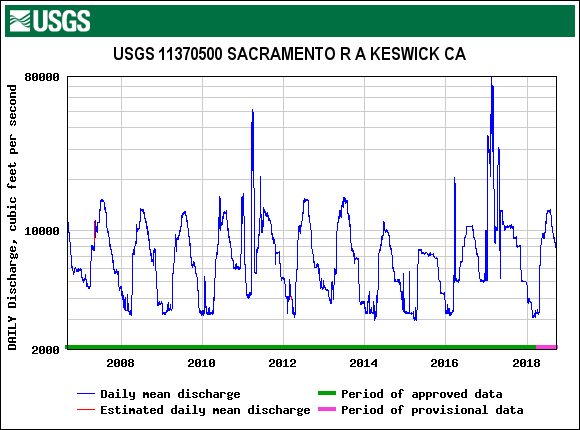
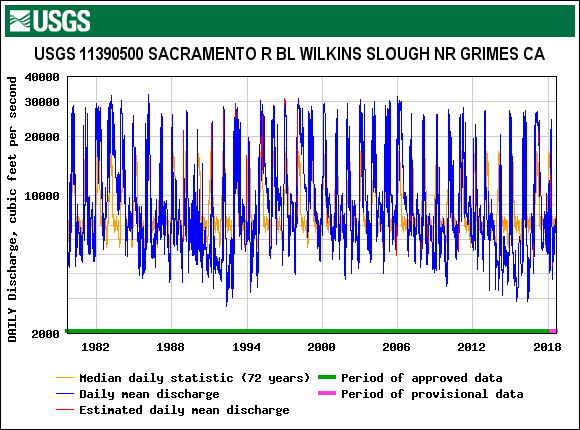
Figure 1. Daily average flows from Keswick Reservoir over past decade. Raised Shasta would only accommodate added storage in wet year spill events in water years 2011 and 2017.

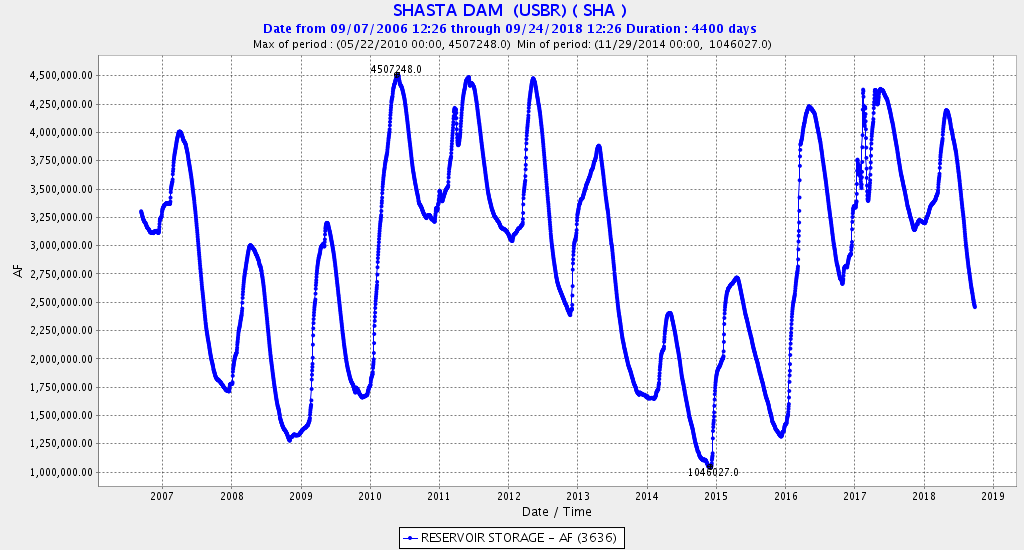
Figure 2. Shasta storage volume over past decade. Maximum existing storage is 4,552,000 AF.

Lower Sacramento River Water Temperatures A 5-Year Adaptive Management Study of Lower Sacramento Summer Flows and Water Temperatures

Nearly three decades ago, state and federal regulators made prescriptions that required the maintenance of water temperatures in the lower Sacramento River below 68oF (20oC) in summer to protect salmon, sturgeon, steelhead, and water quality. The condition was put in water right permits, anadromous fish restoration plans, and in the state’s water quality plan for the basin. Summer is the season when once-abundant spring, fall, and winter run salmon ran up the river and to tributaries to spawn. It is also the rearing season for spring-spawning sturgeon, striped bass, American shad, splittail, and trout, all once abundant in the lower Sacramento River watershed.

The effect of how the prescription was administered in the early 1990’s can be seen in water temperature record for Wilkins Slough in the lower Sacramento River near Grimes (Figure 1). The gradual erosion in the application of the prescription is also apparent over the past two decades. Lack of enforcement of the prescription by federal and state regulating agencies in the last five years is also apparent even in the recent wetter years following the critical drought years of 2013-2015.

I looked at the last five years, 2014-2018, as an adaptive management study to determine how to maintain the 68oF prescription. Plots of water temperatures and river flow from Wilkins Slough (Figures 2-6) are unequivocal evidence that river flow is the primary driver of summer water temperatures in the lower Sacramento River near Wilkins Slough. Air temperature is a lesser factor in summer because it is nearly always warm. A rise in flow over the summer of 2018 (Figure 6) shows clearly that keeping flows in the 6000-8000 cfs range (depending on air temperature) can maintain water temperature near the 68oF target. Flows in the 3000-5000 cfs range lead to water temperatures of 72oF or higher, which are very detrimental to the dependent fish.

Finally, the gradual decline in summer river flow at Wilkins Slough over the past two decades (Figure 7) matches the rise in summer temperatures (Figure 1). It is not a question of changing water quality standards to protect fish. It is simply a question of enforcing the existing standards and water right permit requirements. Increasing Shasta Reservoir releases, limiting water diversions, or some combination thereof, could provide the necessary flows.

Figure 1. Water temperatures recorded at Wilkins Slough in the lower Sacramento River from 1980 to 2018.

Figure 2. Water temperature and river flow at Wilkins Slough May-August 2014.

Figure 3. Water temperature and river flow at Wilkins Slough May-August 2015.

Figure 4. Water temperature and river flow at Wilkins Slough May-August 2016.

Figure 5. Water temperature and river flow at Wilkins Slough May-August 2017.

Figure 6. Water temperature and river flow at Wilkins Slough May-August 2018.

Figure 7. River flow recorded at Wilkins Slough in the lower Sacramento River from 1980 to 2018.

The Future Potential of San Joaquin River Salmon

In an August 21 blog post, Dr. Peter Moyle described recent Delta fish science and the future of San Joaquin River salmon.  Dr. Moyle summarized five papers with relevance to the Central Valley.  Below, I comment on the discussion on the San Joaquin smolt salmon tagging study.

The first bullet point in Dr. Moyle’s blog post reads:  “Flows do not improve San Joaquin salmon survival but salvage does.”  He then makes observations, shown below in italics.

  •  “The study nevertheless shows that juvenile Chinook from the San Joaquin region are not surviving passage through the south Delta and that increased flows are not likely to increase their survival.” Comment: It is generally true that juvenile San Joaquin Chinook are not surviving passage.  However, the conclusion that increased flows are unlikely to increase survival is based on a series of six years with mostly low flows and one wet year, 2011, a year with record exports.  There is no doubt that San Joaquin salmon do better in wetter years.1  The survival of the relatively small number of radio-tagged hatchery smolts in the cited study was low because south Delta exports minimize the ability of smolts to escape the San Joaquin side of the Delta.  Most of the San Joaquin water (and salmon) goes to the export pumps.  Once there, putting the smolts in a taxi to the Bay does obviously help them escape the Delta.  Moyle fails to note that San Joaquin salmon are “ocean type”, meaning they move to the Delta often as fry or fingerlings, and rear in the Bay-Delta before moving to the ocean.  These fry/fingerlings were not included in the study and most certainly benefit from higher winter flows.
  • “Large-scale improvement of habitat in the south and central Delta is likely the key to improved survival, as shown by higher survival rates of fish from the Sacramento River that pass through the north Delta.” Comment:  Yes, if he means flow-habitat improvements by eliminating south Delta exports and improving positive flows.  Physical habitat improvements in the central and south Delta will not help without sufficient winter inflows to carry young salmon downstream to the Delta and to stop misdirected movement toward the export pumps if young salmon reach the Delta.
  • “The basic results showed such low survival of salmon passing through the Delta that returning adults would be too few to sustain the salmon populations in the San Joaquin basin.” Comment:  San Joaquin salmon do well in wet years. 1   Under current water operations in most years, river and Delta survival is low because most of the watershed’s water is diverted, held in reservoirs, or exported from the Delta.
  • The study indicates that the lack of decent habitat for juvenile salmon in the Delta means that most are picked off by predators (as shown in part by tagged fish moving in the wrong direction because the tags are in the stomachs of predators). Comment:  No, these were smolts, not smaller juveniles, and they were trying to find the ocean, not decent habitat.  They had to spend too much time trying to find the escape route from the Delta.  Eventually, they succumbed to a wide range of stressors.
  • “Essentially, fall-run Chinook populations in the San Joaquin basin are being sustained by straying hatchery fish from the Sacramento River system.” Comment:  All Central Valley salmon fall-run salmon populations are sustained directly or indirectly by hatcheries.  The San Joaquin has its own hatcheries whose smolts also benefit from higher flows. 3 While gene flow among the populations has been high, it does not preclude individual populations from developing river/watershed-specific characteristics through natural selection.
  • “How badly do we want to restore self-sustaining salmon runs to the San Joaquin and its tributaries? This question has to be asked in the context of future scenarios of climate change with increasingly variable conditions and likely permanent flooding of Delta islands.” Comment:  Moyle seems to suggest that restoring “self-sustaining” San Joaquin runs may not be worth the effort.  While “self-sustaining” may be very difficult to achieve for all Central Valley salmon populations given all the dams, loss of habitat, and water diversions, a balance of “wild” and hatchery salmon (and dependent fisheries) has been possible and will be so in the future if water resources are shared as required by federal and state laws.

  1. Salmon production is on average ten times better in wetter years. http://calsport.org/fisheriesblog/?p=1518
  2. Salmon production is on average ten times better in wetter years. http://calsport.org/fisheriesblog/?p=1518
  3.  http://calsport.org/fisheriesblog/?p=1403

Delta Smelt Summer 2018

After catching over 800 Delta smelt in 2011 (Figure 1) and near 30 in 2017 (Figure 2), the Summer Townet Survey captured only 3 in 2018 (Figure 3). The pattern is consistent with the spring 20-mm Survey collections

The only option now other than extinction is stocking hatchery smelt in large numbers in their primary summer-fall habitat, the Low Salinity Zone of the Bay-Delta. Release should be near the 2 ppt (3800 EC) location, commonly referred to as X2, which recently has been moving tidally back and forth between Collinsville and Sherman Island in the Sacramento River channel just downstream of the Emmaton gage (Figures 4 and 5). The X2 location has optimum salinity, water temperatures (<70oF), turbidity, and food for Delta smelt.

Figure 1. Summer Townet collections of Delta smelt 2011.

Figure 2. Summer Townet collections of Delta smelt 2017.

Figure 3. Summer Townet collections of Delta smelt 2018.

Figure 4. Water temperature at Emmaton late August 2018. High tide X2 water is 68-69oF.

Figure 5. Salinity (EC) at Emmaton late August 2018. High tide water is near X2 salinity (3800 EC).