The American River provides approximately 20-40% of the Central Valley fall Chinook run each year. Most of the American River run is derived from hatchery smolt releases from the Nimbus American River Hatchery. In this post, I suggest hatchery and water management actions to increase the ratio of adult returns per hatchery smolt releases to enhance fishery benefits from the American River hatchery.
This post builds on earlier posts. In a July 2020 post, I described how the American River was “shortchanged” on hatchery production, resulting in declining runs and less contributions to ocean and river fisheries. In a May 2019 post, I supported a hatchery strategy that included smolt releases to the river in wet years because river releases survived as well as smolts trucked to the Bay in wet year 2011. I also promoted trucking to the Bay in drier years, because of poor adult returns from river smolt releases in dry years.
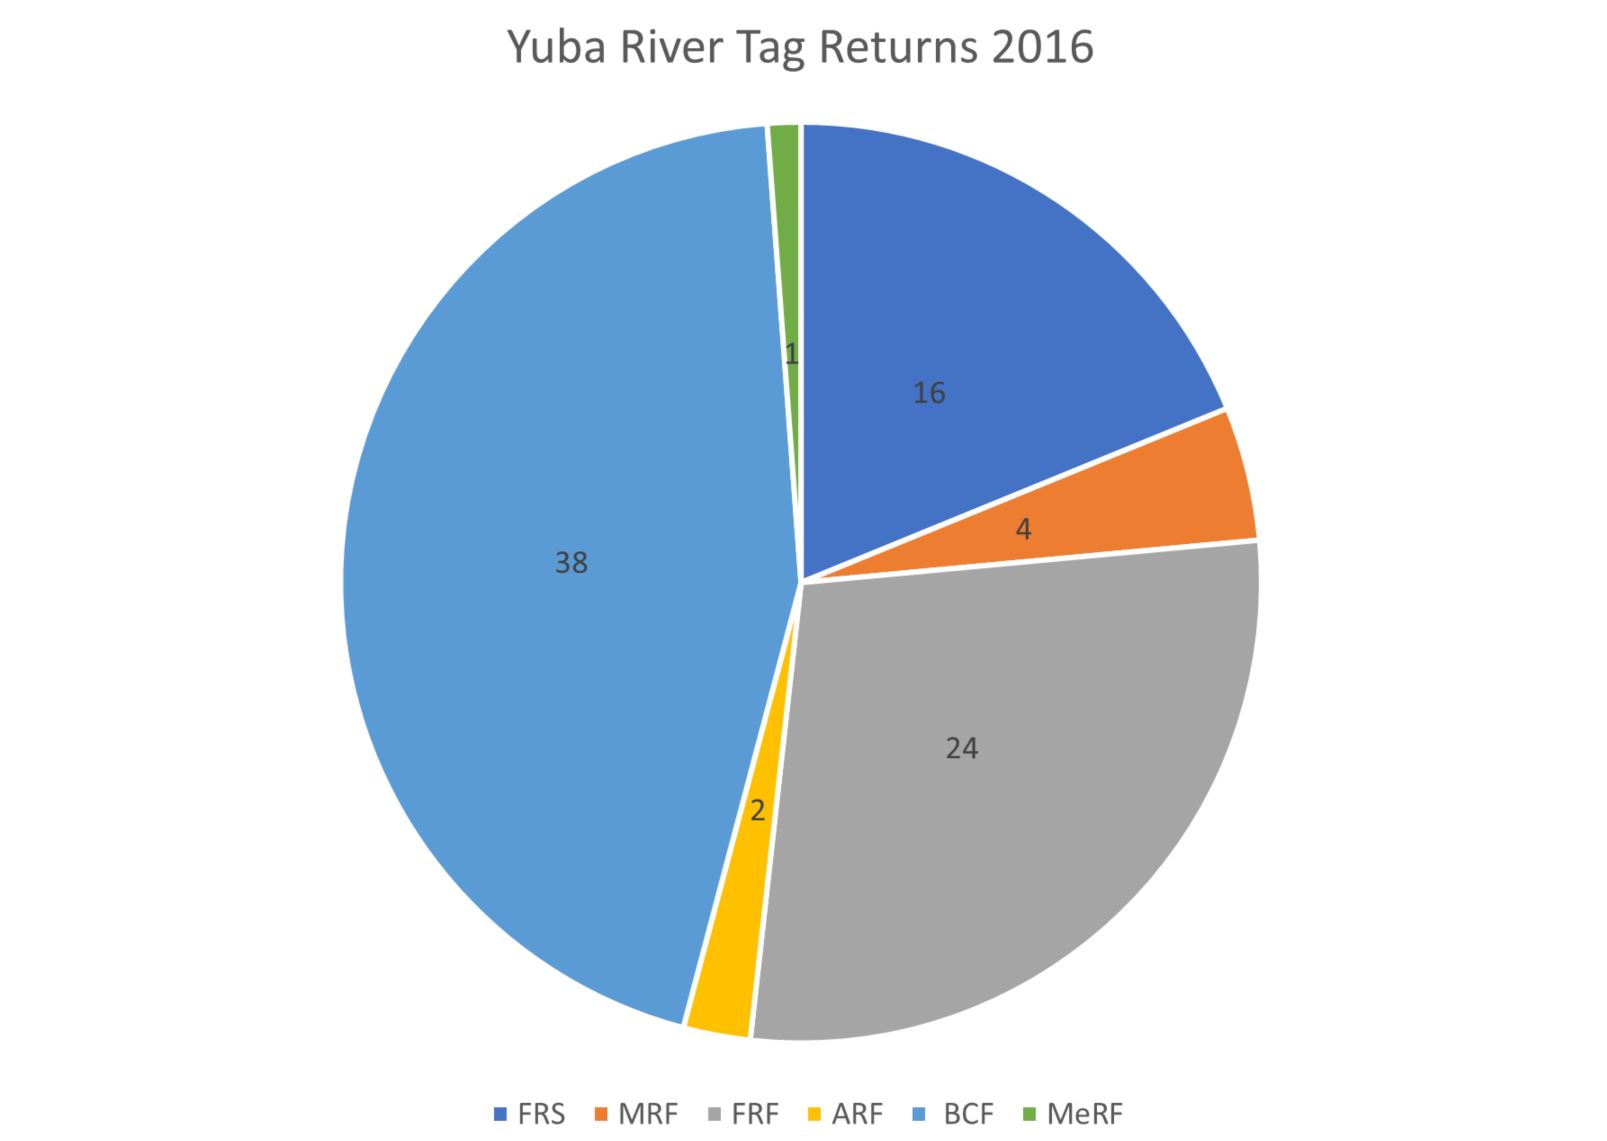
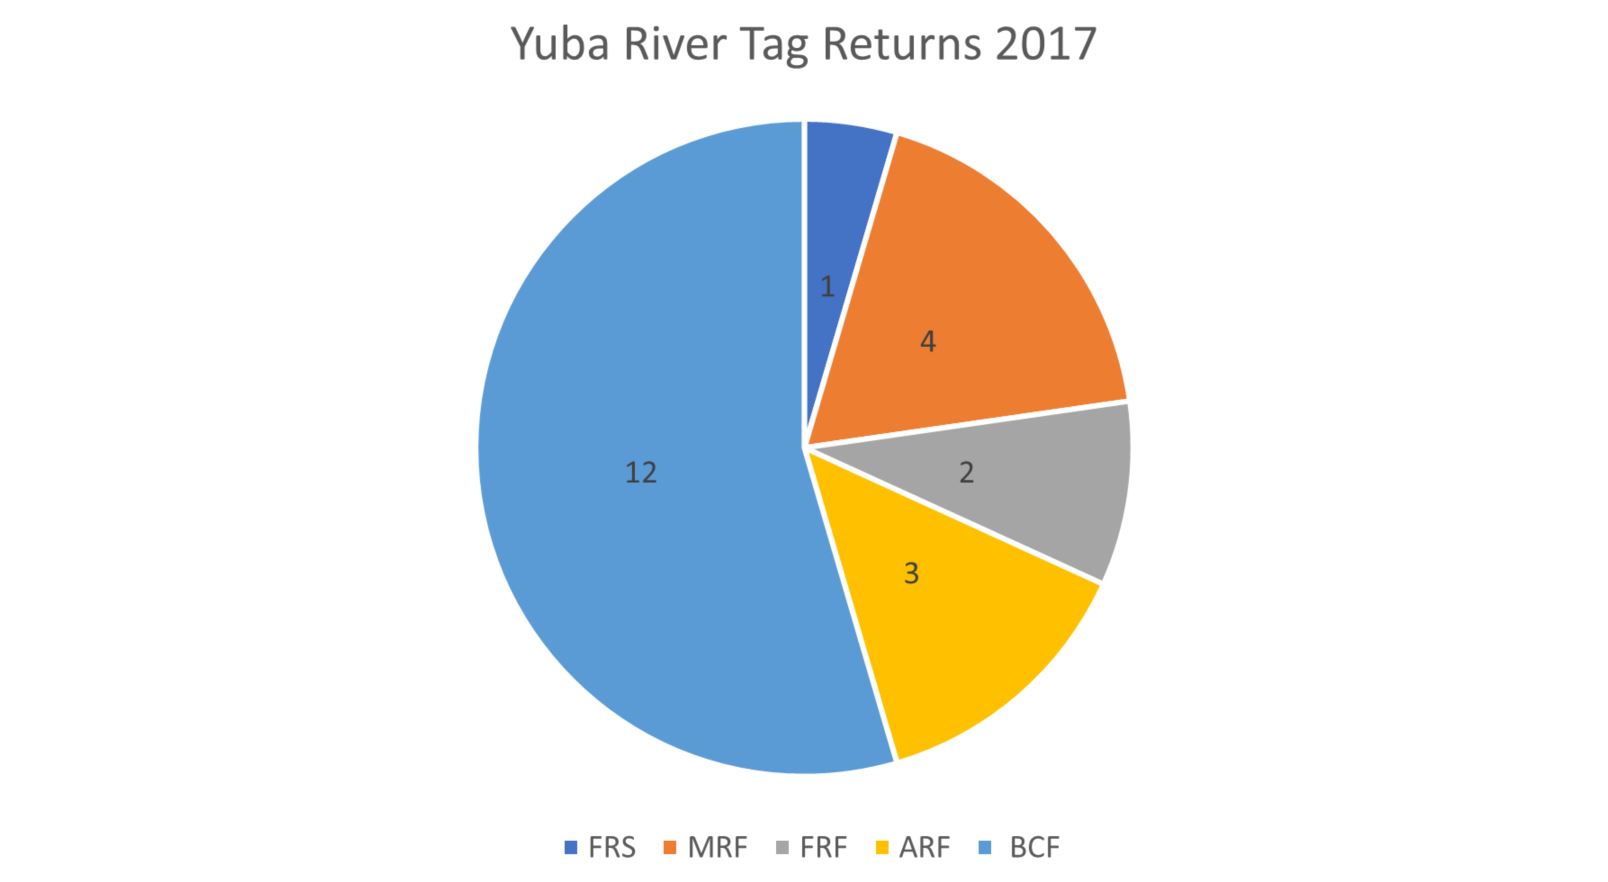
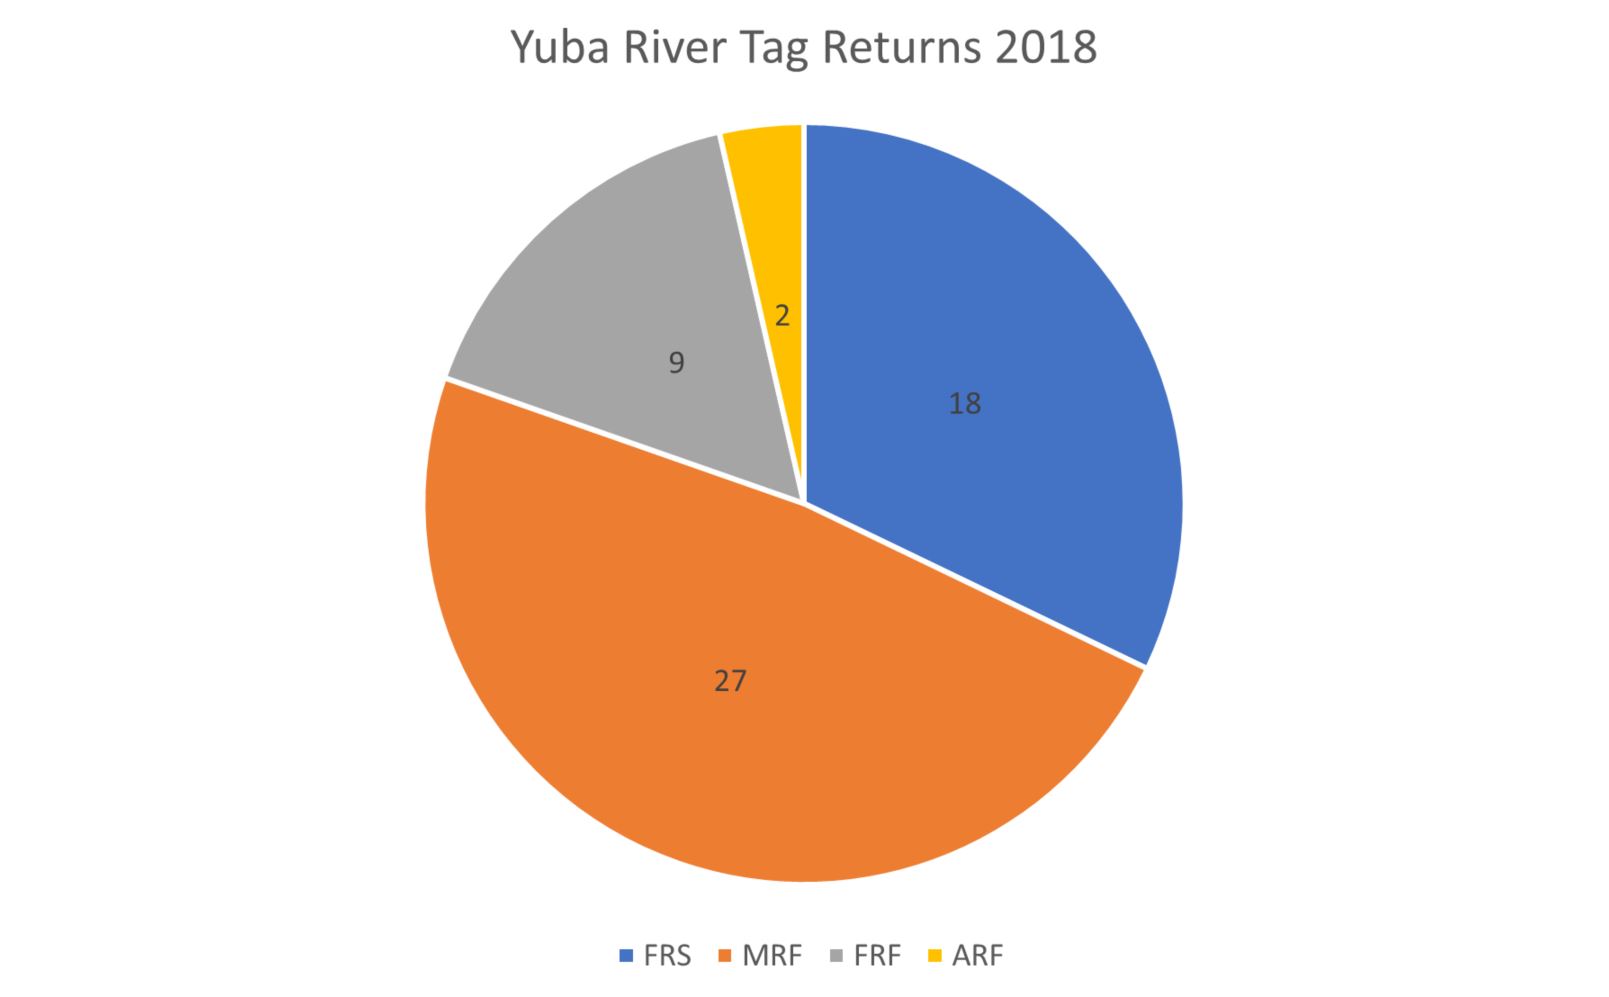
Recent data indicate that trucking provides benefits even in wet years, with limited drawbacks. Water year 2017 was the first wet year since 2011. Returns from the 2017 releases indicate a distinct advantage of trucking smolts to the Bay over river releases (Figure 1). Trucking to the Bay enhanced returns of adult salmon by 250%, although river smolt releases had reasonably good survival (>1%). Returns from below-normal water year 2016 smolt releases (Figure 2) were poor for river releases as expected, but were also lower for Bay releases compared to 2017 releases.
Detailed results from the 2016 and 2017 release groups support trucking smolts to the Bay even in some wet years. Water years 2016 and 2017 provide a good contrast in hatchery smolt return patterns for dry and wet year smolt release strategies, focusing on the differences observed between river and Bay releases. In both years, all smolt releases occurred in late May and early June. Past strategies of late April or early May releases have proved less successful, despite the potential concerns of poor late spring river conditions. It appears that larger smolts have a greater chance of survival regardless of the release strategy.
2016 Smolt Releases
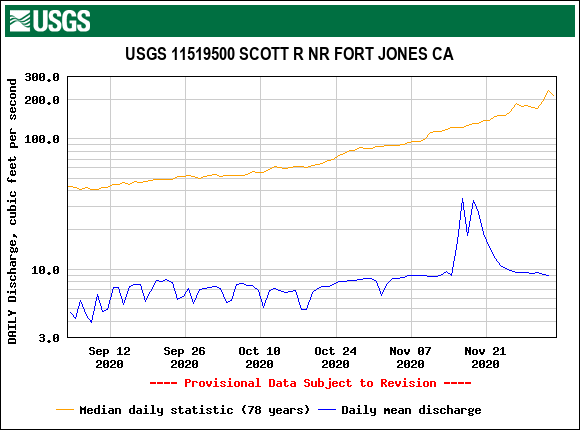
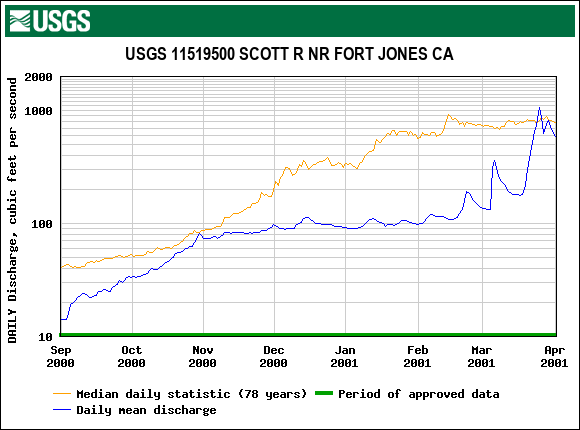
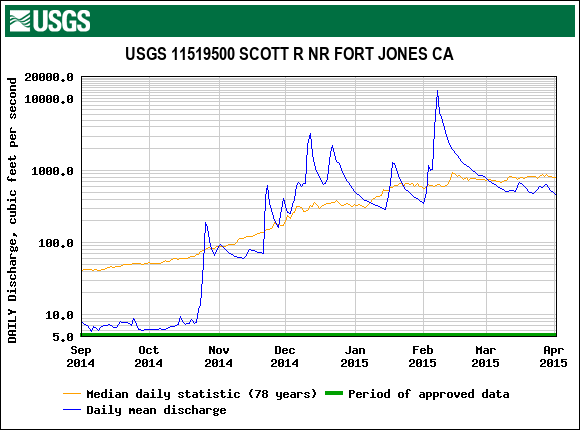
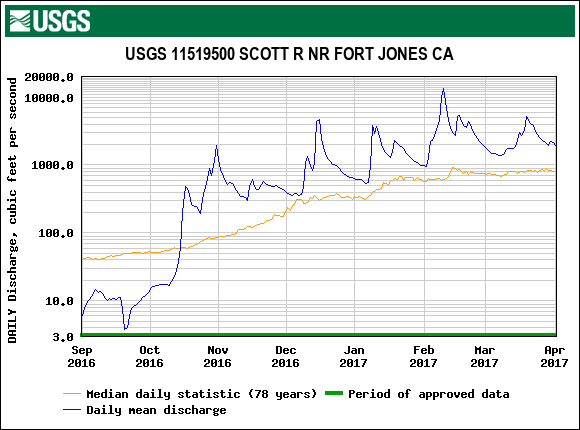
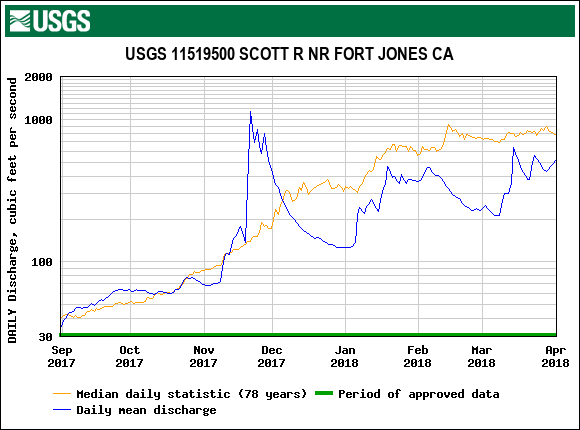
- River smolt releases in 2016 were in mid-May. River conditions were good, with flows of 4,000-5,000 cfs and water temperatures below 60oF (Figure 3). These smolts then had to contend with marginal Delta and Bay conditions (Figures 4-6) on their journey to the ocean. Water temperatures in the Delta in the two weeks following the releases rose from 66 oF to 73 oF (stressful to near-lethal levels), as Delta outflow declined from 14,000 cfs to 7000 cfs.
- Bay smolt releases in 2016 were in early June, with Delta outflow around 7000 cfs (Figure 4). Water temperatures were stressfully warm around the Bay release site at 66-70 oF (Figure 6).
2017 Smolt Releases
2017 Smolt Releases
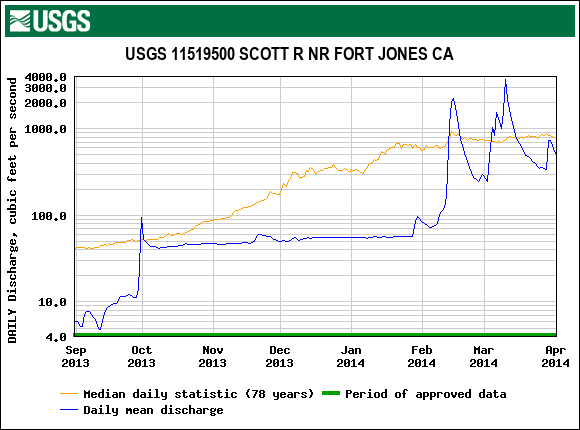
- River smolt releases in 2017 were in late May. American River conditions were good, with flows of >6000 cfs and water temperatures below 60oF (Figure 3). These smolts also had high flows (>50,000 cfs) and near optimal Delta and Bay conditions on their journey to the ocean.
- Bay smolt releases in 2017 were in early June under near optimal conditions, with Delta outflow around 20,000-30,000 cfs (Figure 4).
River vs Bay Releases
- Returns from river smolt releases continued to be very poor in dry year 2016 (0.1-0.3%, Figure 2), while being measurably improved in a wet year 2017 (1.03-1.23%, Figure 1).
- Returns from Bay smolt releases in dry year 2016 (0.9-1.67%, Figure 2) were lower than in wet year 2017 (2.64-2.71%, Figure 1).
- Overall, Bay releases in dry year 2016 had return rates 3 to 10 times higher than river releases. In wet year 2017, Bay release returns were 2.5 times higher than returns of river releases.
Bay releases in a wet year and a dry year
- Bay releases provide higher returns with higher Delta outflow (Figure 7), continuing the pattern previously noted. Survival in wet year 2017, when outflow exceeded 10,000 cfs-20,000 cfs, was nearly double that in dry years 2016. A combination of lower net transport flows and higher water temperatures (Figure 6) in 2016 likely explains why returns from Bay smolt releases in 2016 was 50% of returns from Bay smolt releases in 2017.
Straying of adult returns from Bay and river releases
Straying of adult returns originating from the American River hatchery to other rivers remains an issue with off-site hatchery smolt releases (trucking to the Bay). Though the proportion of strays is low (10-30%, Figures 8 and 9), it is a concern for two reasons:
- The number of adult spawners reaching the American River is lower.
- Hatchery strays can reduce the genetic integrity of the salmon population of the American River as well as other river populations, with unknown but potentially serious long-term consequences.
Straying occurs from Bay releases especially in dry years, because the hatchery smolts partially imprint on Mokelumne River water occurring at the release site near the mouth of the Napa River in eastern San Pablo Bay. Returning adults get mixed signals in late summer and early fall in the west Delta at the confluence of the Sacramento and San Joaquin rivers. Flows from both rivers have their signature at the confluence, because the Delta Cross Channel (DCC) is open all summer and early fall. Half the American River water can pass through the DCC and come out the San Joaquin channel. As a result, many American fish head up the San Joaquin channel and then up the Mokelumne forks.
Another theory is that because about a third of Mokelumne Hatchery smolt releases to the Delta and Bay wind up returning to the American River to spawn, their offspring are genetically coded to the Mokelumne.
What if?
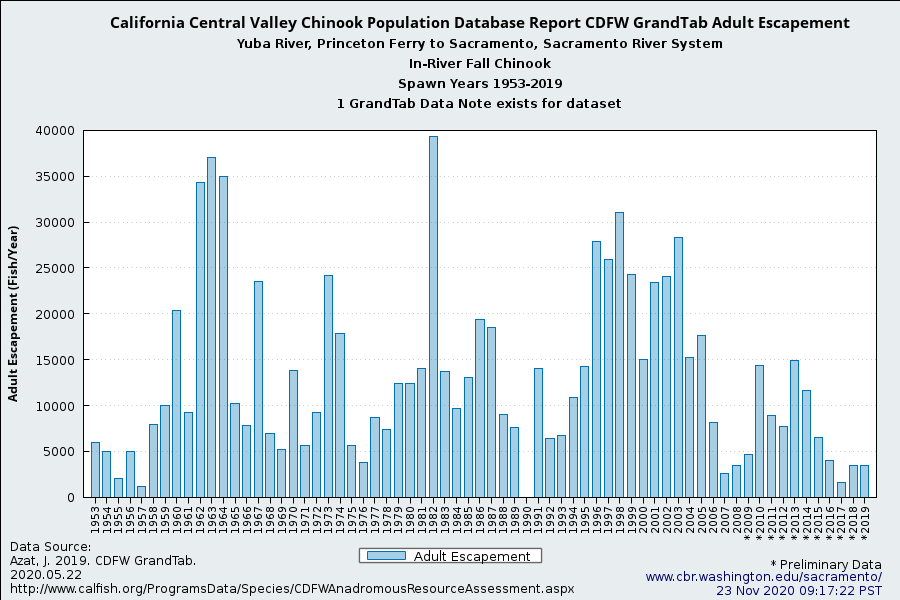
What if more of the American hatchery smolts were released in the Bay or along the coast? That would increase returns about 50% in wet years (assuming all the returns were 2.5% in Figure 1) and more than double returns in dry years like 2016 (assuming all the returns were 1.25% in Figure 2.) Assuming conservatively that the hatchery contribution to the run is about 80-90 percent, the American fall-run salmon escapement of adults (Figure 10) would increase by over a third. A similar increase in fishery contributions from the American hatchery would also be likely. Since the American contributes about 20% to the overall Central Valley fall run escapement (Figures 10 and 11), Valley-wide contributions to fisheries and escapement would increase 5-10% with more Bay releases.
What if Delta outflow were increased in dry years in late spring during Bay hatchery smolt releases? That could increase dry year returns 50% or more (2015-2018 in Figure 10).
What if hatcheries only spawned their own river genetic coded adults and strays were removed on their way to spawning reaches? And what if Bay smolt releases were barged to Bay release sites instead of trucked? Such actions would reduce straying and improve the genetic integrity of each river’s populations.
What if hatchery smolts were not released in rivers? There might be less competition with wild smolts and reduced effects of predation and competition on wild steelhead fry that predominately emerge from redds in late spring.
Summary and Conclusion
The contribution of American River hatchery salmon smolts to adult spawner returns and fisheries would be significantly higher if these hatchery smolts were all trucked to the Bay. Straying to other Central Valley rivers would increase. However, competition with and predation on wild salmon and steelhead in the American River would decrease.
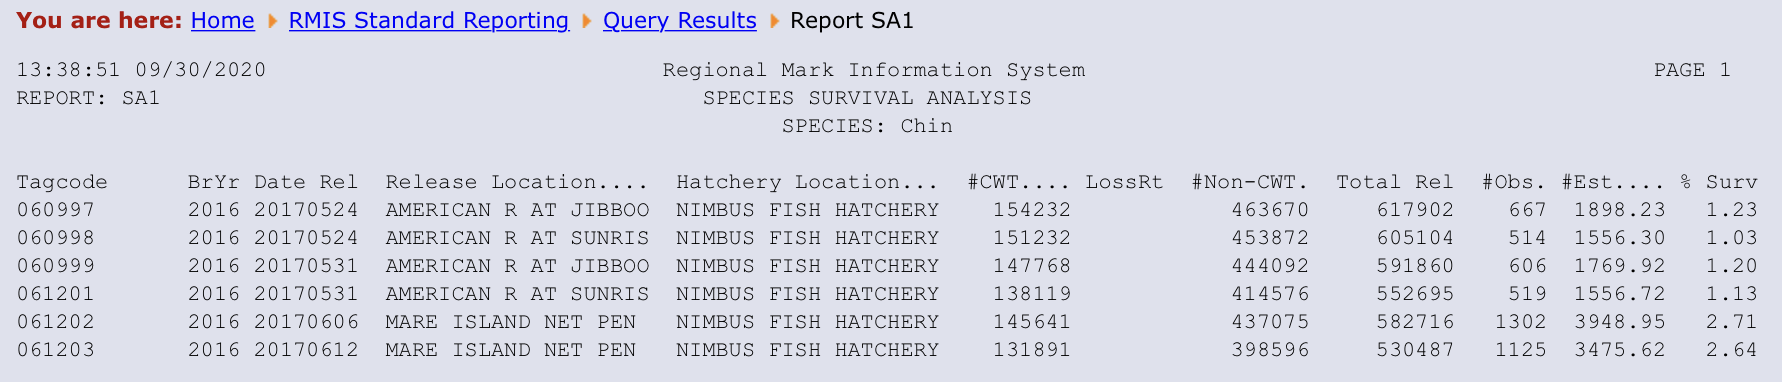
Figure 1. Percent survival (adult returns) of six tag groups of American River Hatchery releases of fall run salmon smolts in spring 2017. Data source: https://www.rmpc.org
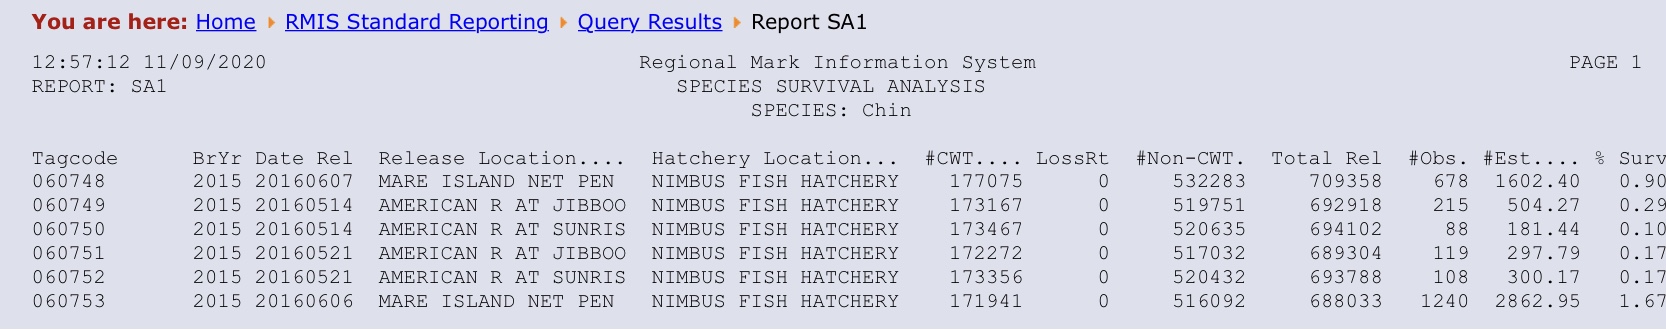
Figure 2. Percent survival (adult returns) of six tag groups of American River Hatchery releases of fall run salmon smolts in spring 2016. Data source: https://www.rmpc.org
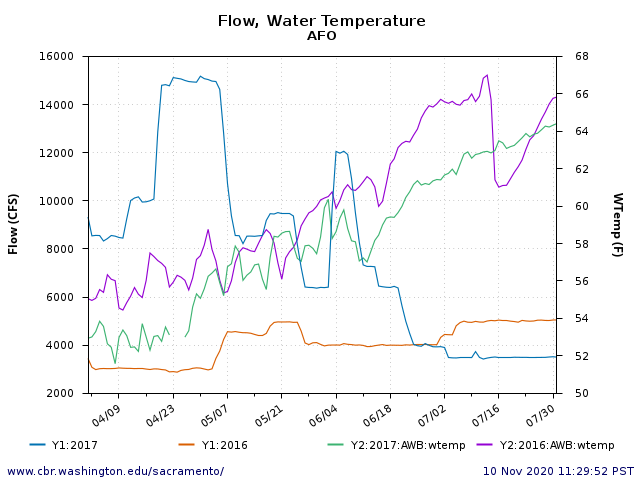
Figure 3. Comparison of 2016 and 2017 flows and water temperatures in spring.
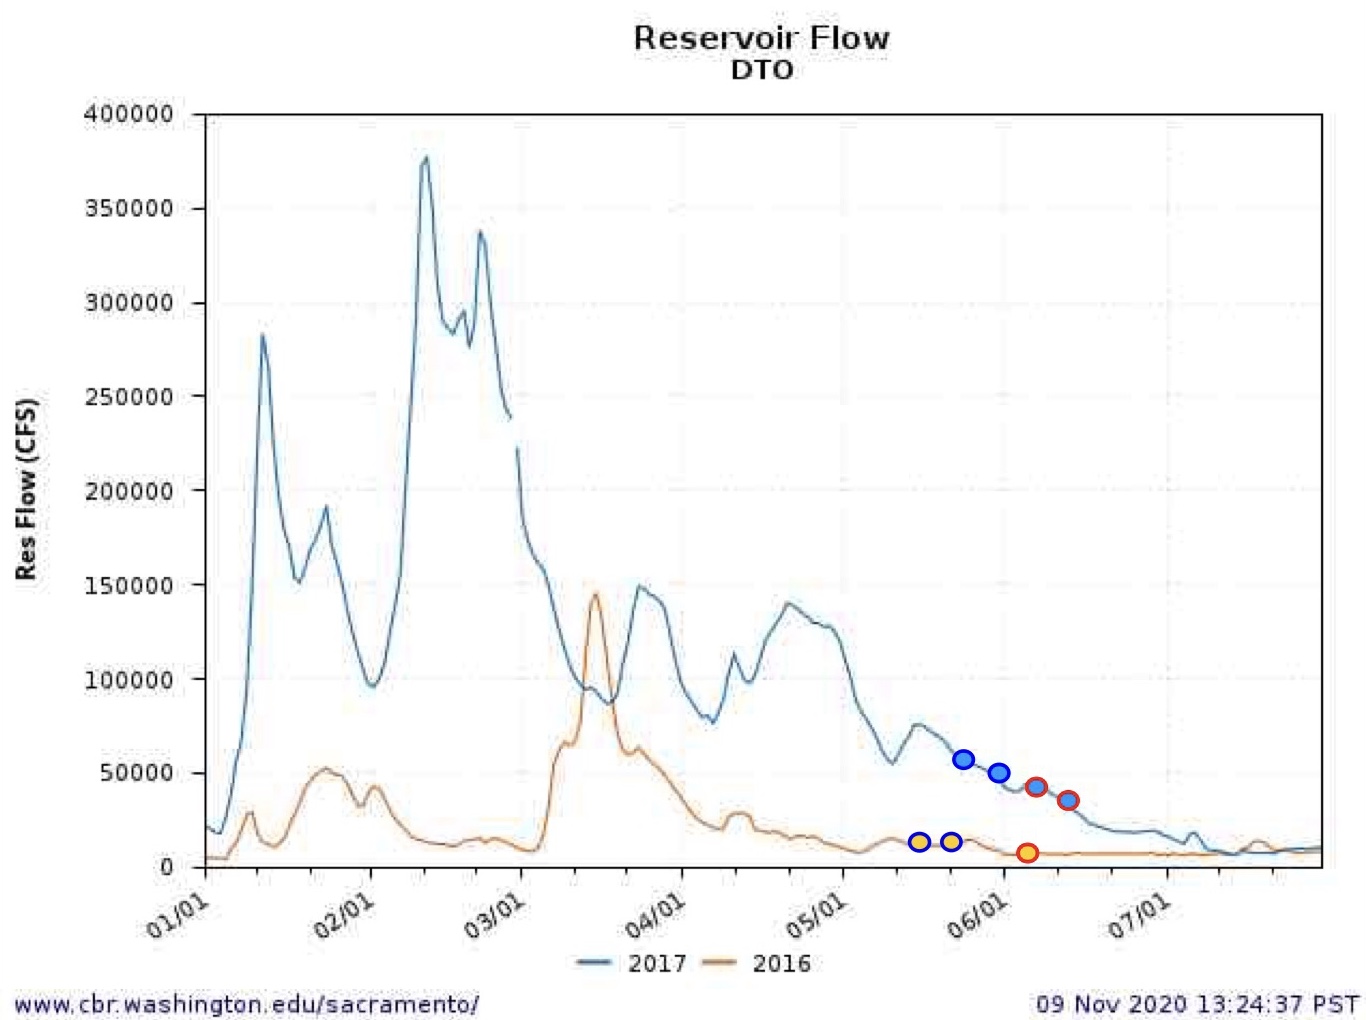
Figure 4. Delta outflow in spring 2016 and 2017. Dots represent fall-run hatchery smolt releases. Blue outlined dots are river releases. Red outlined dots are Bay releases.
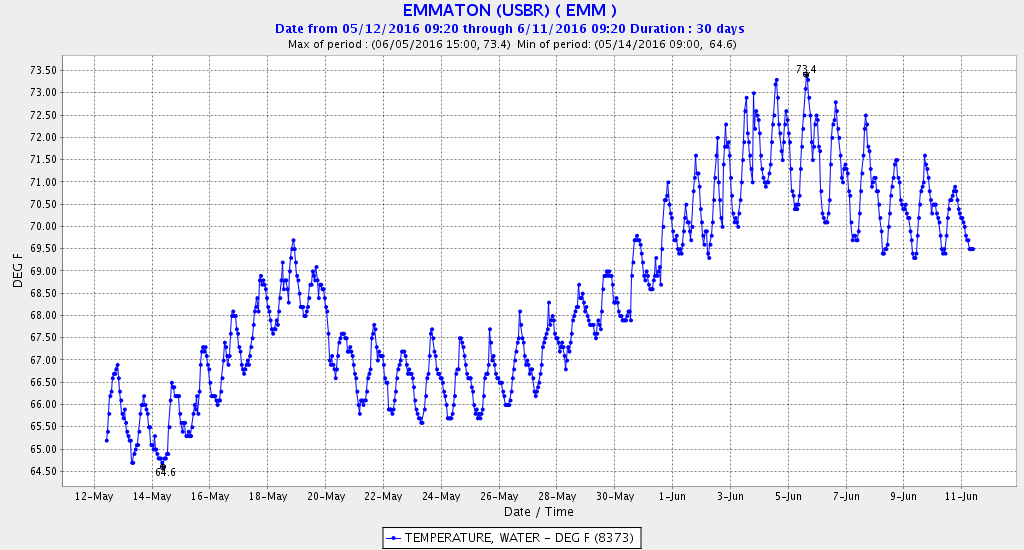
Figure 5. Sacramento River water temperature in the west Delta near Sherman Island in spring 2016.
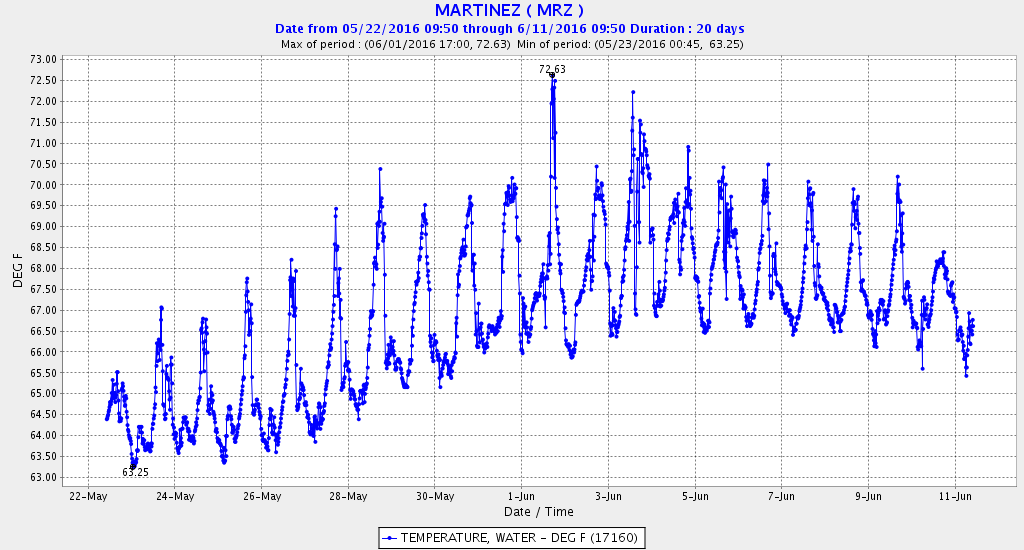
Figure 6. North Bay water temperature near Bay hatchery salmon smolt release site in 2016.
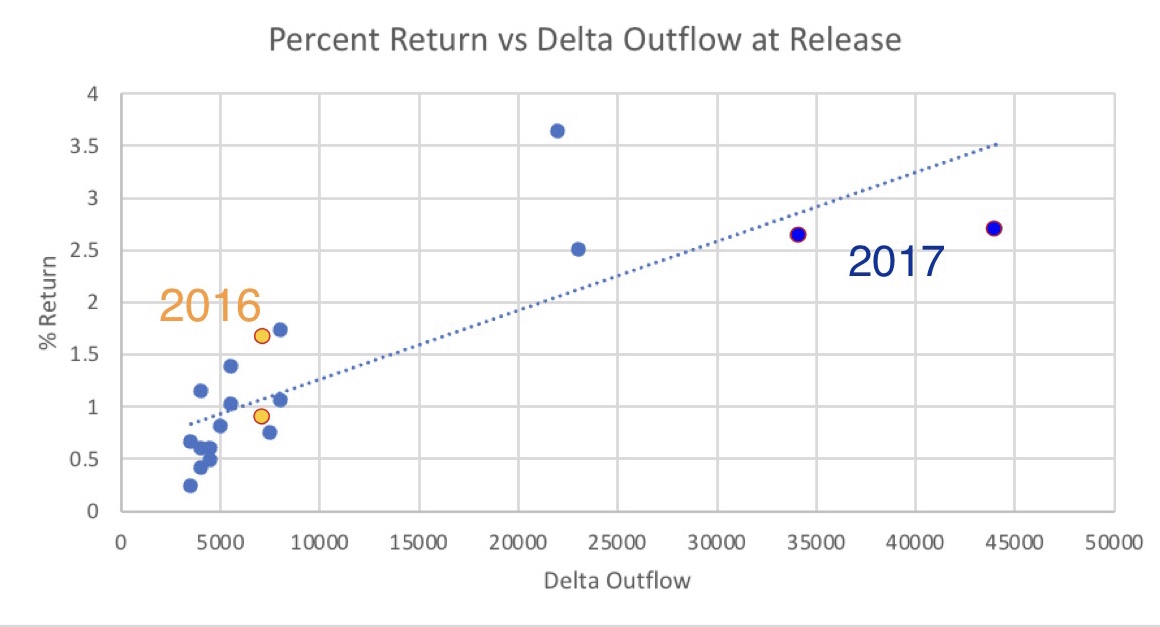
Figure 7. Percent return of selected tagged hatchery smolt groups released to Bay by Delta outflow at the time of release with 2016 and 2017 noted. Data sources: https://www.rmpc.org and CDEC.
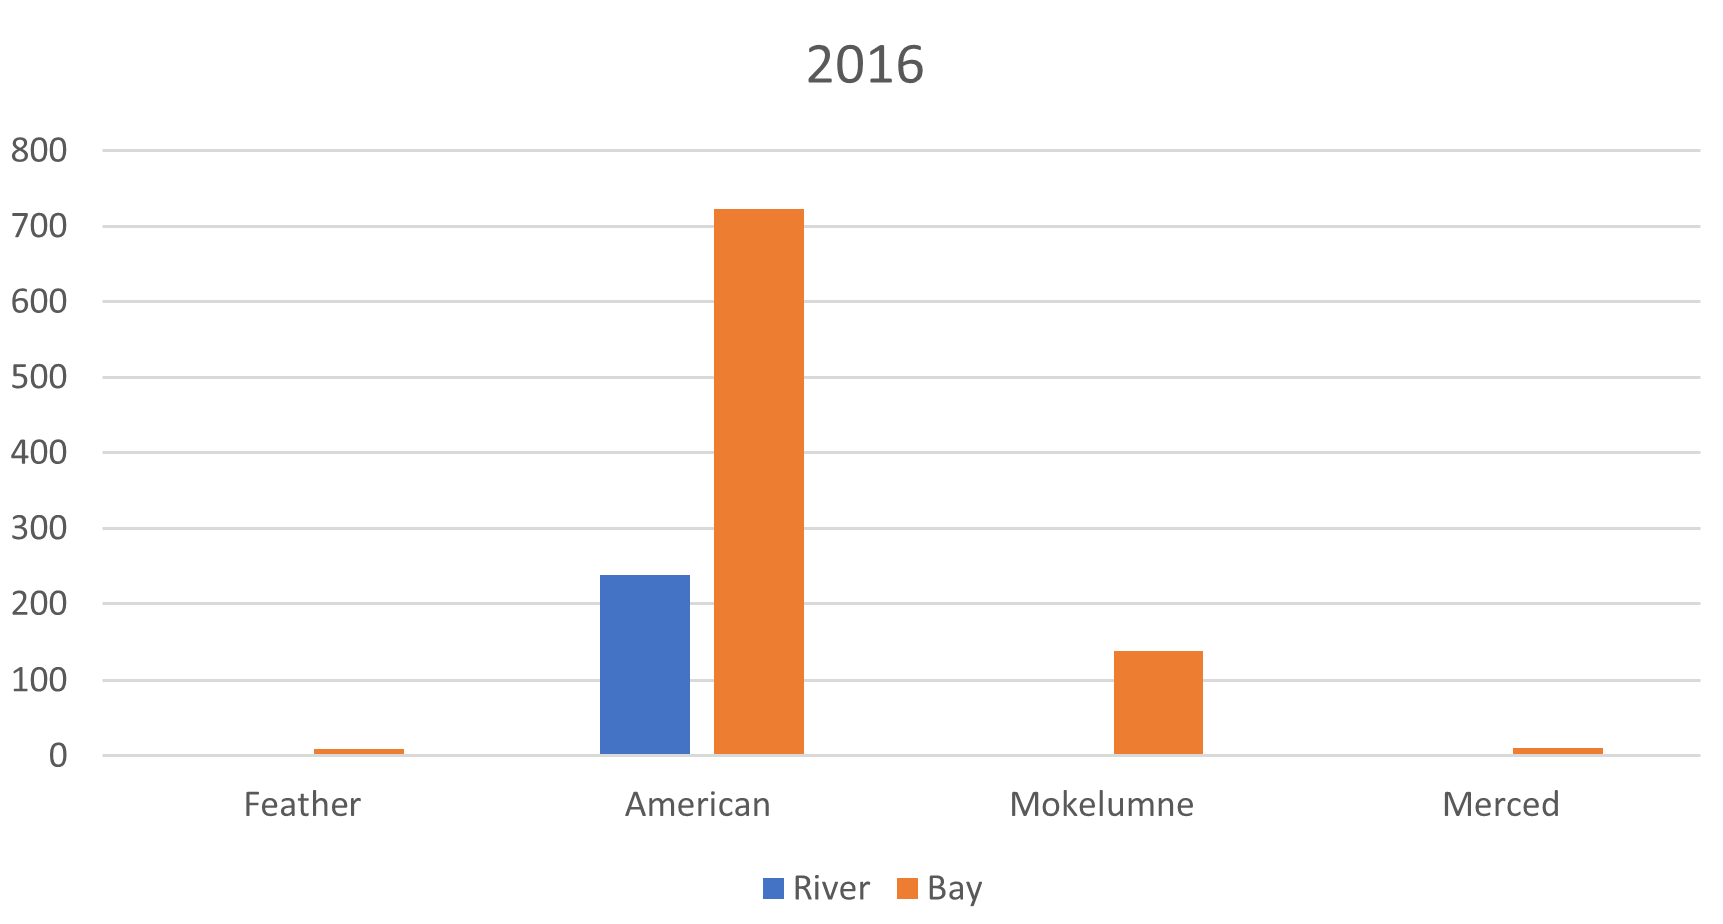
Figure 8. Returns of American River origin adult hatchery fall-run to four state hatcheries from 2016 drier year releases to river and Bay. Data source: https://www.rmpc.org
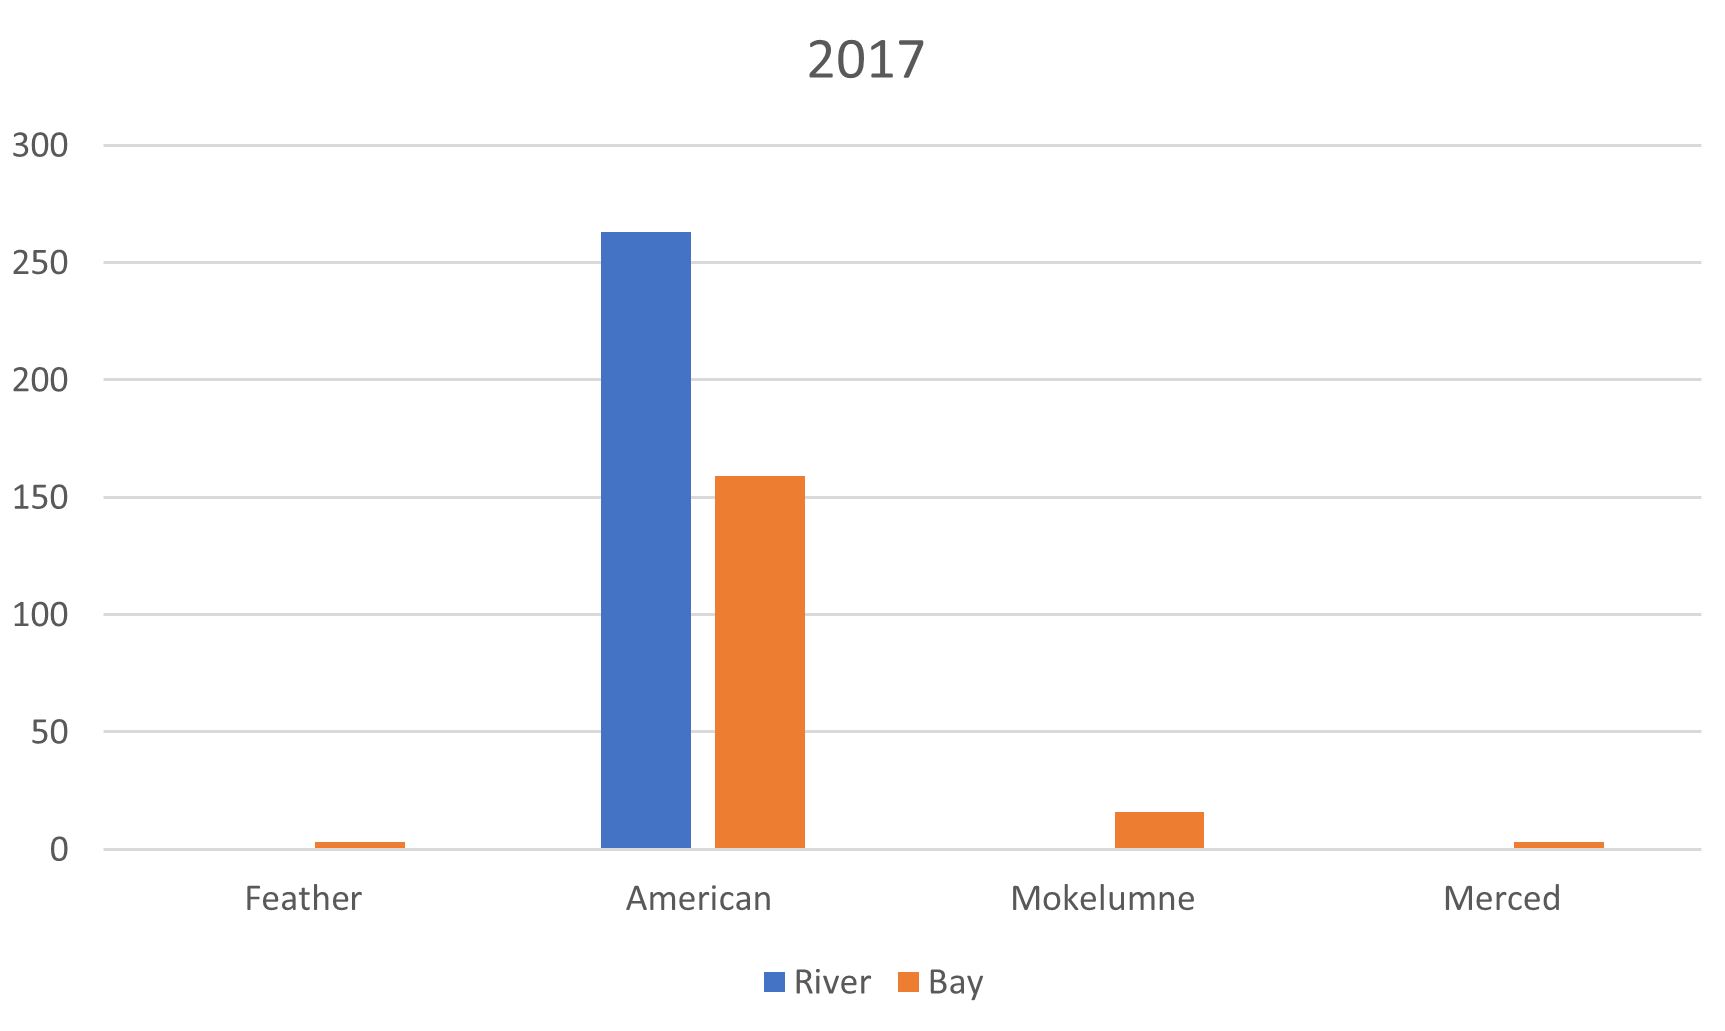
Figure 9. Returns of American River origin adult hatchery fall-run to four state hatcheries from 2017 wet year releases to river and Bay. Data source: https://www.rmpc.org
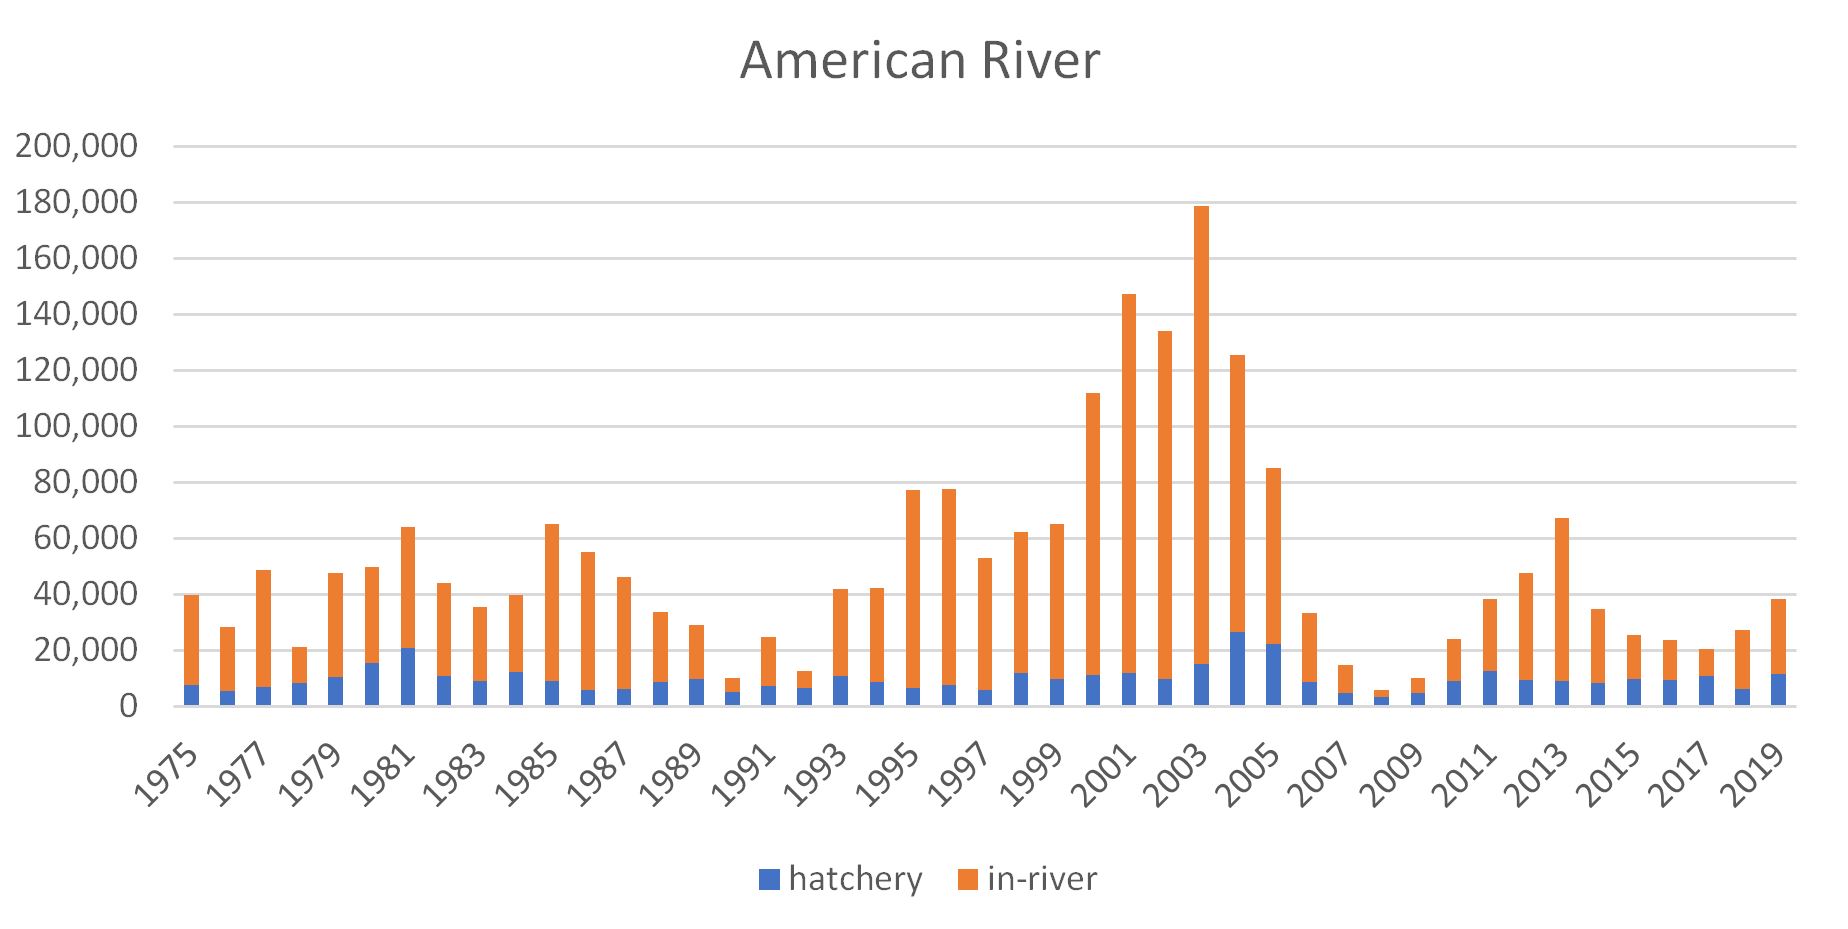
Figure 10. American River salmon escapement 1975-2019. Data source: https://nrm.dfg.ca.gov/FileHandler.ashx?DocumentID=179102&inline=1
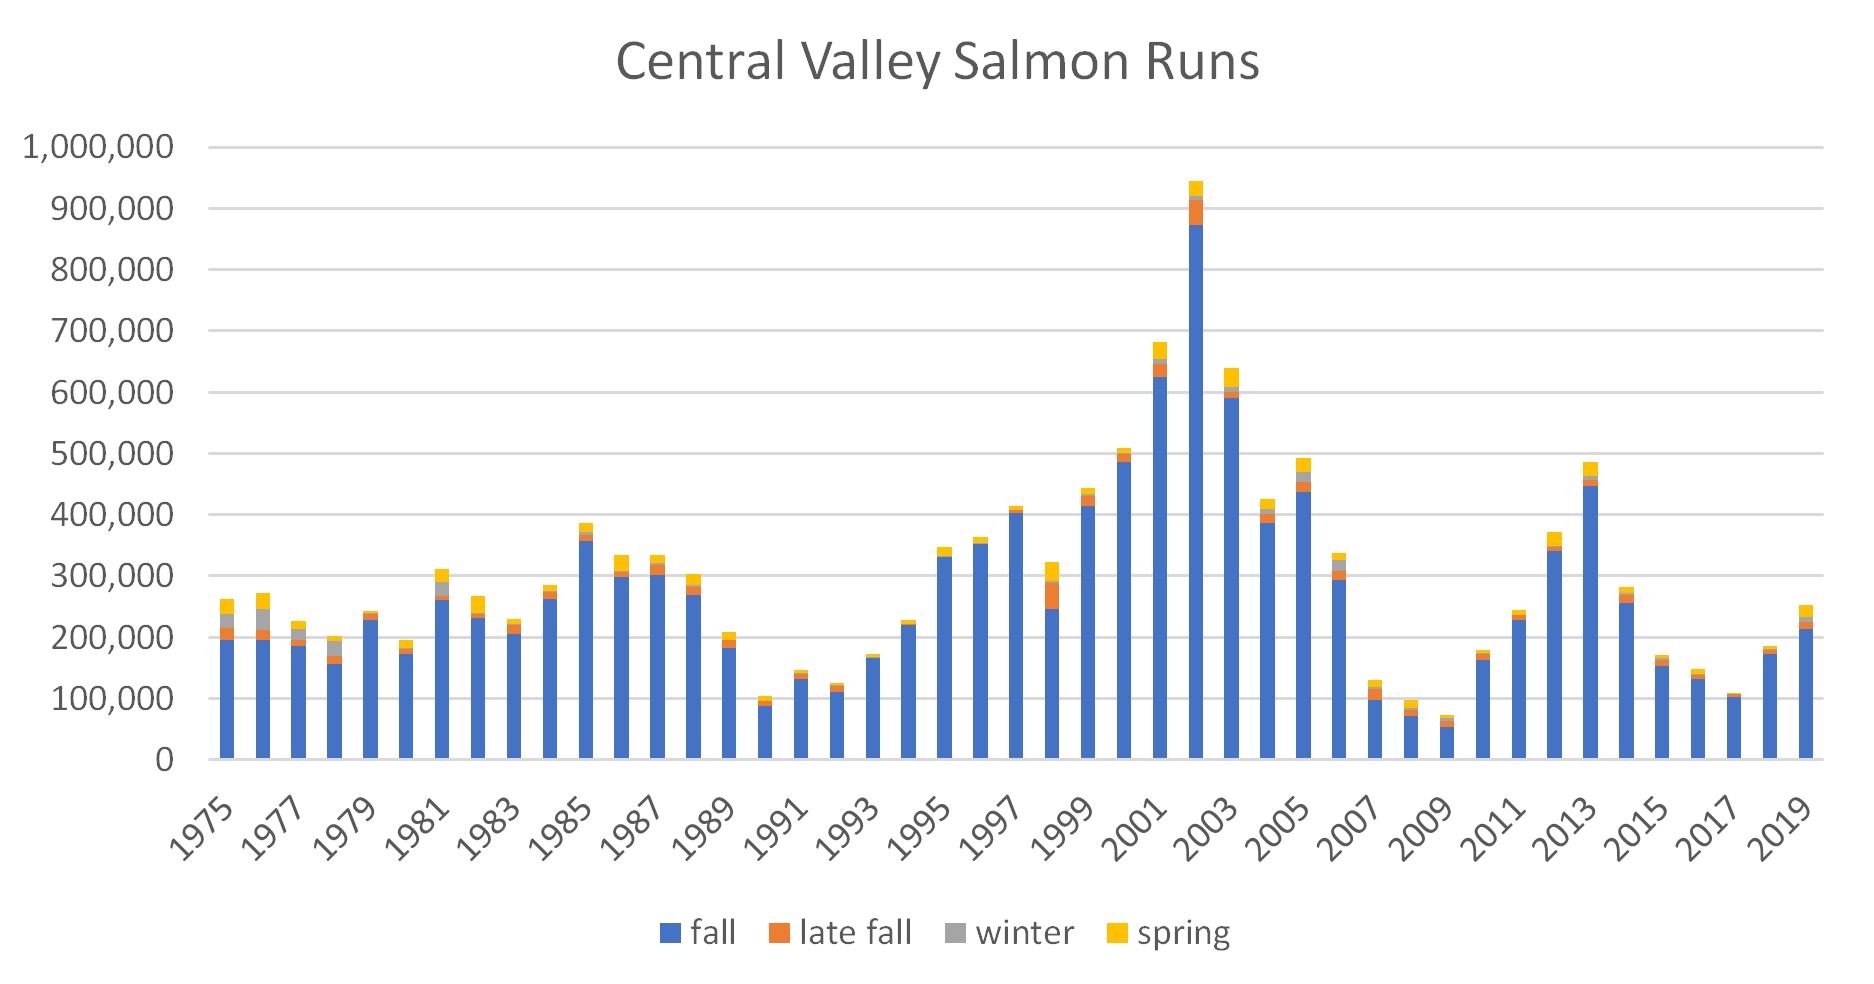
Figure 11. Central Valley escapement of four salmon runs 1975-2019. Note the fall run Chinook dominate. Data source: https://nrm.dfg.ca.gov/FileHandler.ashx?DocumentID=179102&inline=1