Striped Bass Status – Summer 2019

I last reported the status of striped bass in 2016.  The prognosis was not good after four years of drought (2012-2015).  Today, after a sequence of water years (2016-2019) that were below normal, wet, below normal and wet, the prognosis has not improved, notwithstanding the remarkable resilience of striped bass.

After improving in below-normal 2016 and wet year 2017, the below-normal 2018 fall index equaled that of below-normal 2010, the lowest since 2000 (Figure 1).  A similar pattern occurred in the 2018 summer index (Figure 2).

The summer-to-fall recruitment relationship (Figure 3) shows a continuing strong relationship between the summer index and fall recruitment.  Furthermore, the relationship continues to show a positive response in wet years (2011 and 2017), but a poor response in the below normal years (2010, 2016, and 2018).  This indicates that summer conditions in these below-normal water years is depressing  the fall recruitment of striped bass.

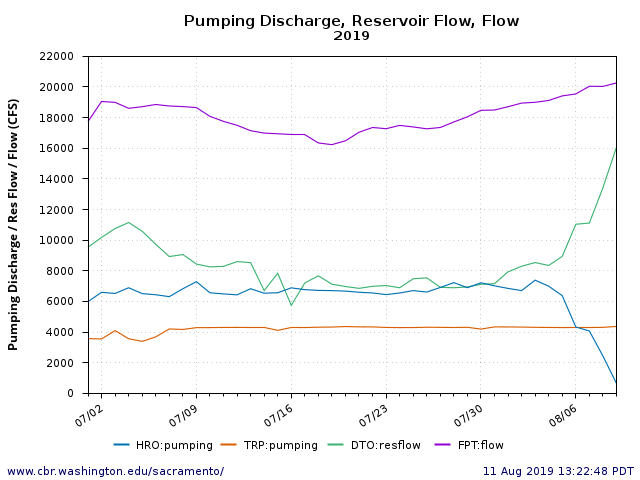
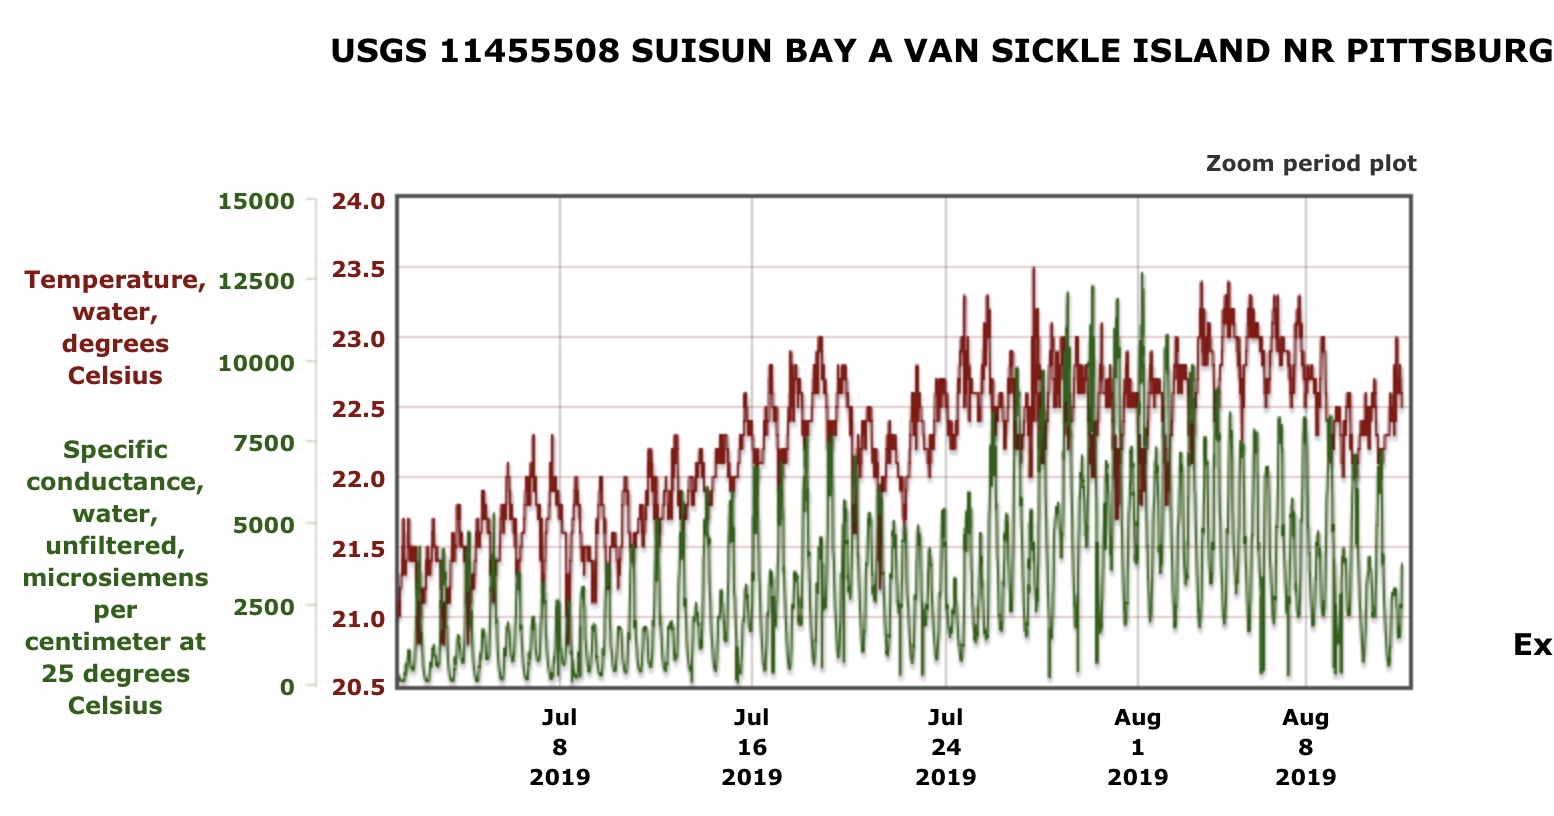
Early indicators for wet year 2019 give me pause and further concern for striped bass recruitment this fall.  First, numbers and densities in the 2019 late spring 20-mm survey were way down as compared to 2017.  Second, despite high south Delta exports in July 2019, juvenile striped bass salvage is also lower compared to July 2017 (Figure 4), consistent with the lower 20-mm survey results.  The summer and fall indices for 2019 will help complete the story.

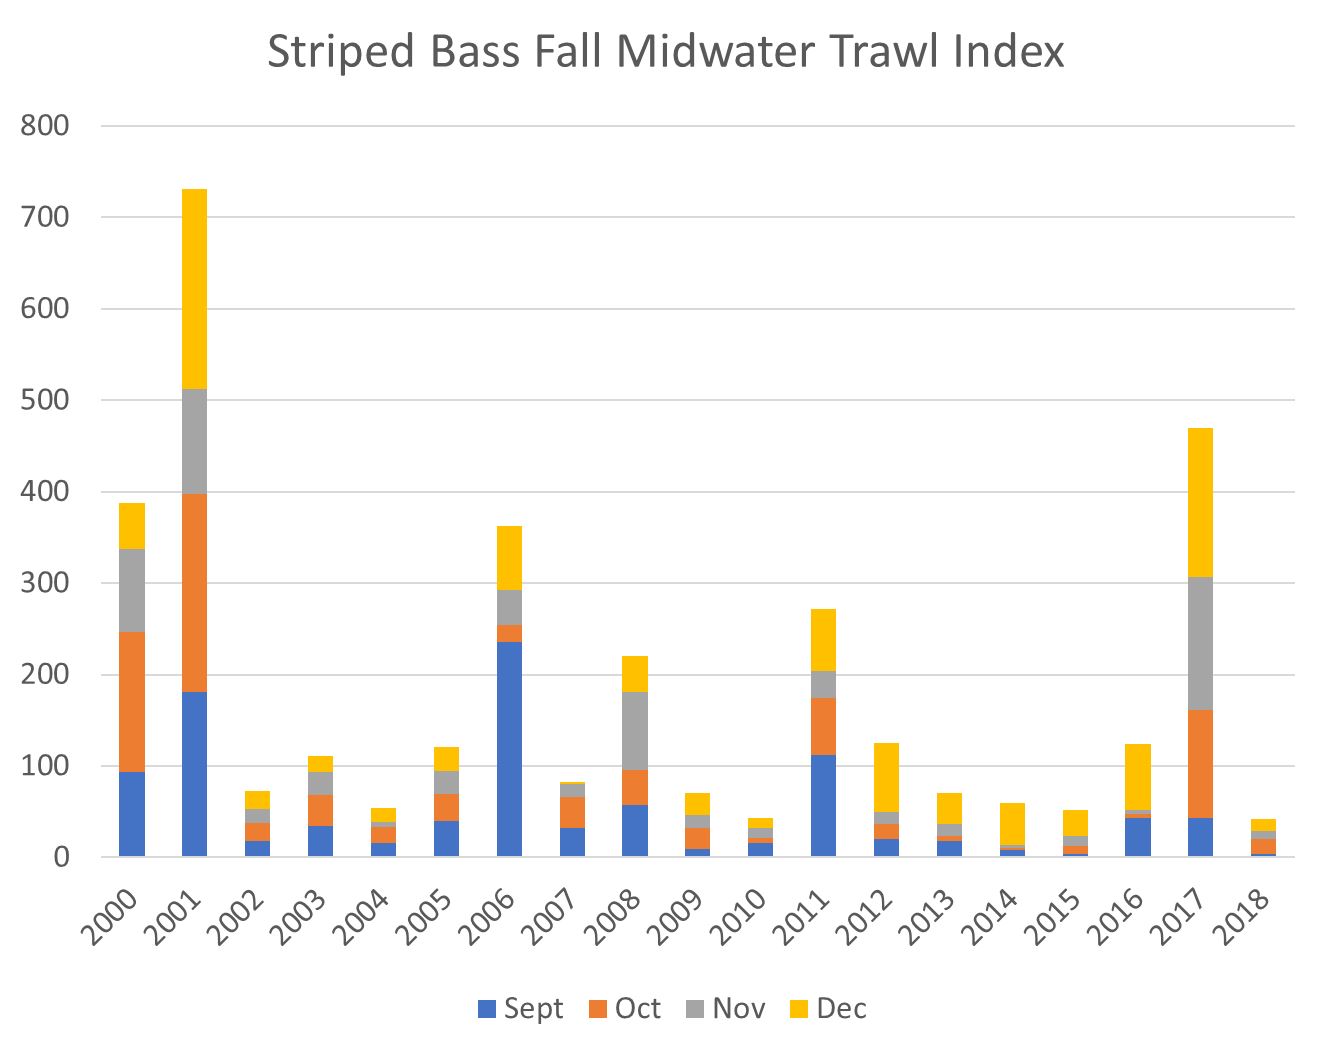
Figure 1. Striped bass fall index 2000-2018.

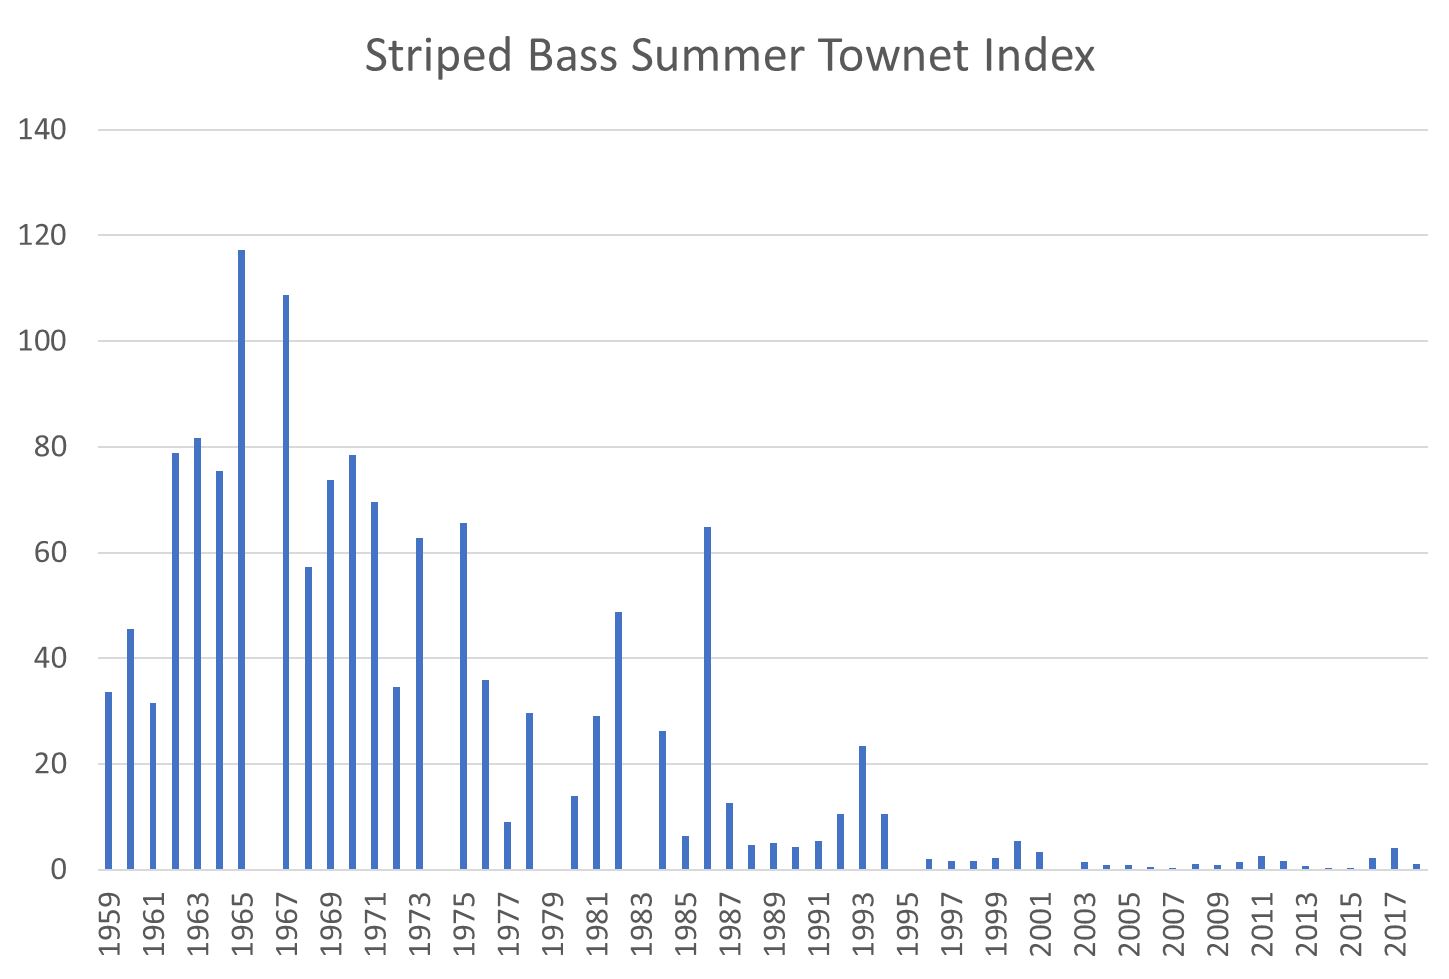
Figure 2. Striped bass summer index 1959-2018.

Figure 3. Striped bass Fall Midwater Trawl Survey Index (log10[index+1]) versus prior Summer Townet Index (log10). Select years labeled, with color of number showing year type: blue=wet, green=normal, and red=critically dry.

Figure 3. Striped bass Fall Midwater Trawl Survey Index (log10[index+1]) versus prior Summer Townet Index (log10). Select years labeled, with color of number showing year type: blue=wet, green=normal, and red=critically dry.

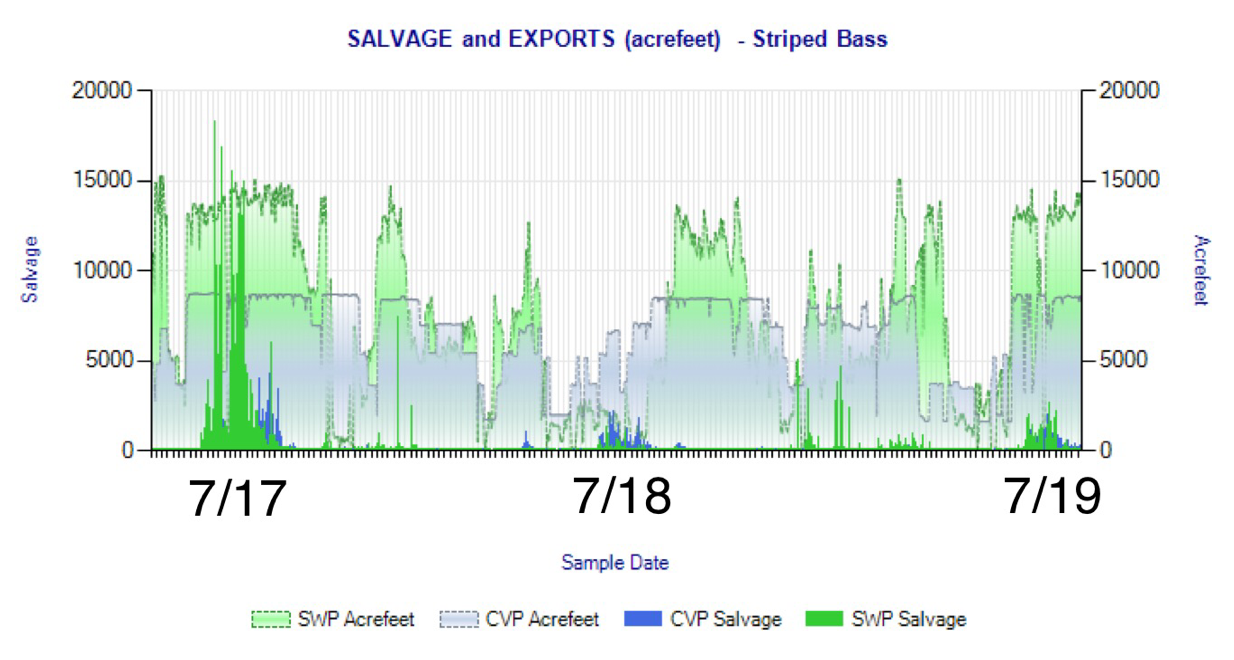
Figure 4. Striped bass salvage at south Delta export facilities with export levels (acre-feet) summer 2017-summer 2019. Note near maximum export levels in July 2017 and 2019.

Delta August Adjustment

The State of California has markedly increased inflows to the Delta and reduced exports in early August 2019 (Figure 1). There is no announced reason for this major hydrologic adjustment that has had a major effect on Bay-Delta habitat. The likely reason was to maintain the 14-day average salinity standard of 450 EC at Jersey Point,1 which was exceeded on a daily basis beginning on August 10 (Figure 2).

“Adjustments” to Delta inflow and exports began at the end of July as daily Jersey Point salinity began to exceed the 450 EC standard. The federal Central Valley Project made little or no contribution to this correction.

These recent changes are a textbook example of why the 14-day salinity standard needs to change to a daily standard. State water managers gamed easily controlled parameters, using the 14-day average to squeeze out more exports through July. This operation caused a major system reaction with far-reaching consequences to the State Water Project system and to the Bay and Delta.

The state could have maintained a daily 450 EC limit with gradual small system adjustments and support from the CVP.

Further discussion of the effects follows below.

Figure 1. Sacramento River Delta inflow at Freeport (FPT flow), Delta outflow (DTO resflow), state exports (HRO pumping), and federal exports (TRP pumping), 7/1-8/9, 2019. Note only state exports were affected.

Figure 2. Salinity (EC) at Jersey Point near mouth of San Joaquin River in the Delta 7/14-8/10, 2019.

Delta Inflow
Sacramento River inflow to the Delta at Freeport increased about 3000 cfs to just over 20,000 cfs (Figure 3).  The extra flow came from the Feather River (Oroville Reservoir of the SWP).  The higher inflow coincided with a drop in water temperature at Freeport from 23oC to 21oC.

Delta Outflow
Delta outflow rose about 9000 cfs from near 7000 cfs to 16,000 cfs (3000 from inflow and 6000 from reduced exports, Figure 1).  Outflows rose in the Sacramento channel at Rio Vista (Figure 4) and San Joaquin channel (Figure 5).  Water temperatures also fell about 1oC.

Interior Delta
Flow also increased and water temperature fell in Georgianna Slough (Figure 6).

Suisun Bay
Salinity and water temperature fell in Suisun Bay west of the Delta (Figure 7).

Figure 3. Flow and water temperature in Sacramento River at Freeport 7/1-8/10, 2019.

Figure 4. Flow and water temperature in Sacramento River at Rio Vista, 7/1-8/10, 2019.

Figure 5. Flow and water temperature in San Joaquin River at Jersey Pt, 7/1-8/10, 2019.

Figure 6. Flow and water temperature in Georgianna Slough in the central Delta, 7/1-8/10, 2019.

Figure 7. Salinity and water temperature in Suisun Bay near Pittsburg, 7/1-8/10, 2019.


  1. The standard applies for wet years through August 15.