Welcome to the California Fisheries Blog

The California Sportfishing Protection Alliance is pleased to host the California Fisheries Blog. The focus will be on pelagic and anadromous fisheries. We will also cover environmental topics related to fisheries such as water supply, water quality, hatcheries, harvest, and habitats. Geographical coverage will be from the ocean to headwaters, including watersheds, streams, rivers, lakes, bays, ocean, and estuaries. Please note that posts on the blog represent the work and opinions of their authors, and do not necessarily reflect CSPA positions or policy.

Reclamation Is Not Meeting the 2026 Shasta Temperature Management Plan

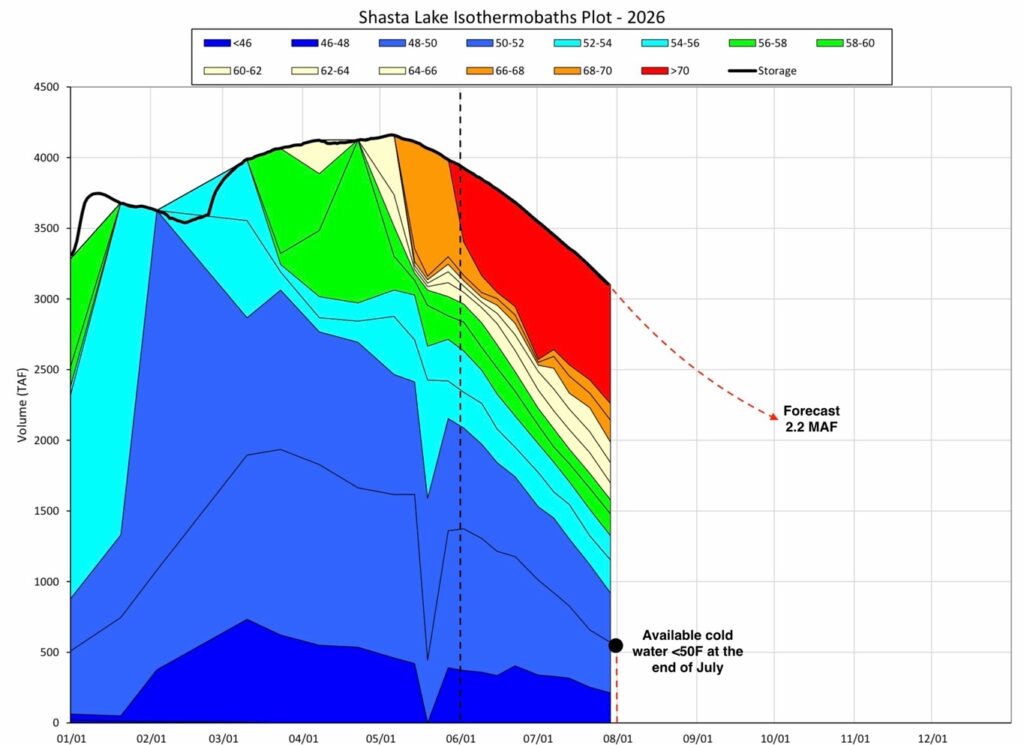
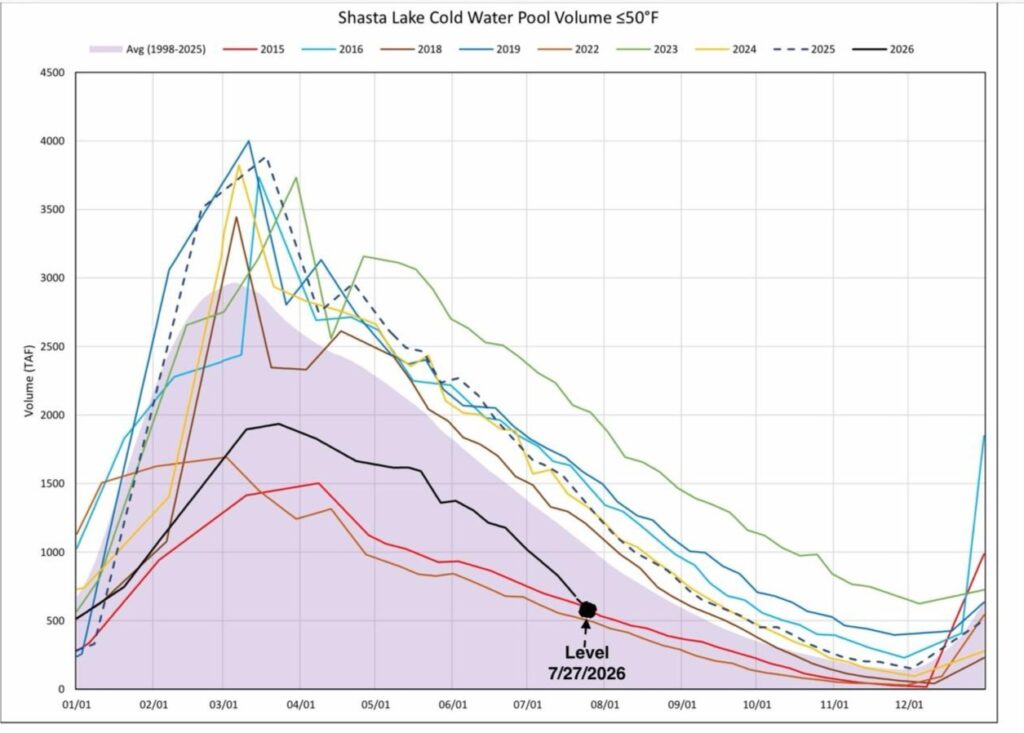
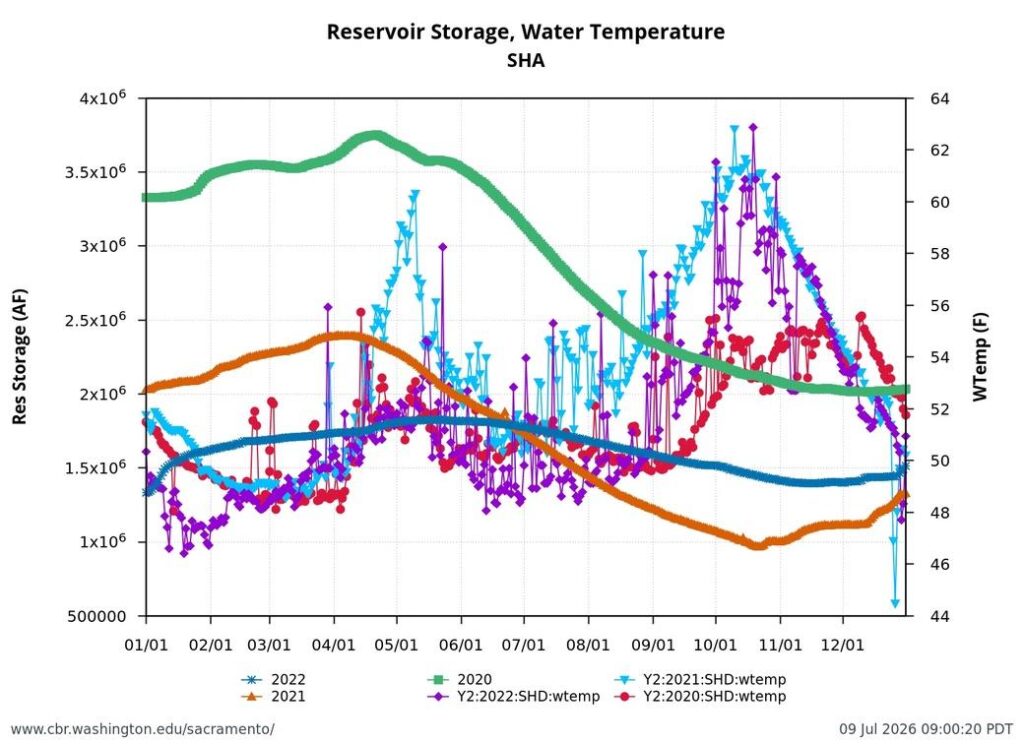
The US Bureau of Reclamation is well on its way to failing to adhere to its 2026 Sacramento River Temperature Management Plan (TMP). The cold-water pool supply in Shasta Reservoir has fallen as low on this date in 2026 as it was in critical drought years 2015 and 2022 (Figure 1). Survival of winter-run Chinook salmon in the Sacramento River from brood years 2015 and 2022 was less than 5 percent because the cold-water-pool supply in Shasta Lake was exhausted before the end of summer. Reclamation is again creating similar conditions that threaten this year’s production onf winter-run and fall-run Chinook salmon in the upper Sacramento River below Shasta Reservoir.

The 2026 TMP proposed relaxing the requirements for salmon under the National Marine Fisheries Service’s (NMFS) 2024 LTO Biological Opinion for the Long-Term Operation (LTO) of the Central Valley Project and the State Water Project. Reclamation implemented TMPs under the LTO Biological Opinion in 2024 and 2025. 2024 and 2025 were similar water years that, like 2026, had above-average April storage in Shasta Reservoir. Part of Reclamation’s stated rationale is that 2026 had a low snowpack and thus a smaller cold-water pool in Shasta Reservoir.

Reclamation moved ahead with the 2026 TMP despite not receiving the approval of the State Water Board. The conflict with the Board is mainly over the target end-of-September (EOS) storage in Shasta Reservoir, with Reclamation planning for a 2.2 million acre-feet (MAF). The “Shasta Framework” in the LTO Biological Opinion calls for EOS Shasta storage of 2.4 MAF.

Also at issue is Reclamation’s ability to fulfill the TMP’s commitment to maintain a water temperature of 53.5°F at the Clear Creek gage near Redding through October 31 to protect salmon reproduction. Reclamation has achieved that temperature through July. A cooler than normal spring helped sustain the cold-water-pool supply. However, Reclamation is rapidly using up the cold-water pool by meeting high contractor water demands, by using cold water from Shasta to offset the import of warm Trinity-Whiskeytown water (about 15-20% of total Keswick Dam releases to the upper Sacramento River), and by maximizing peaking-power production at Shasta Dam.

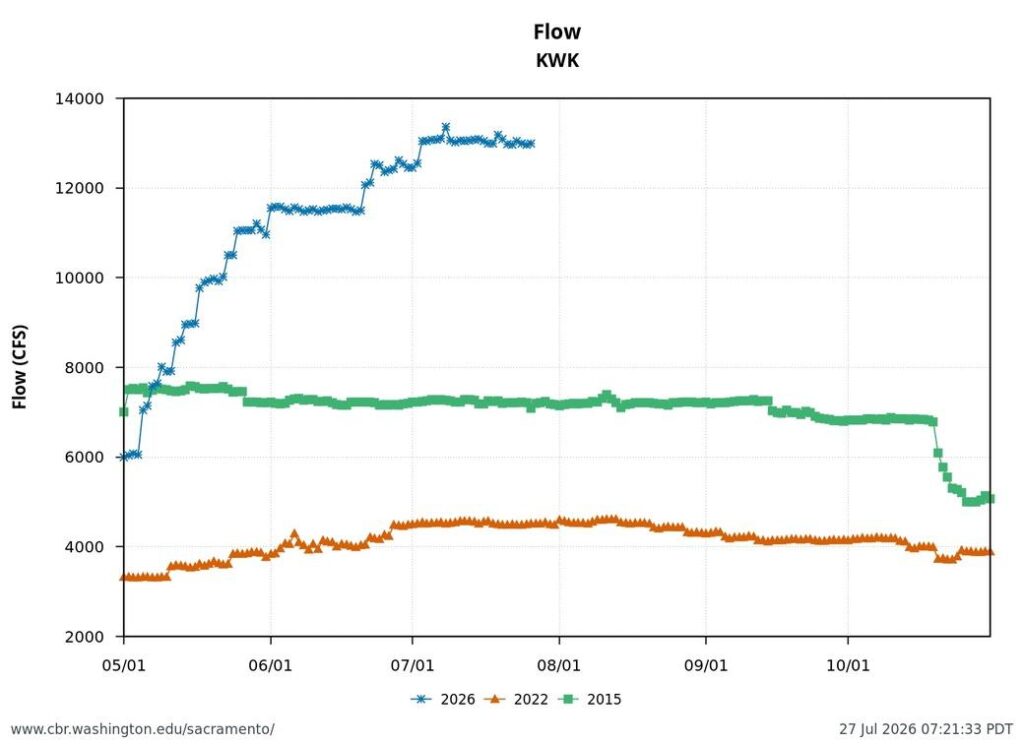
Keswick Dam releases in July are a steady 13,000 cfs, providing approximately 6,000 cfs of contractor demands and 7,000 cfs flows and 68°F target water temperatures in the lower Sacramento River (at Wilkins Slough gage above the mouth of Feather River). At that rate, EOS Shasta storage of even 2.2 MAF will be difficult to achieve without exceeding agreed-to water temperature conditions. Reclamation will prematurely exhaust Shasta’s cold-water pool (Figure 1). Target water temperatures in the lower Sacramento River will be exceeded, as in past years.

Comparison of 2026 with Water Years 2024 and 2025, and Drought Year 2022

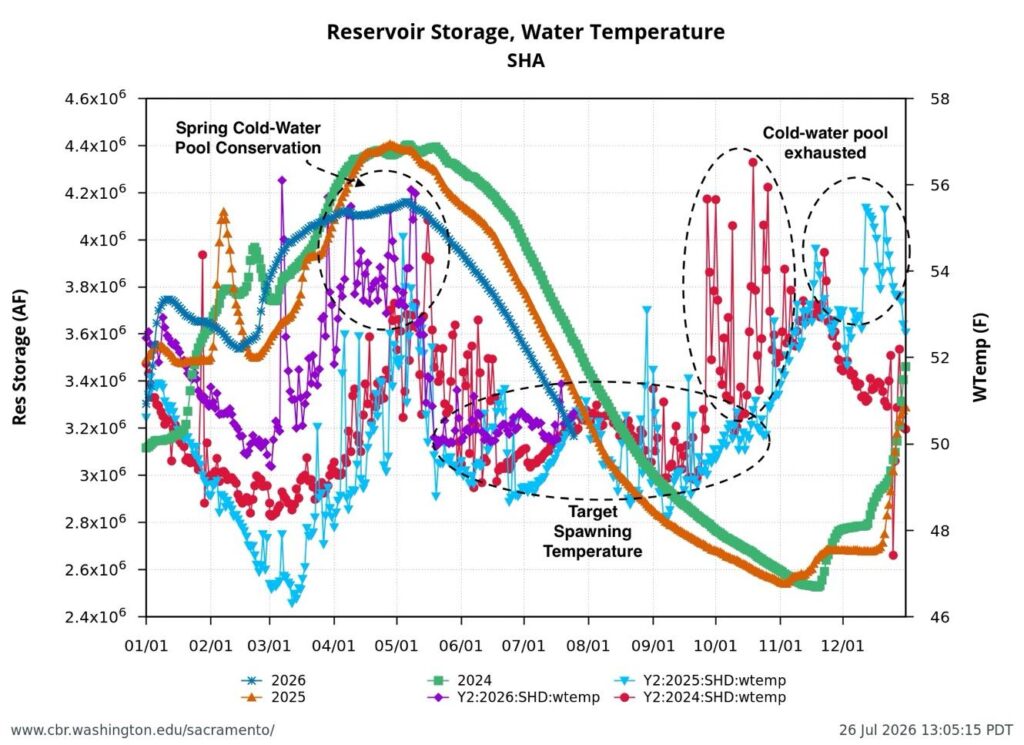
At the beginning of spring 2026, there was less snowmelt and a smaller cold-water-pool volume in Shasta Reservoir than there had been in 2024 and 2025 (Figure 2). The spring cold-water-pool conservation period was warmer, but the cold-water release target nevertheless started promptly on May 15. It will continue through October 31, unless the cold-water pool is depleted in September or October, as occurred in 2024.

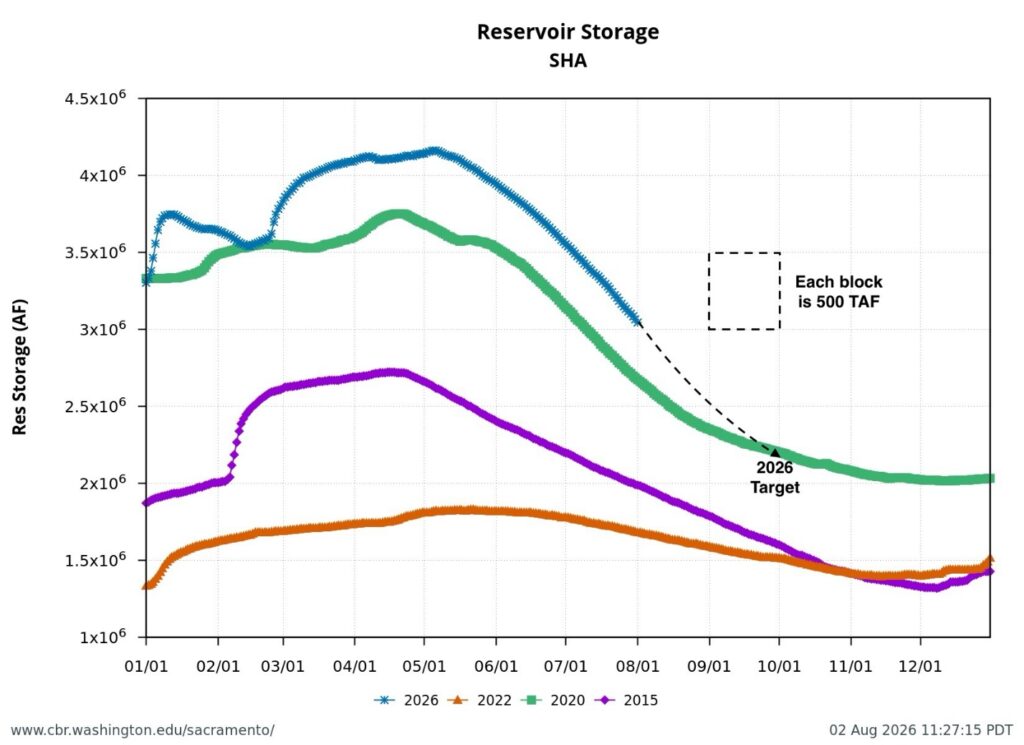
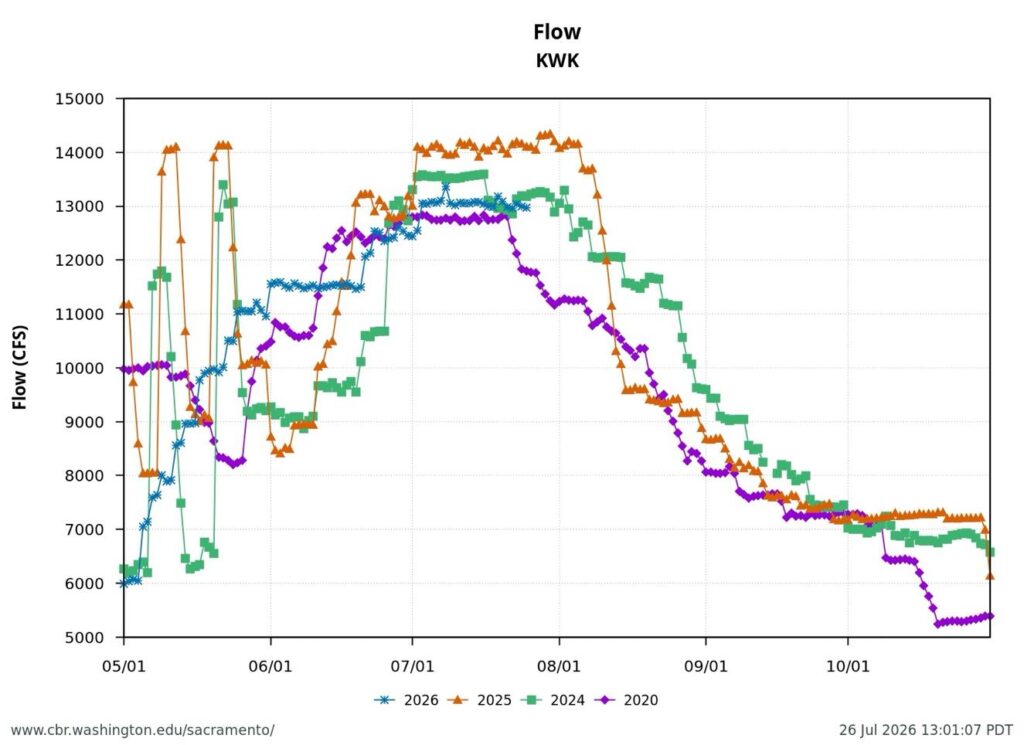
Reclamation’s 2026 TMP is comparable to water year 2020 TMP, a dry water year (Figure 3). In 2020, the EOS storage was close to the 2.2 MAF target, but Reclamation failed to preserve the cold-water pool. Beginning in September and lasting through November, Reclamation released water from Keswick Dam that exceeded the temperature target in the 2020 TMP. The failure to sustain the cold-water supply increased mortality during the spawning and early incubation season of the winter-run salmon (September-October) and fall-run salmon (October-November).

Summary

In 2026, Reclamation must at minimum immediately revise its TMP to include the following criteria:

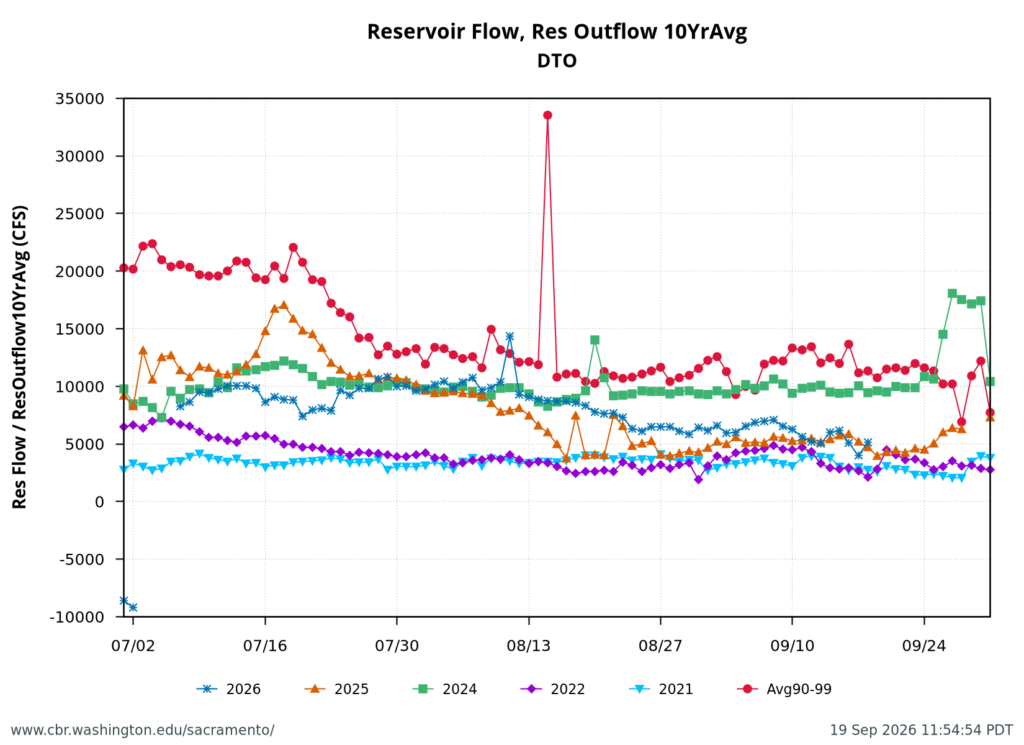
  • Reclamation must revise its present plan for contractor water deliveries. Otherwise, Reclamation will not meet temperature requirements to protect the salmon through the end of the irrigation season and beyond. Reclamation will have to reduce water deliveries to the 2020 levels or less to save the cold-water-pool supply and meet temperature criteria (Figure 4). The cold-water-pool supply in late July is at the drought year 2015 and 2022 level (see Figure 1), yet the Shasta Dam cold-water release is triple the 2022 level and double the 2015 level (Figure 5).
  • Reclamation must maintain water temperatures at a maximum of 53.5°F and 56°F at the Clear Creek and Balls Ferry gages, respectively, through October.
  • Reclamation must maintain maximum water temperatures of 68oF at the Wilkins Slough gage in the lower Sacramento River.
  • Reclamation must meet a target Shasta Reservoir EOS storage of 2.4 MAF.

Figure 1.

Figure 2. Shasta Reservoir storage and release temperature 2024-2026 with annotations.

Figure 3. Shasta Reservoir storage and release temperature 2020-2022 with annotations.

Figure 4. Keswick Dam releases (cfs) May-Oct 2020 and 2024-2026.

Figure 5. Daily average flow release (cfs) from Keswick Dam May-Oct 2015, 2022, and 2026.

June 2026 – Reclamation’s Approach to Compliance with Sacramento River Water Quality Standards and Permit Requirements

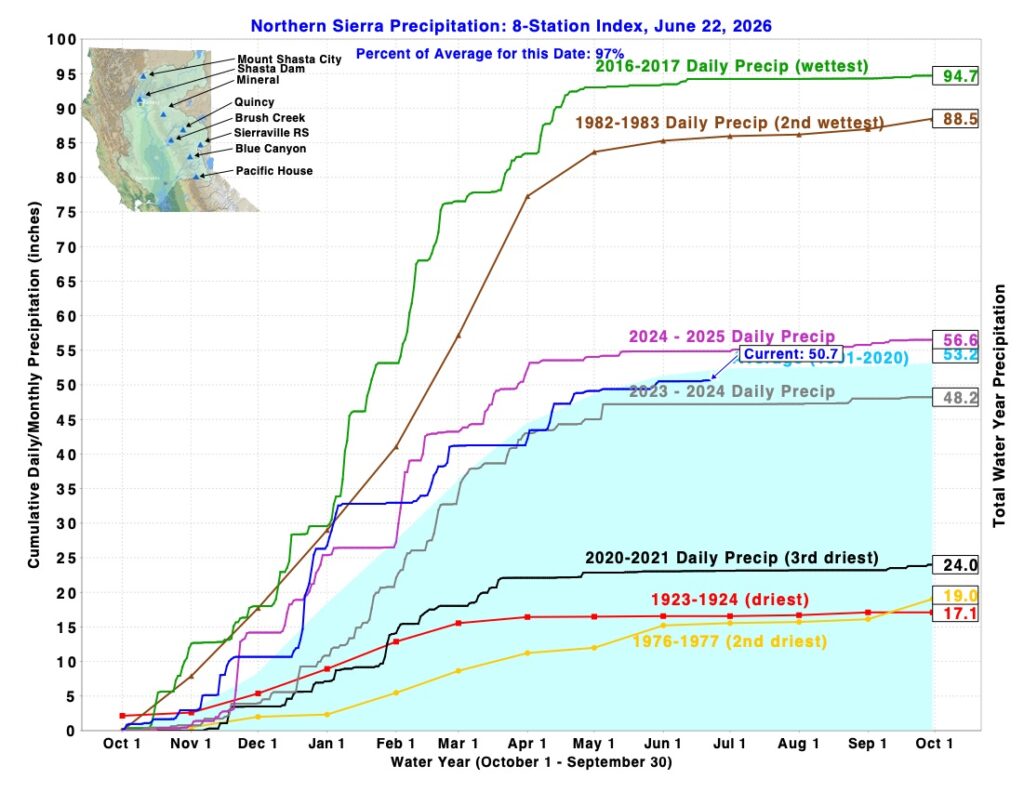
Water year 2026 is an average or normal year in terms of total precipitation, similar to 2024 and 2025 (Figure 1).

On April 29, 2026, the Bureau of Reclamation sent a Draft Sacramento River Temperature Management Plan (TMP) to the State Water Resources Control Board (State Board) for review. The Draft TMP stated that it would manage Shasta Reservoir (near Redding) in 2026 according to a drier-year standard than the amount of actual storage in Shasta Reservoir required on paper. The requirement is given in the National Marine Fisheries Service’s 2024 Biological Opinion for the Long-Term Operation of the Central Valley Project and State Water Project (LTO).

Reclamation explained that it based its classification of 2026 on the “Action 5” Operations Plan for the LTO. Action 5 is Reclamation’s modification of the 2024 LTO Biological Opinion. Reclamation adopted Action 5 in December 2025 to comply with a January 2025 presidential order to increase water deliveries.

The Draft TMP also proposed locations on the Sacramento River where Reclamation would meet water temperatures to support spawning and egg incubation of winter-run Chinook salmon. June is the peak spawning season for winter-run salmon below Shasta Dam.

The State Board responded to Reclamation on May 15, 2026 with a comment letter on the Draft TMP.  The State Board’s comments requested additional analyses, including reduced deliveries and increased end-of-September storage in Shasta Reservoir.  On June 1, 2026, Reclamation issued a Final TMP whose proposed operations were functionally the same as those that Reclamation proposed in the Draft TMP.

On June 10, 2026, the Executive Director of the State Board sent a response to the Final TMP to Reclamation “objecting to the final TMP as per the language in Water Rights Order 90-5.” However, the Executive Director’s response does not specify any specific actions the State Board will take against Reclamation. Instead, it requires Reclamation to meet 53.5ºF in the Sacramento River at Clear Creek (River Mile or RM 290) through the summer and to report to the State Board when water temperatures do not meet 56ºF at Balls Ferry (RM 276). 53.5ºF in the Sacramento River at its confluence with Clear Creek provides about ten miles of river with water cold enough for salmon eggs.

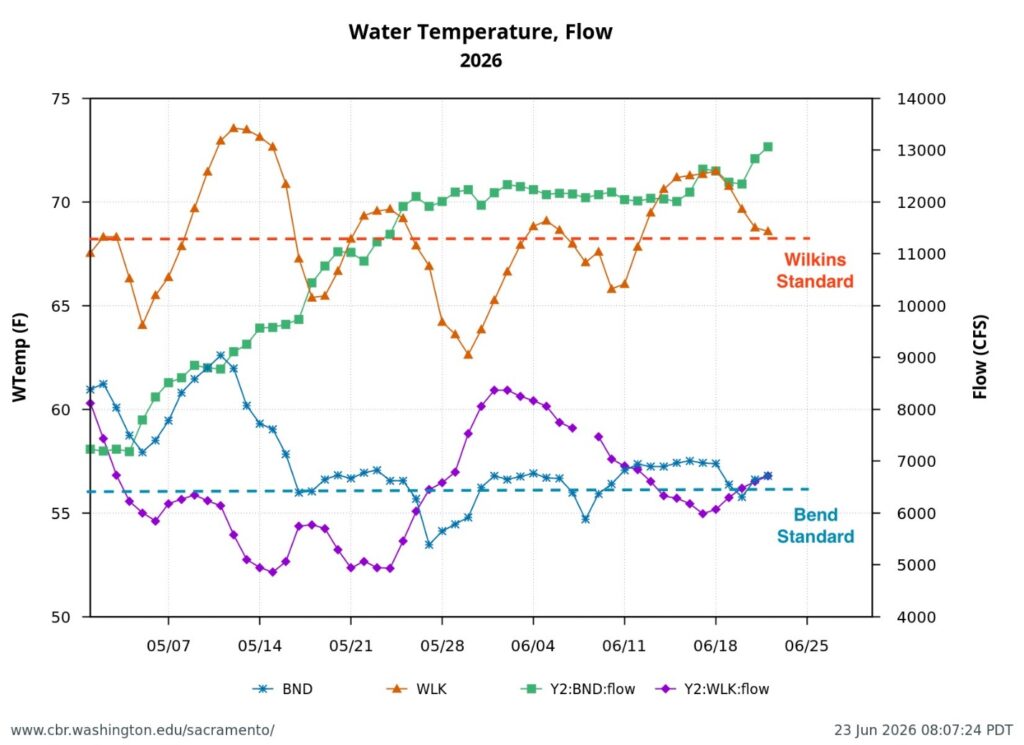
In June 2026, Reclamation released water from Shasta Reservoir to maintain Sacramento River temperatures at 56ºF at Bend Bridge (RM 258). Also in June, Reclamation released enough water to deliver approximately 6000 cubic feet per second (cfs) of water to its contractors along the Sacramento River (Figure 2).

The State Board’s main problem with Reclamation’s TMP is the high amount of Shasta releases (approximately 12,000 cfs, or 24,000 acre-feet per day) to meet both the temperature standards and contractor demands. Those releases are expected to increase in July. In combination, this level of release could deplete Shasta’s cold-water pool before the end of the salmon spawning and incubation season.

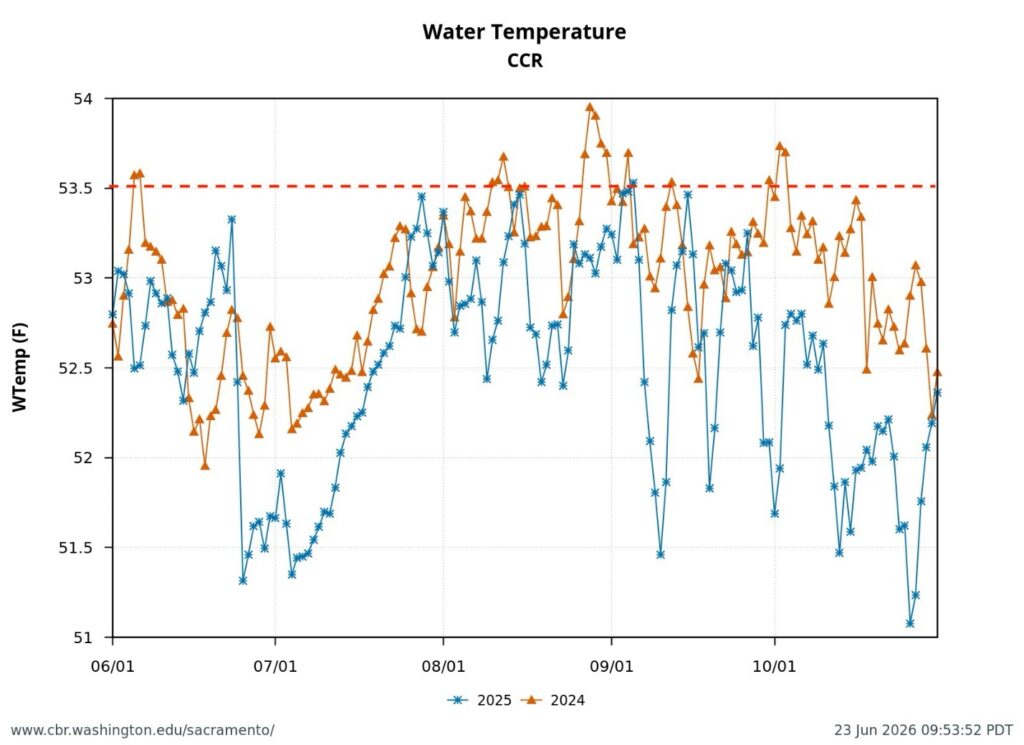
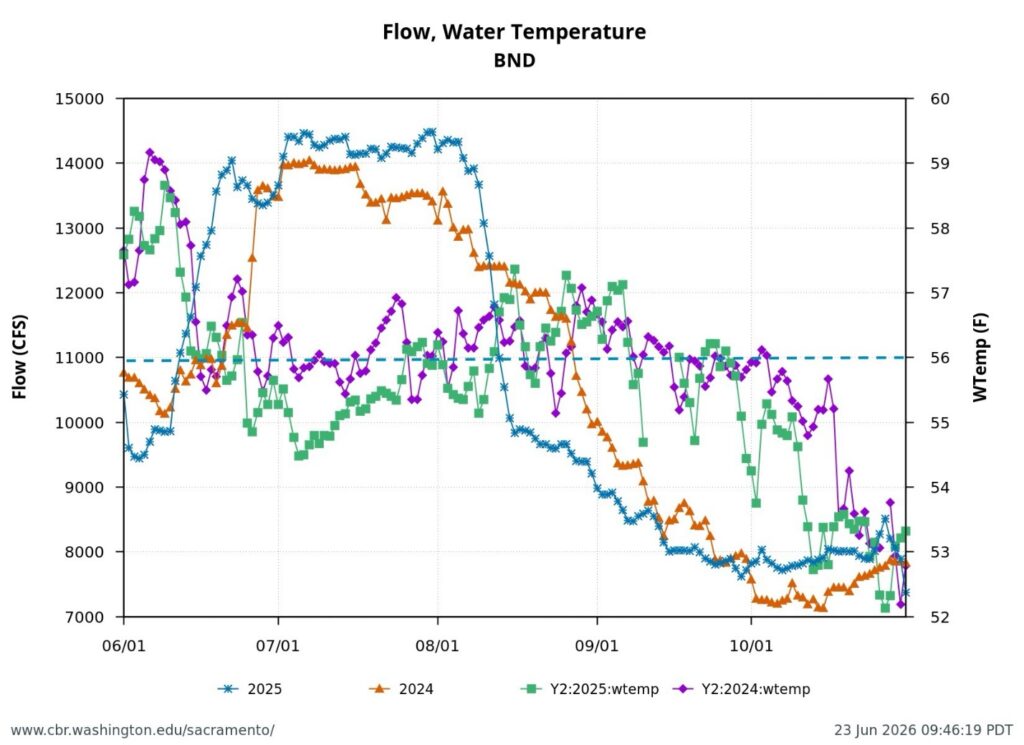
The Board is concerned because prior-year TMPs failed to maintain Shasta’s cold-water pool through the salmon spawning seasons (Figure 3 and 4). Spawning success of fall-run salmon and winter-run salmon was compromised in past years with relatively average precipitation.

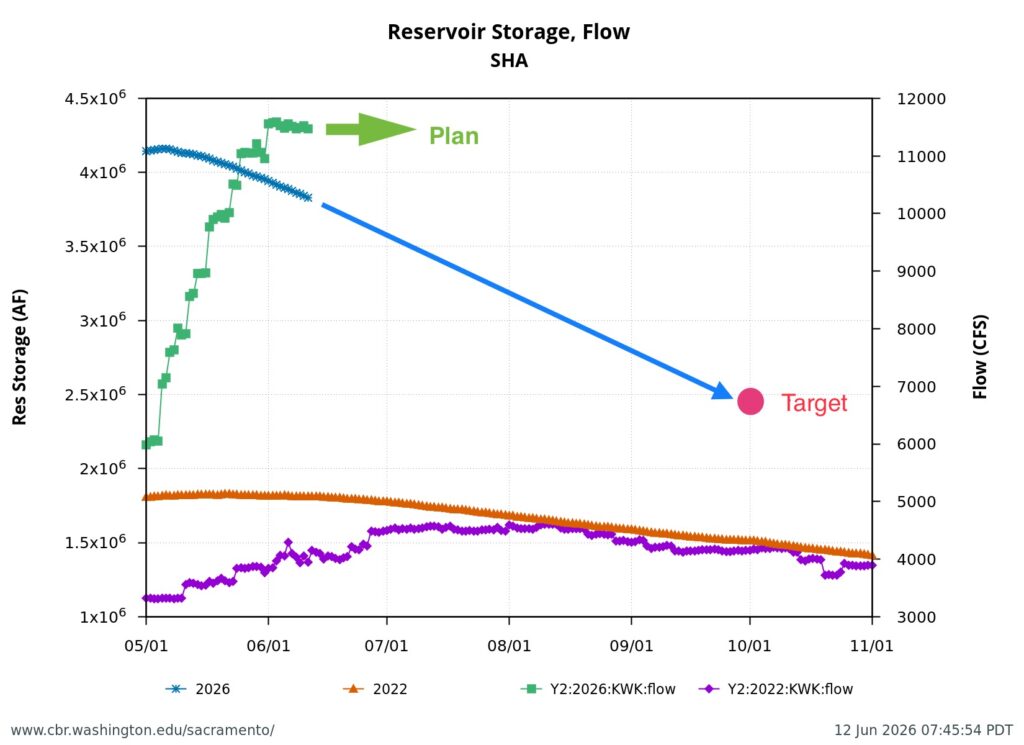
The challenge is to make sure there’s enough water for all uses through autumn. The State Board wants a plan that targets 2.4 million acre-feet of storage in Shasta Reservoir at the end of September, as shown in Figure 5. This is the amount shown on paper in the Biological Opinion that governs Shasta Reservoir. It is unclear how, even with Reclamation’s “Action 5” modification of the Biological Opinion, Reclamation arrived at its proposed lower end-of-September storage level.

Achievement of end-of-September Shasta storage of 2.4 million acre-feet could mean cutting back on scheduled water deliveries or finding a balance with river flows and water temperature goals.

Other possibilities to reduce summer and autumn water temperatures in the Sacramento River include adjusting the timing and volume of water Reclamation imports from the Trinity River to the Sacramento River through Whiskeytown Reservoir. They also include modifying Reclamation’s hydropower operations at Shasta Dam; Reclamation’s turbines sometimes draw water from relatively warm parts of Shasta Reservoir.

Figure 1. Eight-River Index in June 2026 compared to past years. Source: CDEC.

Figure 2. From May 1 through mid-June 2026, Reclamation did not meet water temperature standards in the upper Sacramento River at the Bend Bridge (BND) or in the lower Sacramento River below Wilkins Slough (WLK). In mid-May and mid-June, Reclamation was delivering about 6000 cfs to contractors from the Sacramento River upstream of Wilkins Slough.

Figure 3. Sacramento River water temperature at Clear Creek gage near Redding June through October 2024 and 2025. Dotted red line is water temperature target of temperature management plans in 2024 and 2025.

Figure 4. Sacramento River water temperature and streamflow at Bend Bridge gage near Red Bluff June through October 2024 and 2025. Dotted blue line is water quality standard and permit requirement for water temperature. Note general lack of compliance in June, August, and September of both years. Note also drops in flow from14,000 to 8,000 cfs over the summer can lead to winter run salmon redd dewatering and winter-run egg and alevin mortality.

Figure 5. Shasta Reservoir water storage and releases in drought year 2022 and average year 2026. The State Board wants a Temperature Management Plan from Reclamation that meets a target end-of-September storage of 2.4 million acre-feet.

May 2026 Blue Moon contributes to Poor Bay-Delta Habitat Conditions

This post is a follow-up to a prior post on early spring conditions in the Bay-Delta in 2026.

May 2026 featured five primary lunar phases, including two full moons. The first full moon (Flower Moon) peaked on May 1, followed by the third quarter on May 9, a super new moon on May 16, and the first quarter on May 23. The month closed with a second full moon (a micro blue moon) on May 31.

These phases of the moon worsened the consequences, for fish and water quality, of water operations by the Bureau of Reclamation.

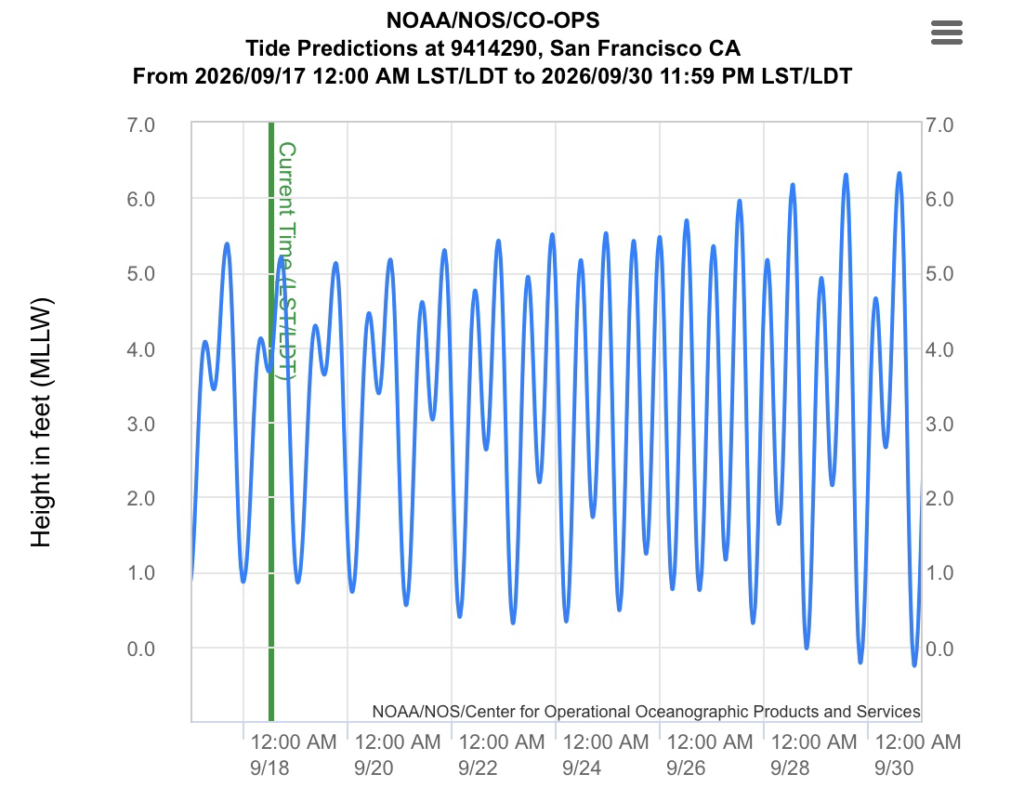
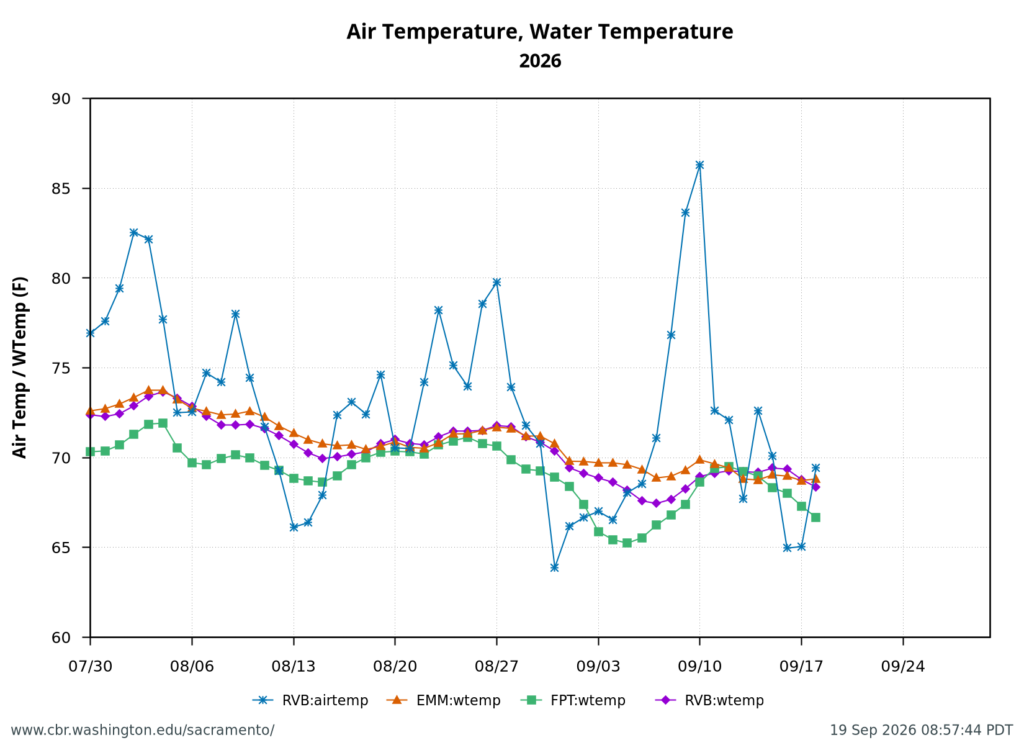
First, the poor May Delta habitat conditions resulted from low Delta inflow – unusually low Sacramento River inflows to the Delta at Freeport (Figure 1). The low inflow, in conjunction with a late spring heatwave, led to high north Delta water temperatures (Figure 2).

Second, low Sacramento River flows and high water temperatures upstream of the Delta (Figure 3) also contributed to the poor Delta conditions.  Water temperature at Wilkins Slough reached daily-average 74oF mid-month, six degrees above the water quality standard, under flows less than 5000 cfs.

Third, the mid-month super new moon and end-of-month blue moon contributed to the higher river channel stages (Figures 4 and 5) in the north Delta that pooled the warm freshwater inflows and contributed to further warming during the late May “heatwave”.

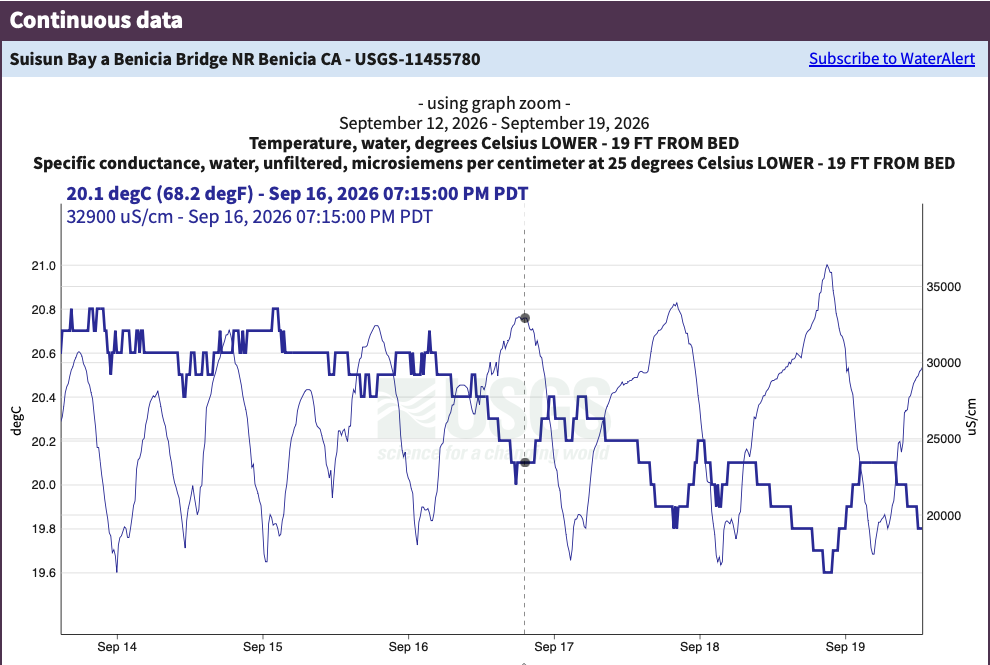
Fourth, a consequence of the warming in the north Delta was warming in the west Delta (Emmaton, Figure 6) and eastern Suisun Bay (Collinsville, Figure 7).

The poor habitat conditions caused significant stress on late immigrating winter-run and spring-run adult salmon and late emigrating salmon smolts. The poor conditions also reduced the likelihood of successful reproduction for sturgeon and smelt..

The suboptimal habitat conditions observed in the lower Sacramento River, Delta, and Bay were preventable. The Bureau of Reclamation could have mitigated these conditions by maintaining Sacramento River flows within a 7,000–10,000 cfs range, north Delta Freeport flows between 15,000–20,000 cfs, and Rio Vista daily-average flow and Delta outflow at approximately 10,000 cfs (Figure 8).

An added 3,000–5,000 cfs (6,000–10,000 acre-feet per day) flow was needed in late May 2026 to avoid the poor conditions. That amount is approximately 2 to 3 percent of Sacramento Valley water project reservoir end-of-April storage, or about a quarter to a third of May water contractor deliveries.

On paper, Reclamation must manage the flows necessary to comply with water quality standards, water right permit requirements, and endangered species take permits. However, Reclamation’s adherence to these regulations has diminished significantly over the past twenty years.

More recently, Reclamation’s operations have become substantively worse for fish under its “Action 5” interpretation of the Biological Opinion for the Central Valley Project. Reclamation adopted Action 5 in December 2025, in response to the Presidential  Executive Order 14181 that requires federal agencies to “override existing activities that unduly burden efforts to maximize water deliveries.”

Figure 1. May 2026 Sacramento River hourly Delta inflow at Freeport gage. Also shown in daily average for prior 67 years. Data source: USGS.

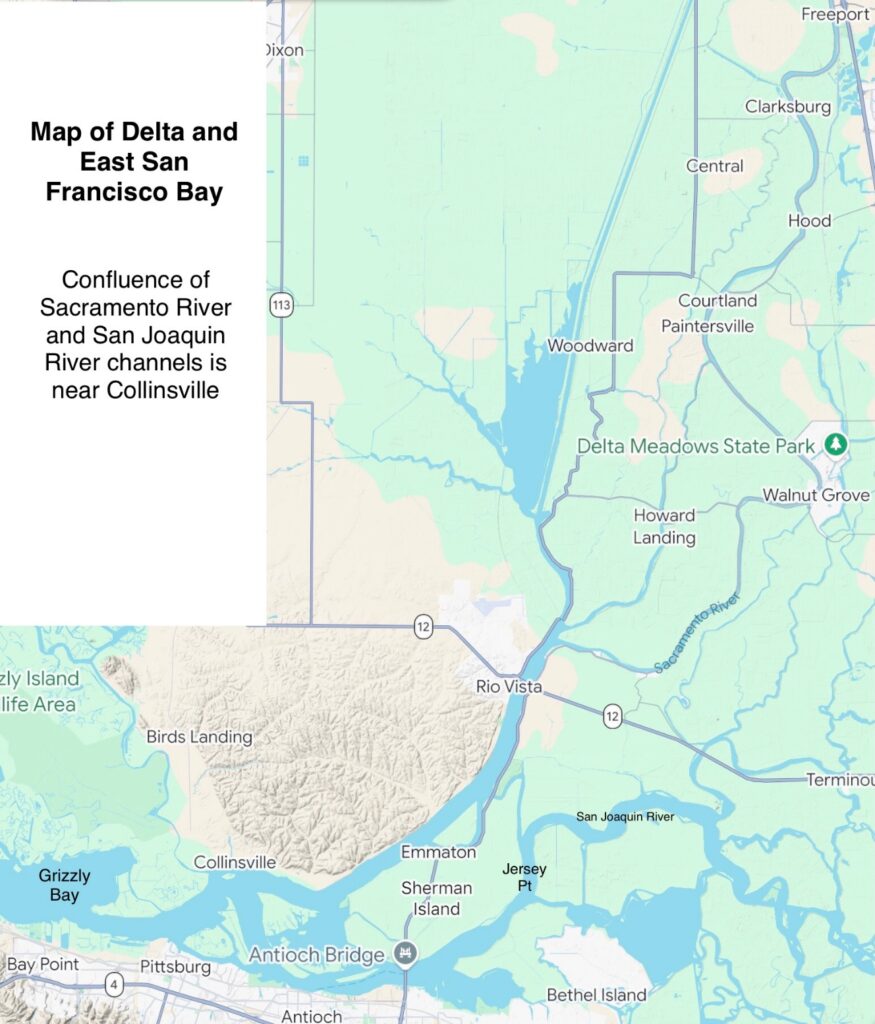
Figure 2. May 2026 air and water temperatures in the Sacramento River channel of the north Delta at Freeport (FPT), below the entrance to Georgianna Slough (GES), and the Rio Vista Bridge (RVB). Data source: CDEC. See map for locations.

Figure 3. Sacramento River flow and water temperatures in May 2026 at Keswick (KWK), Bend (BND), Colusa (COL), and Wilkins Slough (WLK). Note the difference between upper and lower river flow is from 4000-5000 cfs, due to water contractor deliveries.

Figure 4. May 2026 Delta outflow (DTO) and average-daily river stage (water surface elevation) at the Rio Vista Bridge (RVB) and Jersey Point (SJJ). See map below for stage locations. Note mid-May decline in outflow and increase in stage occurred as a result seasonal tide changes – the result of the mid-May super new moon and the end-of-May blue moon.

Figure 5. Hourly tide stage at Rio Vista Bridge gage in April-May 2026. Note peak stage (water surface elevations) were about ten days before the two May full moons (1st and 30th).

Figure 6. Sacramento River channel hourly water temperature at the Emmaton gage in May 2026.

Figure 7. Sacramento River channel hourly water temperature at the Collinsville gage in eastern Suisun Bay in May 2026.

Figure 8. Daily average (tidally filtered) streamflow at the Rio Vista Bridge in May 2026.

Map of North Delta and Sacramento River Channel

Flood Bypasses are Key to the Future of Wild Salmon in Sacramento River Valley Initial success of the Fremont Weir Big Notch

The Big-Notch Project at the Fremont Weir came online in late 2025. In this post, I describe events in December 2025 that provided improved access for juvenile salmon to floodplain habitat in the Yolo Bypass through that new Big Notch.

The goal of notch projects at the Fremont and Tisdale weirs in the Sacramento Valley is to create greater access to floodplain habitats for juvenile winter-run Chinook salmon, as well as fall-run and spring-run, in the upper Sacramento River Valley. The Fremont Weir project, completed in 2025, now improves access for salmon into the Yolo Bypass. The Tisdale Weir notch project, when completed, will improve access of upper Valley salmon populations into the Butte Basin and the Sutter Bypass floodplains.

Background on Floodplains and Butte Creek

The recovery and success of Sacramento River winter-run Chinook salmon is tied to floodplain rearing and smolt production in the wettest years. There is great potential improvement for the survival of endangered winter-run salmon by providing improved rearing access to the Sutter and Yolo flood bypasses.

The remarkable recovery of Butte Creek’s wild spring-run Chinook salmon at the turn of the 21st Century provides an excellent example.

The turnaround in Butte Creek followed a decade of restoration activity in the creek and its floodplain by the US Fish & Wildlife Service, the California Waterfowl Association, the Nature Conservancy, CalTrout, Friends of Butte Creek, duck clubs, rice farmers, and many other collaborators.1 The secret to the success was opening the Butte Basin and Sutter Bypass so that juvenile salmon could rear in the floodplain habitat in early winter. This led to accelerated growth and high survival, which in turn allowed early entry of smolts into the ocean by late winter and early spring.

How the Fremont Weir Big-Notch Project Worked in its First Year

The first significant winter rains of 2025 brought a strong pulse of flow to the lower Sacramento River in late December (Figure 1). That pulse began entering the Big Notch at the Fremont Weir on December 21st (Figure 2). River flow (and flow exiting the Sutter Bypass) passed through the Big Notch through the end of December. River flow was only high enough to overflow the entire Fremont Weir on Dec 27 and 28 (Figure 3). Thus, most of the water flowing into the Bypass at the Fremont Weir passed through the Big Notch. Lesser but substantial amounts of warmer water also flowed into the north Yolo Bypass via the Knights Landing Ridge Cut (Figure 4).

Overflows into the Yolo Bypass (also including the Sacramento Weir) rapidly fill the Bypass (see maps). The Bypass floods to depths of 8-10 feet (Figure 5). The slowing of flows and spread of shallow water leads to rapid warming (of the colder river water) in the flooded Bypass (Figure 6). The warming extends to the lower Sacramento River channel in the north Delta at the Rio Vista Bridge (Figure 7), downstream of the Yolo Bypass’s outlet.

The warmer shallow Bypass habitats (optimal growth 52-56ºF) have high food production that supports increased growth and survival of juvenile winter-run emigrating to the ocean. Substantial numbers of juvenile winter-run salmon likely entered the Yolo Bypass during the December event through the new Big Notch (Figures 8 and 9).  The access to the floodplain habitat likely contributed to the higher winter-run smolt 2025 index of the winter-run Juvenile Production Estimate (JPE, Figure 10) and the annual Chipps Island Trawl Survey index (Figure 11). Winter overflows into the other flood bypasses and the relatively wet water year 2025 also contributed.

The Benefits of Notches in Flood Bypass Weirs

The principal benefits of weir notches are that they allow water to enter flood bypasses (overflows) at lower river stages (at stages up to 10 feet or lower), and thus earlier in the late fall or winter. These systems can also enable overflow events during dry winter seasons that would not typically experience overflows. They also allow overflows later in the winter season to enhance adult and juvenile migrations of all the salmon runs through the bypasses (Figures 12 and 13).

The notches can also sustain overflows between periods of normal weir overflows. This not only sustains the access, but also reduces potential for stranding of adult and juvenile salmon. It also maintains good habitat conditions, minimizing overheating or disconnection of bypass habitats.

The broader overall benefits of weir notches are improved smolt production to the ocean, greater sustainable ocean harvest, and improved spawner numbers (escapement).

Map of Sacramento River Valley with Flood Weirs and Bypasses.

Map of Yolo Bypass – (Note fishery monitoring program sites.)

Map of Colusa Basin Drain and Yolo Bypass Tule Canal flow pathway to Rio Vista Bridge.

Figure 1. Streamflow in the lower Sacramento River below Wilkins Slough in December 2025. Source: CDEC.

Figure 2, Streamflow in the Yolo Bypass downstream of the Big Notch in the Fremont Weir.in December 2025. Source: CDEC.

Figure 3. Overflow into the Yolo Bypass at the historical Fremont Weir in December 2025. Source: CDEC.


Figure 4. Streamflow in the Ridge Cut Slough (Colusa Basin Drain connection to the upper Yolo Bypass below the Fremont Weir in December 2025.

Figure 5. Stage in the Tule Canal of the Yolo Bypass at Lisbon gage in December 2025.

Figure 6. Water temperature at the Lisbon gage in the Yolo Bypass in December 2025.

Figure 7. Daily average air and water temperature and river stage at the Rio Vista Bridge of the Sacramento River channel of the north Delta in December 2025. Source: CDEC.

Figure 8. Daily catch of older salmon (non-fry, predominantly winter-run) in Tisdale Screw Trap and environmental conditions September 2025 to May 2026.

Figure 9. Daily catch of older salmon (non-fry, predominantly winter-run) in Sacramento River near Sacramento beach seines and environmental conditions September 2025 to May 2026.

Figure 10. Juvenile Production Estimate (JPE) of winter-run salmon entering the Delta by brood year.

Figure 11. Cumulative catch index of winter-run salmon in Chipp Island Trawl Survey In the east Bay by brood year.

Figure 12. Fry of spring-run and fall-run salmon would enter the Big Notch of the Fremont Weir under these conditions in January-February 2026. The Wilkins Slough flow of the Sacramento River of <30,000cfs indicates most of the flow that would enter the Bypass would be via the Big Notch. Note: Some flow at the Big Notch entrance would also come from the exit of the Sutter Bypass.

Figure 13. Flow (cfs) in the northern Yolo Bypass in winter 2026. Most of the flow came from the Big Notch. Bypass water temperatures (not shown) were best for salmon fry at 50-55ºF in the January period but reached stressful levels >65ºF in the March period.

The Importance of Big Springs to the Shasta River

Big Springs contributes streamflow, cold water, and volcanic nutrients to the middle and lower Shasta River. Although its contribution to the overall volume of the Klamath River is small (Figure 1), the cold, nutrient-rich flows originating from Mount Shasta’s source springs, combined with a gentle gradient, play a key role in making the Shasta River the most productive salmon tributary in the Klamath River watershed.

Streamflow

Big Springs is the major source of water for the Shasta River.  It’s 52ºF clear water supports salmon, steelhead, and trout in the middle and lower Shasta River.  Its 100-120 cfs base inflow makes up the predominant flow of the Shasta River in summer (Figure 2).

Much of the water sourced from springs in the watershed is diverted for agriculture or other human purposes. The primary uses are pasture irrigation, hay production, and livestock watering. Other purposes include bottled water production, domestic use, and city supply.

Water from the upper mainstem—both spring-fed and snowmelt—is stored in Lake Shastina and released gradually throughout the summer via a large canal and ditch system. Big Springs, which serves as the main source of spring water for the middle and lower river, is also diverted or pumped into irrigation systems through several small dams and distribution networks.

Notwithstanding its springs-fed sources, the Shasta River experiences ongoing streamflow shortages, especially during summer and fall in most years. Only exceptionally wet years provide enough water for both ranchers and fish. In dry years, nearly all water is allocated to agriculture, leaving the lower river and its main tributaries—such as Parks Creek, Little Shasta River, and Yreka Creek—almost completely dry. Salmon and steelhead manage to survive during these dry periods only in the middle sections of the Shasta River and in nearby large springs fed by Mt. Shasta’s snow fields or by leakage from Lake Shastina.

Before irrigation begins on April 1, base flows in the Shasta River are about 150 cubic feet per second (cfs). They drop to 10-20 cfs or less by summer (Figures 3 and 4). Flow recovers once irrigation ends after October 1. Most diversions in the mainstem Shasta River happen in the reach 10 to 20 miles downstream from Big Springs, as shown by streamflow data from Montague (Figure 5).

Water Temperature

Reduced flows result in elevated temperatures in the lower river, often above 65ºF. These high temperatures restrict salmonid habitat, survival, and smolt production. Unlike the nearby Scott River, dewatering and stranding aren’t major issues in the middle Shasta River’s spring-fed refuge. Instead, high water temperatures between Grenada and the mouth of the Shasta River at the Klamath River pose the main challenge. Historical temperature records at Yreka show that the lower river becomes almost uninhabitable for salmonids in summer, with temperatures reaching 20–25ºC due to low streamflows and warm agricultural runoff.

Data from the Grenada gage (Figure 6) show acceptable water temperatures (below 20ºC) when streamflows exceed 50 cfs. These levels would at least meet the minimum requirements for migrating adult fall-run Chinook salmon in late summer.

Most salmon and steelhead spawning and rearing occur in the middle stretches of the Shasta River below Big Springs, where cold, spring-fed water creates ideal habitat. However, during dry summers like 2021 (Figures 3 and 4), the amount of cold spring-sourced water that reaches Yreka is minimal due to upstream extraction.

Source of Nutrients

“The unique water quality of the Big Springs complex, and presumably other spring complexes associated with the Shasta River south of the Big Springs Creek-Shasta River confluence, was likely one of the largest contributing factors to high historical abundances and productivity of salmonids in the Shasta River.” (Jeffres, et. al. 2009.)

The Shasta River below the spring complexes is rich in natural sources of nitrogen (N) and phosphorus (P). These elements support high concentrations of aquatic invertebrates. This in turn contributes to the river’s historically high fish production (Jeffres, et. al. 2009).

Agricultural runoff is another source of nutrients. However, agricultural return flows often have elevated water temperatures, which, in combination with animal and plant waste, contribute to point sources of low dissolved oxygen in the stream.  Such conditions degrade salmonid spawning, rearing, and migration habitat.

Conclusion

Big Springs and other springs in the Shasta River system supply cold, high-quality water that supports salmon and steelhead populations. Maintaining an adequate amount of spring-fed water throughout summer is vital. Any assessment of river flow needed for salmon and steelhead should consider the source and quality of streamflow, as well as the location of springs in relation to specific reaches of the river. Flow, water temperature, and proximity to springs are all important.

Figure 1. Lower Klamath River with late May of wet year 2017 streamflows in red. Note Shasta River streamflow was only 140 cfs near Yreka, California. Data source: CDEC.

Figure 2. Selected Shasta River hydrology in late May of wet year 2017. Roughly 150 cfs of the 300 cfs total basin inflow was diverted for agriculture, with remainder reaching the Klamath River. Red numbers are larger diversions. The “X’s” denote major springs. Big Springs alone provides near 100 cfs. Of the 100 cfs entering Lake Shastina (Dwinnell Reservoir) from Parks Creek and the upper Shasta River and its tributaries, only 16 cfs was released to the lower river below the dam. Red numbers and arrows indicate larger agricultural diversions. Up to 15 cfs is normally diverted to the upper Shasta River from the north fork of the Sacramento River, west of Mount Shasta.

Figure 3. Streamflow during peak Chinook salmon spawning season in the lower Shasta River near Yreka CA in September and October of drought year 2021. Yellow markers show average for the day over 84 years of gage record.

Figure 4. Streamflow in the lower Shasta River near Yreka CA from April 2018 through June 2021. Yellow markers show average for the day over 84 years of gage record. Note the low streamflow in dry summer 2020 and spring-summer of drought year 2021.

Figure 5. Streamflow in the lower Shasta River near Montague CA from April 2019 through June 2021. Note the low streamflow (<30 cfs) in spring-summer of dry year 2020 and spring of drought year 2021.

Figure 6. Water temperature (hourly) in the lower Shasta River below Big Springs near Grenada CA July 2019 to June 2021. Source: CDEC.

Bibliography

Jeffres, C. A., R.A. Dahlgren, M.L. Deas, J.D. Kiernan, A.M. King, R.A. Lusardi, J.M. Mount, P.B. Moyle, A.L. Nichols, S.E. Null, S.K. Tanaka, A.D. Willis. 2009. Baseline Assessment of Physical and Biological Conditions Within Waterways on Big Springs Ranch, Siskiyou County, California. Report prepared for: California State Water Resources Control Board. https://watershed.ucdavis.edu/sites/g/files/dgvnsk8531/files/products/2021-11/Jeffres-et-al-SWRCB-2009.pdf

Shasta River Watershed Stewardship Report. 2018. Shasta Valley Resource Conservation District 215 Executive Court, Suite A, Yreka, CA 96097. Version 1.2 April 2018. https://ifrmp.org/wp-content/uploads/2021/10/SVRCD_2018_0548_Shasta_Watershed_Stewardship_Report.pdf#:~:text=Shasta%20River%20Watershed%20strongly%20influences%20groundwater%20chemistry%2C%20which%20is&text=Big%20Springs%2C%20Shasta%20River%20at%20the%20Montague%E2%80%90Grenada%20Bridge%2C%20and%20Shasta%20River