A Tale of Three Critically Dry Years – More Shasta Reservoir Solutions to Save Salmon

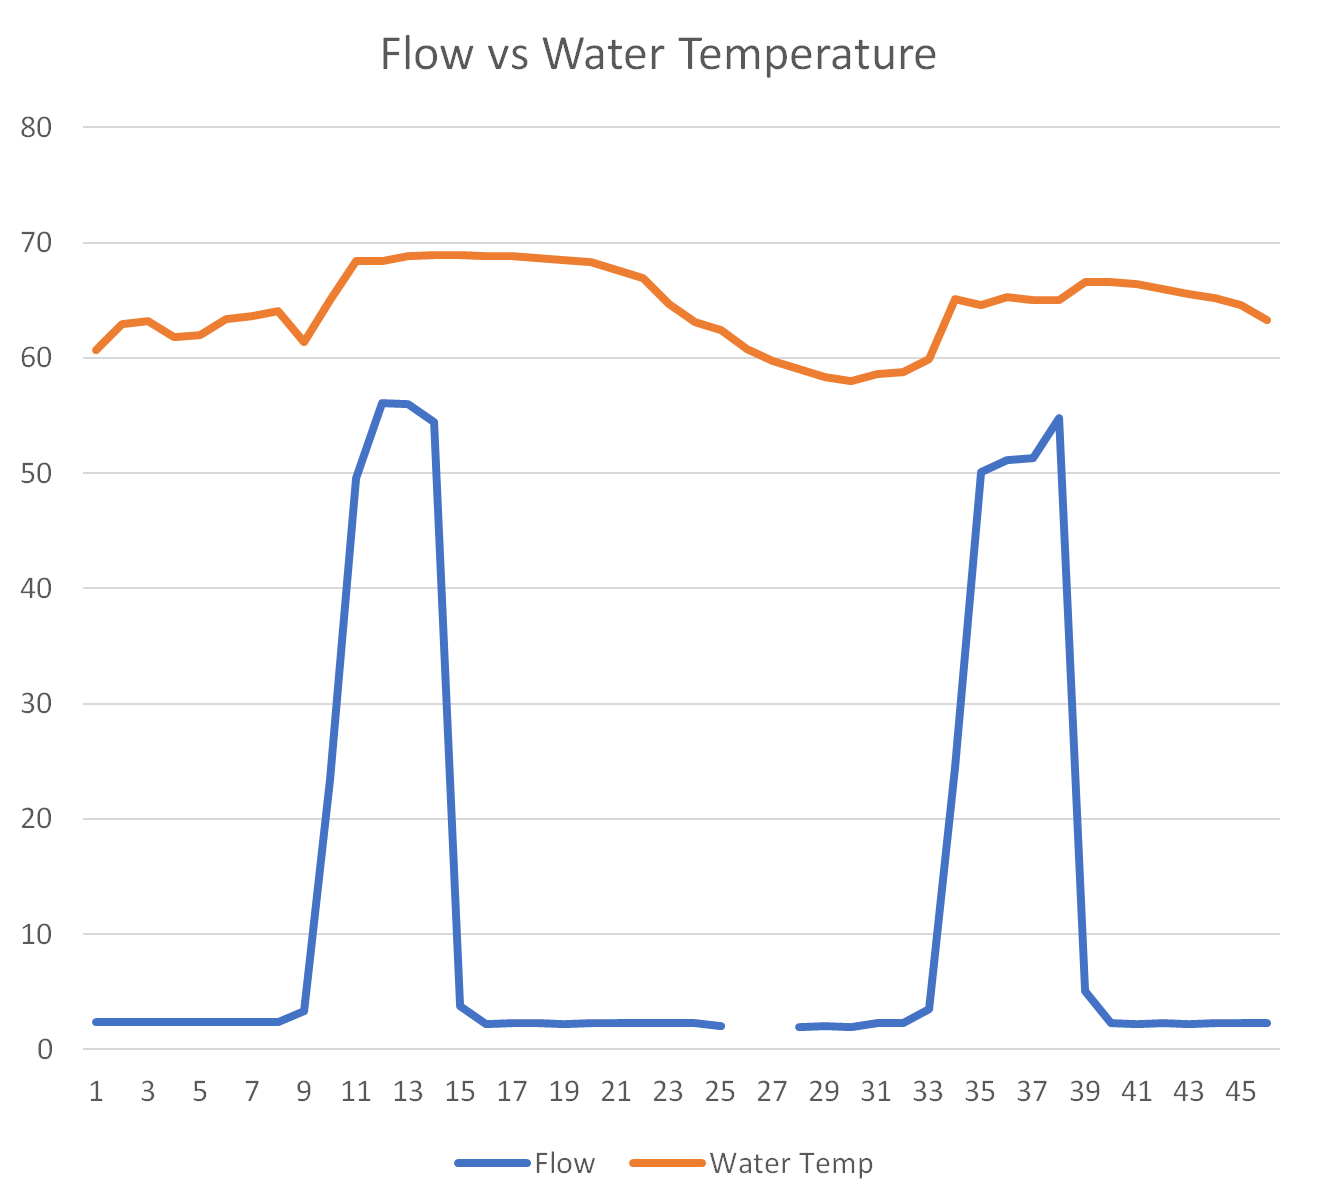
Shasta Reservoir is low again at the end of summer in drought year 2021.  The pattern is very similar to critically dry years 2014 and 2015 (Figure 1) that resulted in the loss of access to Shasta’s cold water and failure of the winter-run salmon spawn in the summer.  Year 2021 is leading to another failure of the winter-run salmon spawn and fry production.  Shasta’s cold-water pool supply is depleted, and river releases are too warm (Figure 2).  Water temperatures downstream of Shasta held in 2020 (Figure 2) despite high water releases (Figure 3), because 2020 had 1 million acre-feet more storage at the beginning of the year than either 2014 or 2021 (Figure 1).

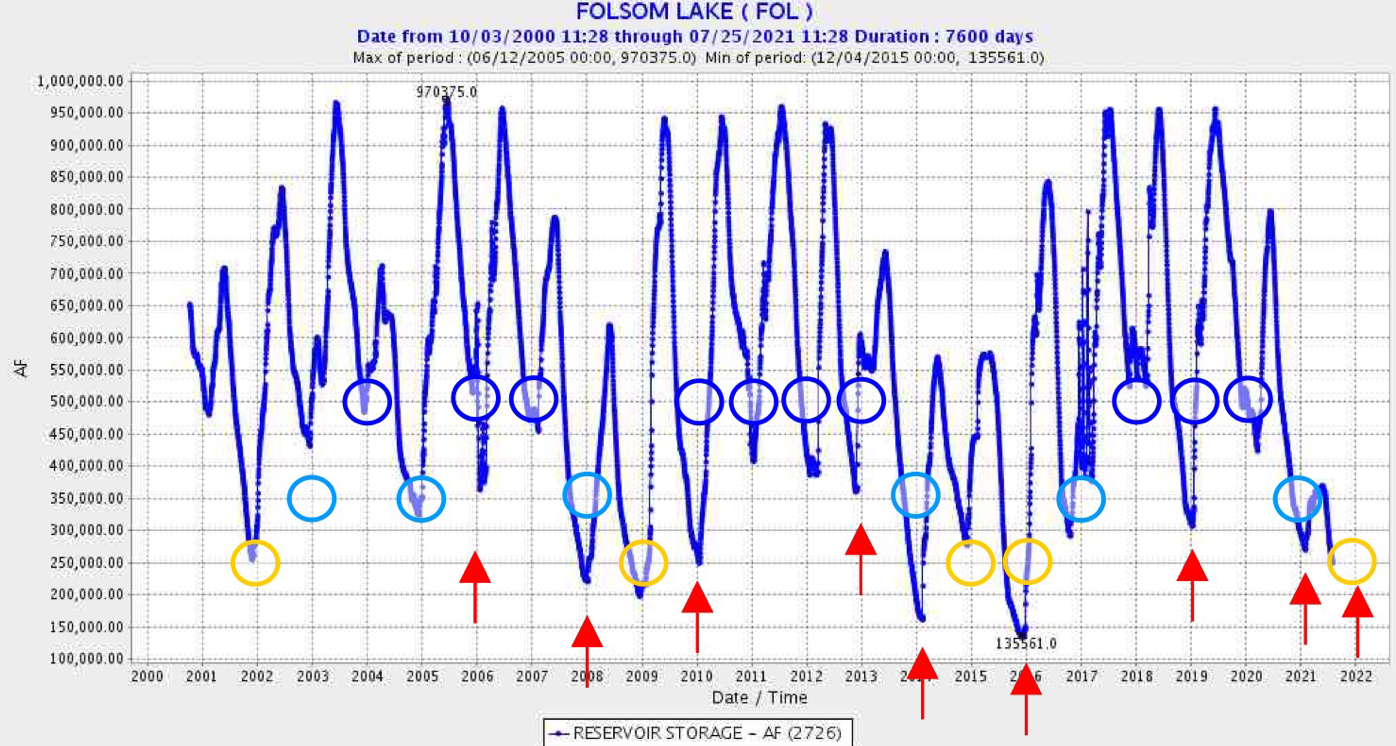
The three disaster years could have had different outcomes if as little as 300,000 acre-feet of additional storage had been available in 2013 and spring 2021.  If at the end-of-year 2013, storage had been 2 MAF rather than 1.7 MAF, and the additional 300,000 AF been carried into 2014 and 2015 and then used to protect fish, the 2014 and 2015 disasters could have been averted.  If the spring releases in 2021 had been minimized as in other drought years, then the 2021 disaster could have been averted.

One reasonable strategy for Shasta Reservoir’s storage problems is minimum end-of-year storage prescriptions based on initial storage and water year type, and limiting releases in spring after dry years when storage is at or below 2 MAF.  Goals should be set for the next year based on initial conditions end-of-year storage (Figure 1).  As stated in a previous post, it is no longer enough to set end-of-September storage targets.  Climate change means in part that more autumn months are very dry. Exports in the fall (and a transfer season now extended through November) pull down CVP storage or at least slow reservoir refill.  Storage at the end of November or end of December needs to an explicit part of the carryover calculus.  Figure 1 shows end-of-November as the requirement.

Proposed Operating Storage Rules

  • Wet Year – High ending storage required (3 MAF minimum e-o-y storage – 11, 17, 19);
  • After Wet Year – if following year turns normal or dry, but reservoir fills, target is 2.5 MAF e-o-y storage (12, 16, and 18); if reservoir does not fill, target is 2.0 MAF (13, 20);
  • Critical Year – if critically dry with low storage, target e-o-y storage is 1.25 MAF (14, 15, 21).

Proposed Operating Release Rule

  • After a Drier Year – if storage is at or below 2 MAF at the beginning of a year and is below 2.5 MAF by the end of March, then April-May Shasta Reservoir releases should be limited to sustain and support in achieving higher summer storage and an e-o-y storage of 1.25 MAF. This decision needs to be made in April, based on a conservative runoff forecast methodology.

 Past Performance 2011-2021

  • 2013-2015 – Critical Dry Years – In 2013, storage fell about 300,000 AF below the 2 MAF e-o-y target, leaving 2014 e-o-y at a deficit that carried over into 2015. That led directly to the loss of access to Shasta’s cold water in summer-fall 2014 and 2015.
  • 2021 – Critical Dry Year – In 2021, Shasta Reservoir failed to regain its starting storage, not because 2020 ended from a storage deficit, but because of excessive releases in April and May (Figure 3).

 In summary, the 2014, 2015, and 2021 salmon production disasters in the upper Sacramento River salmon spawning reach below Shasta Reservoir could have been averted by following simple reasonable criteria for end-of-year minimum storage and stricter criteria for storage releases in spring of drought years.   This presumes, of course, that Reclamation would not have otherwise misused the water thus saved.

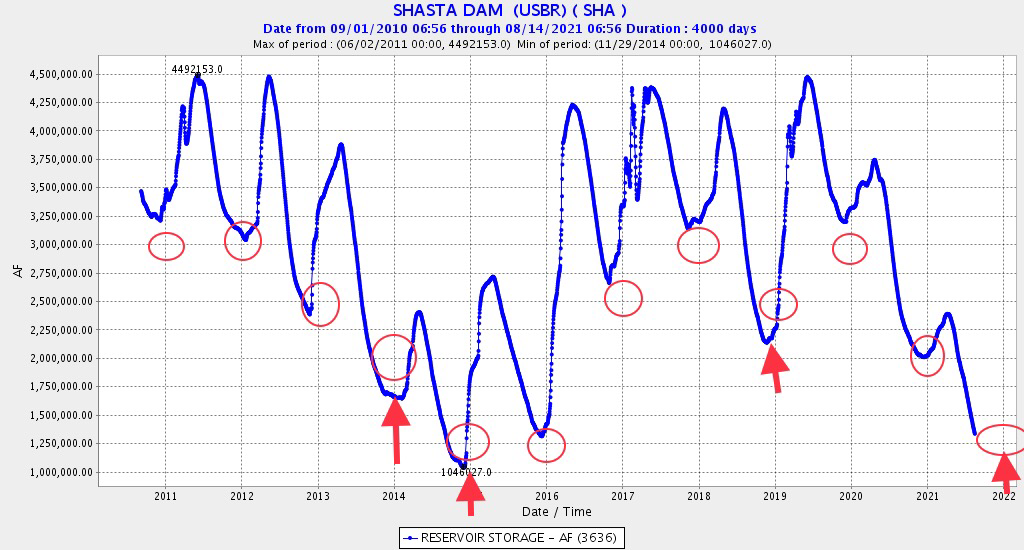
Figure 1. Shasta Reservoir daily-average storage levels in acre-ft, 2014-2021. Red circles are suggested minimum target criteria for those year types. Red arrows are years in hindsight the criteria were not met.

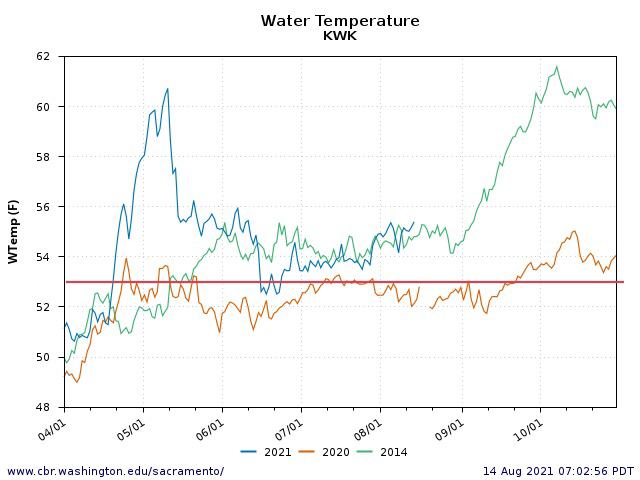
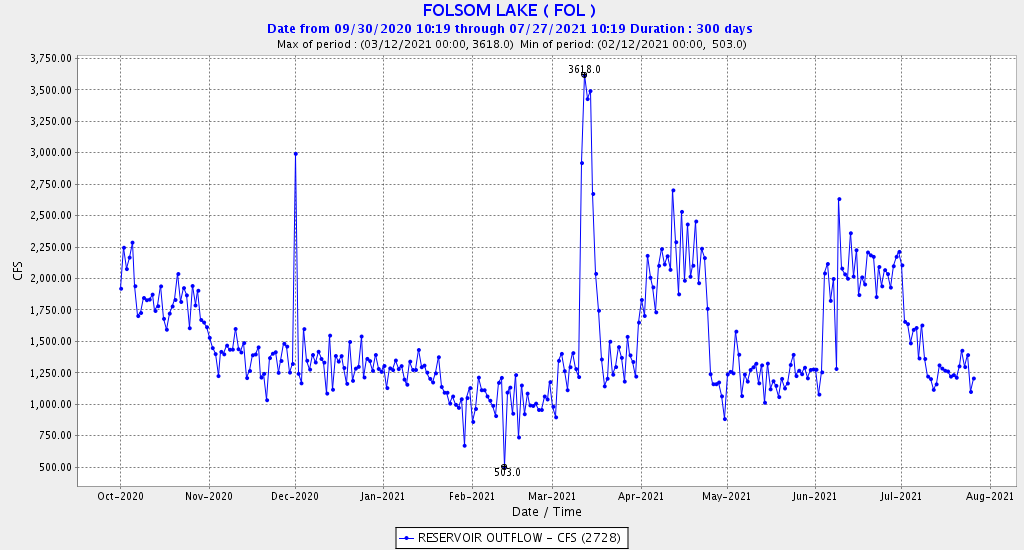
Figure 2. Keswick Reservoir release daily-average water temperature, May-October 2014, 2020, and 2021. Target maximum release temperature for salmon spawning in the 10-mile spawning reach below Keswick is 53oF (red line). Note Reclamation’s 2021 stated plan was to maintain target temperatures only at peak spawning in late June, but not in the early (late Apr-early June) or late (July-August) portions of the spawning period. Note also the lost access to the cold-water pool in September 2014 and October 2020. Access to the cold water is being lost in mid-August 2021.

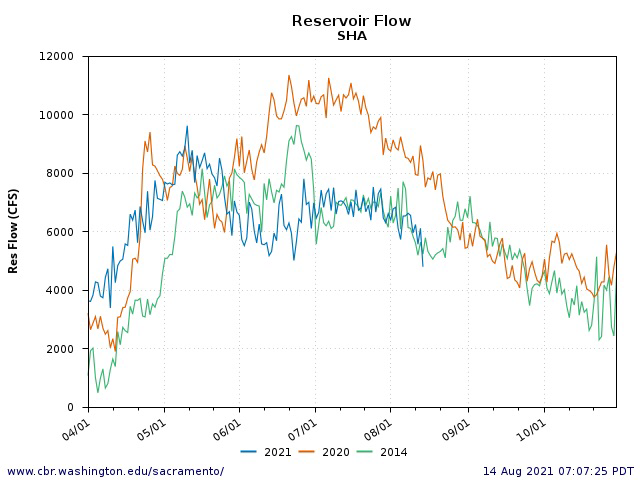
Figure 3. Shasta Reservoir releases April-October in years 2014, 2020, and 2021. Note high releases in spring 2021 compared to 2014 in April-May period (difference was 240,000 acre-feet).

American River Water Forum 2.0 – The Future for American River Salmon and Steelhead

Conditions in the lower American River have been bad all year, and are getting worse.1 Folsom Reservoir storage never recovered this spring and is critically low this summer (Figure 1). Releases from reservoir to the river have been low (Figure 2), resulting in excessively warm river water temperatures (Figure 3).

In a recent post on the Water Forum’s blog, Jessica Law, the new executive director of the American River Water Forum, described current conditions for the lower American River:

I won’t sugarcoat it. Conditions in the river will be bad. However, the Water Forum and our partners are working hard to ensure conditions are as good as they can possibly be, and to minimize harm to fish and habitat. As you may have seen on the news, we began this year with a near-normal snowpack. In most years, the snowpack melts and feeds our lakes and rivers. This year, the snowpack disappeared in the span of several weeks, soaking into the dry soil or evaporating—perhaps foreshadowing what may turn out to be the case study for climate change impacts on our water supplies and environment.

In a recent interview with Matt Weiser posted in Maven’s Notebook, Ms. Law further elaborated about the update of the original Water Forum Agreement from the year 2000.

“The biggest thing we’ve done is develop and implement a Modified Flow Management Standard with Reclamation that governs water movement in the Lower American River and optimizes conditions for fish. So that’s huge. …

But at some point, nature is moving faster than we can keep up. This year, with another extreme drought in play, is a great example of that. We had better water storage in all reservoirs coming out of a dry year than we ever had. This was very intentional by Reclamation and the Department of Water Resources. Still, we’re in a really bad situation this year.

Yet there is more to the story than natural conditions. Notwithstanding the Modified Flow Management Standard, fisheries in the lower American River have been struggling for many years.2

Reservoir inflows are low and water temperatures are high in summer of drier years (Figures 3 and 4), because Reclamation fails to conserve storage and the reservoir’s cold-water pool in most years. In the drier years, high June releases to meet Delta requirements and/or export demands lead to lower summer storage and high July water temperatures (Figures 1-3). Low reservoir storage levels lead to lack of access to the cold-water pool. Peaking power releases in afternoon-evening period draw warmer water from the surface of the reservoir (Figure 5).

A part of the solution to the problem is to have strict rules on end-of-year storage (Figure 7):

  1. 500,000 AF in high-storage years
  2. 350,000 AF in intermediate-storage years
  3. 250,000 AF in low-storage years

It is no longer enough to set end-of-September storage targets. Climate change means in part that more autumn months are very dry. Exports in the fall (and a transfer season now extended through November) pull down CVP storage or at least slow reservoir refill. Storage at the end of November or end of December needs to an explicit part of the carryover calculus. Figure 7 shows end-of-November as the requirement.

Complying with these rules (criteria) would occur through strict management of summer-fall storage releases. It would begin with the higher requirements for high-storage years, when there is water to manage. This would help prevent excessive drawdown from cascading into catastrophic conditions in one year.

Conserving storage in spring of drier years is also important in maximizing water storage for the beginning of summer. Use of Folsom Reservoir to meet short-term Delta water quality demands in winter and spring of drier years like 2021 (Figure 6) exacerbates summer storage and water temperature problems. This also wreaks havoc on the lower American River’s steelhead spawning habitat and salmon and steelhead rearing habitat.3

What is running away from managers of the lower American River is not only climate conditions. It is also the relentless pressure on other Central Valley Project (CVP) and State Water Project (SWP) reservoirs that forces Folsom Reservoir to shoulder more of the burden than it can bear. The explicit goal of “maximizing deliveries” in purpose-and-need statements of the 2019 Biological Opinions for the operation of the CVP and SWP are just one aspect of this pressure.

The over-delivery of irrigation water from Shasta Reservoir to Sacramento River Settlement Contractors in the spring and summer of 2021 made much less water from Shasta available to meet Delta water quality needs. Hence, the sudden demands on Folsom. There is a direct line between deliveries along the Sacramento and the amount of water in storage at Folsom Reservoir. These related problems must be solved to allow implementation of Folsom storage levels to be truly protective.

In summary, Water Forum 2.0 should focus on conserving Folsom Reservoir’s cold-water pool, providing access to the cold-water pool, minimizing the adverse effects of peaking power on river water temperature, and minimizing use of Folsom storage for short-term Delta water needs. While much of the focus must be on drier years, especially years like 2015 and 2021, overuse in high-storage type years can also lead to future problems.

For more detail on the salmonids and their habitat conditions in the lower American River see https://www.calfish.org/Portals/2/Programs/CentralValley/LAR_RST/docs/2020%20LAR%20RST%20Emigration%20Monitoring.pdf .

Figure 1. Folsom Reservoir storage patterns in four drier years: 2001, 2008, 2015, and 2021.

Figure 2. Folsom/Nimbus Reservoir releases to the American River at Fair Oaks in June-July of four drier years: 2001, 2008, 2015, and 2021.

Figure 3. Water temperature in the lower American River at William Pond gage in June-July of four drier years: 2001, 2008, 2015, and 2021. Red line is the upper limit of water temperature considered safe for salmonids.

Figure 4. Dry years 2001, 2015, and 2021 June-July inflow to Folsom Reservoir. Note 2015 and 2021 were very similar.

Figure 5. 48 hours of flow (cfs/100) and water temperature (oF) from Folsom Dam beginning 7/26/21 at 08:00 hours.

Figure 6. Folsom Reservoir daily-average storage releases (cfs) October 2020 to July 2021. Note each rectangle represents approximately 15,000 acre-ft of storage water. The three peaks in spring represent approximately 100,000 acre-ft of the end-of-June storage in Figure 1, or roughly about half the difference between 2015 and 2021 beginning-of-the-summer storage. Higher releases at the end of 2020 also contributed to the difference, along with low precipitation and snowmelt in 2021.

Figure 7. Folsom Reservoir daily-average storage (acre-feet) 2000-2021. Recommended minimum storage criteria are shown by circles: blue for high-storage years; light blue for intermediate-storage years; yellow for low-storage years. Red arrows are years that grossly exceeded such criteria.

What is it about the Scott River and its Coho Salmon?

A recent article in Science Magazine provides a possible clue as to why the Scott River, a California tributary to the Klamath River, still produces a relatively large amount of coho salmon. A chemical released onto roads as tires wear has been found to kill young coho.1 Watersheds like the Scott River are pristine, sourced directly from springs and snowmelt, with low highway interaction. The Scott contrasts with its neighbor the Shasta river, which runs very close to Interstate Highway 5, and which produces few coho salmon.

Absence of pollution from tire debris may also be part of the reason why Butte Creek is able to produce so many spring-run salmon. On the other side of the coin, the prevalence of roads may help explain why coho salmon have been extirpated from many of the highly urbanized Puget Sound watersheds in Washington State and British Columbia.

The recent study regarding pollution from tires emphasizes the need to protect pristine watersheds like the Scott River, as well as the need to restore those like the Shasta River. There is likely to be more public discussion of this subject in the coming months and years, hopefully as the tire industry seeks alternatives to its problem chemical

  1. As described in Science Magazine, the chemical is: “a highly toxic quinone transformation product of N-(1,3-dimethylbutyl)-N′-phenyl-p-phenylenediamine (6PPD), a globally ubiquitous tire rubber antioxidant.”

Are Striped Bass Next to Go? 2021 Update

The prognosis for Bay-Delta and California striped bass could not be much worse. Numbers of stripers salvaged at the south Delta pumping plants in 2021 are down to or below 2014-2015 levels.1 Like many other species that spend all or part of their lives in the Delta, striped bass are on a downward spiral. Good water years are not providing enough population rebound to offset devastating lack of recruitment in dry year sequences.

In my report on the status of striped bass in 2016, stripers had suffered terribly in four years of drought (2012-2015). By 2019, the prognosis was still not good after a sequence of wetter water years (2016-2019) that were below normal, wet, below normal and wet.

Now, the summer-to-fall recruitment relationship (Figure 1), with its strong relationship between the summer index and fall recruitment, shows that dry year 2020 recruitment was as low as during the critically dry drought years 2014 and 2015. In the critically dry drought year 2021, late spring net catches are at historic lows.2 If the summer-to-fall recruitment relationship holds in 2021, striped bass are circling the drain as the next fish species to be lost in the collapsing Bay-Delta ecosystem.

Figure 1. Striped bass Fall Midwater Trawl Survey Index (log10[index+1]) versus prior Summer Townet Index (log10). Select years labeled, with color of number showing year type: blue=wet, green=normal, and red=critically dry.

Butte Creek Spring-Run Chinook Salmon in Peril

Butte Creek DeSabla – Centerville Project options1 could help save the salmon

Butte Creek’s spring-run salmon are dying in droves (over 12,000 carcasses of un-spawned adults counted so far in summer 2021) in their over-summering reach upstream of Centerville. A huge run of the most important core element of the California Central Valley Spring-Run ESU is being wiped out by low flows and high water temperatures.

This year’s spring-summer salmon migration and holding water temperatures have been about 5ºC higher than normal (Figure 1). Average daily water temperatures where adult salmon have been holding were over 20ºC for a solid month from the third week in June through the third week in July. Though the immediate cause of this year’s die-off is not known, these temperatures can lead to disease and even hypoxia in overcrowded conditions. Streamflows have also been well below average in 2021 (Figure 2). This is a consequence of reduced snowmelt and of reduced water available from PG&E’s Hendricks diversion from the West Branch of the Feather River, part of PG&E’s DeSabla-Centerville Hydroelectric Project.

After decades of successful recovery progress, the recent trend for spring-run salmon in Butte Creek is downward (Figure 3). The huge loss this summer of what was to be a recovery run will make the trend worse.

PG&E has operated the DeSabla – Centerville Project (Figure 4) for a century, but decided in 2017 to withdraw its application for a new license to continue operating the project. PG&E is in the process of trying to sell the project, but after four and a half years, the sale, and the suitability of the prospective buyer, are not certain. Meanwhile, needed improvements to the project have been on hold. In particular, infrastructure to reduce heating of water in a small project reservoir just uphill from DeSabla Powerhouse on Butte Creek could have helped reduce water temperatures in Butte Creek this year.

Without the 40-100 cfs of cool summer water available from the West Branch of the Feather River via the DeSabla project, water temperature and flow conditions would be even worse, and sustaining spring run in Butte Creek might not be possible. Therefore, some stakeholders have suggested that the State of California, specifically the Department of Water Resources, should consider taking over the DeSabla project to secure cool water from the West Branch Feather River for the immediate future.

An additional phase of actions on Butte Creek could entail removing the Lower Centerville Diversion Dam, a low-head dam on Butte Creek just downstream from the DeSabla powerhouse (Figure 4). Removal of the dam and diversion could be a first step in allowing access to many miles of upstream spawning and rearing habitat on Butte Creek presently blocked by the dam. It is likely that several natural barriers might also need to be modified.

As climate change strikes California with an accelerating vengeance, options to protect and recover California’s salmon are becoming fewer and more difficult. Salmon are dying in greater numbers and with more frequency on the floor of the Central Valley. Projects and alternatives to move salmon back into higher elevation habitat seemed far-fetched or exorbitant a decade ago. They require a fresh and more expansive look today.

Figure 1. Water temperature recorded April-July 2021, plus recent four-year average.

Figure 2. Streamflow recorded April-July 2021, plus 90-year historic average.

Figure 3. Butte Creek annual spring-run salmon snorkel counts. Data Source: CDFW.

Figure 4. Modified DeSabla Project concepts. Solid red line is continued transfer of West Branch of Feather water via DeSabla powerhouse. Red “X”s denote options to remove diversion dams and power canals.


  1. The Central Valley Salmon and Steelhead Recovery Plan (NMFS 2014) includes an action to evaluate a Butte Creek water management option for the PG&E DeSabla-Centerville Hydroelectric Project to determine the flow conditions that optimize coldwater holding habitat and spawning and rearing habitat.