This post is a follow-up to a prior post on early spring conditions in the Bay-Delta in 2026.
May 2026 featured five primary lunar phases, including two full moons. The first full moon (Flower Moon) peaked on May 1, followed by the third quarter on May 9, a super new moon on May 16, and the first quarter on May 23. The month closed with a second full moon (a micro blue moon) on May 31.
These phases of the moon worsened the consequences, for fish and water quality, of water operations by the Bureau of Reclamation.
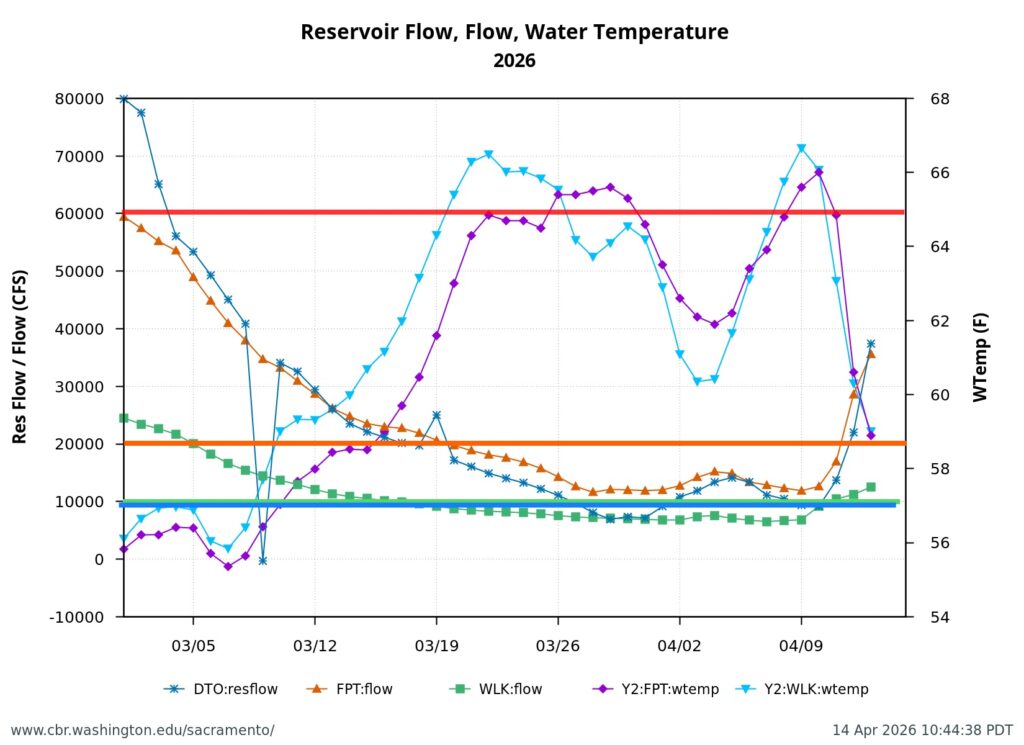
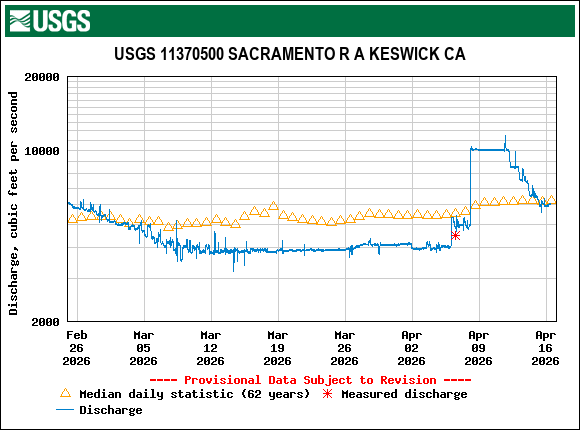
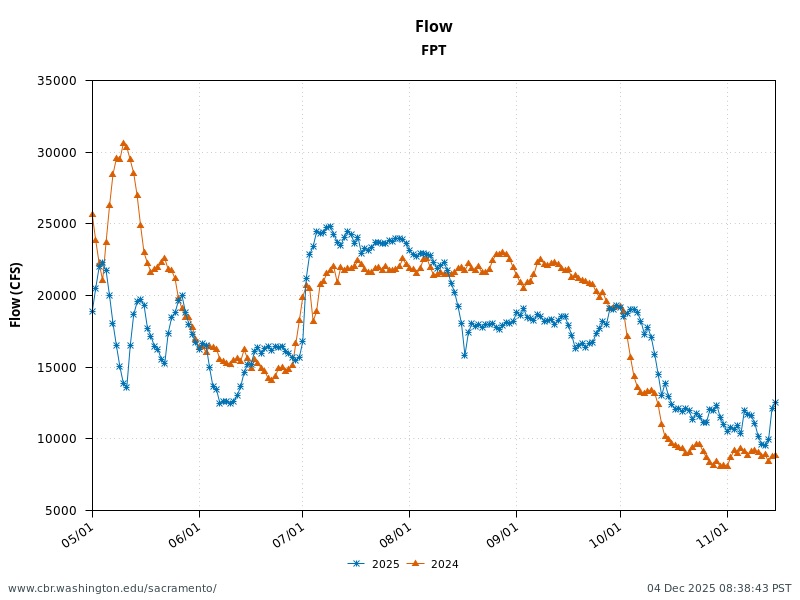
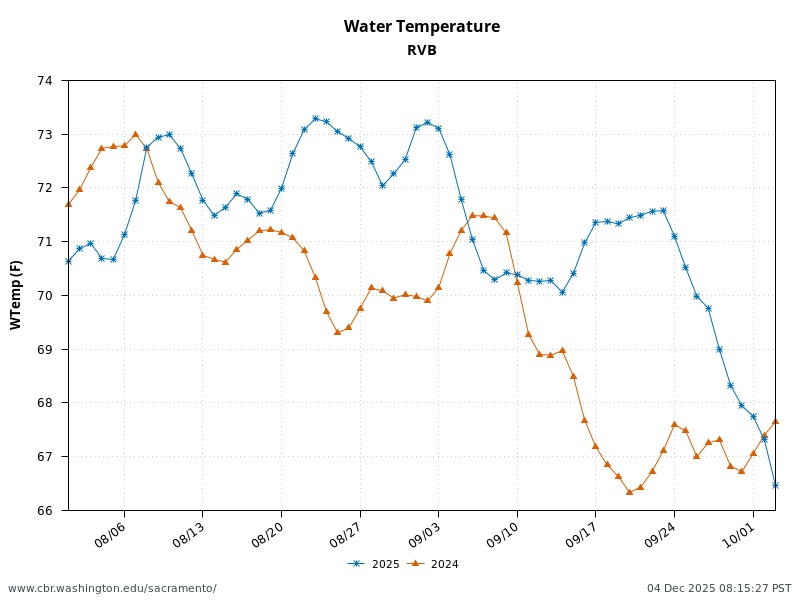
First, the poor May Delta habitat conditions resulted from low Delta inflow – unusually low Sacramento River inflows to the Delta at Freeport (Figure 1). The low inflow, in conjunction with a late spring heatwave, led to high north Delta water temperatures (Figure 2).
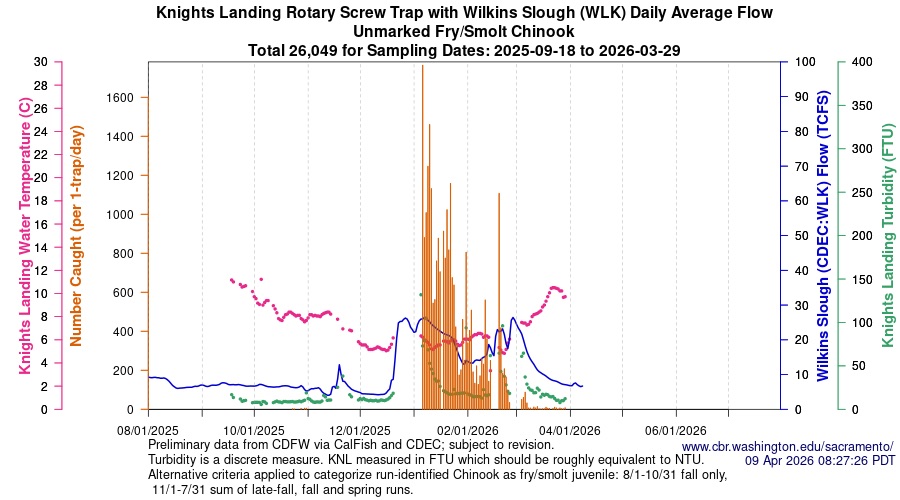
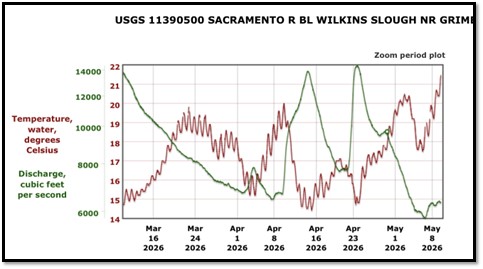
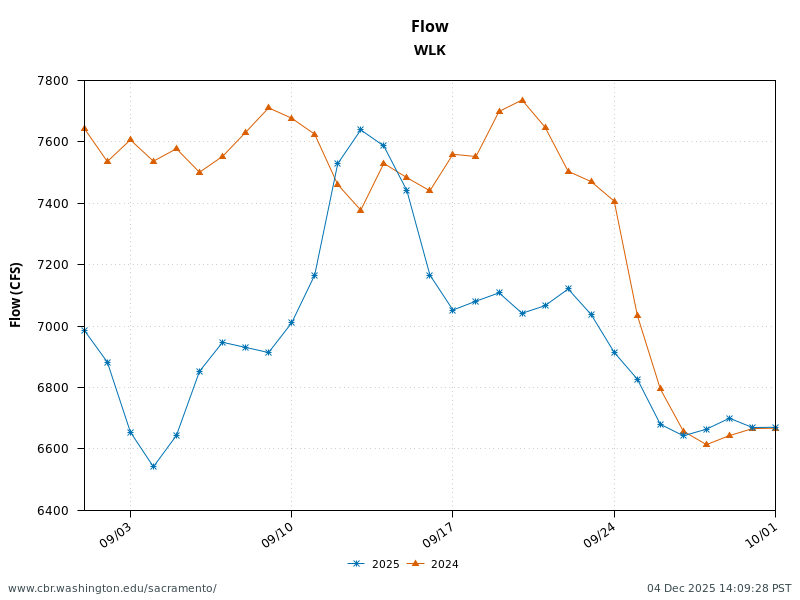
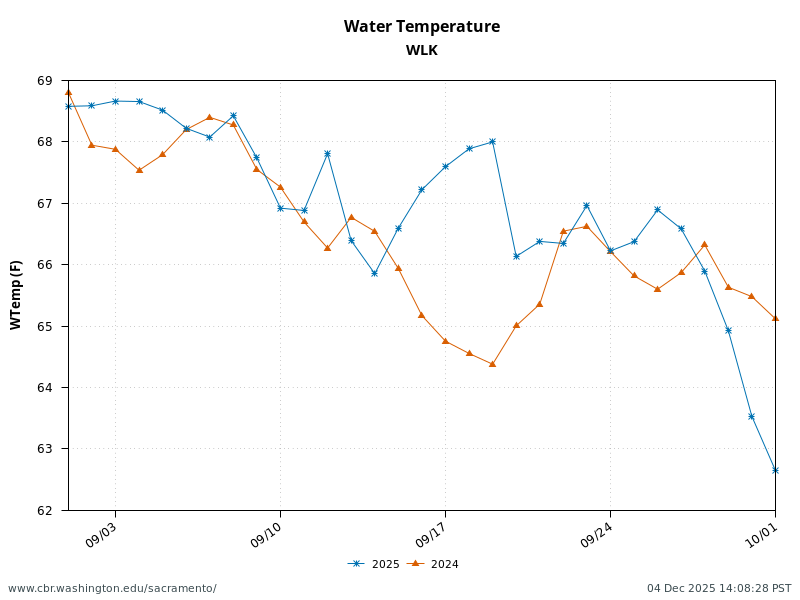
Second, low Sacramento River flows and high water temperatures upstream of the Delta (Figure 3) also contributed to the poor Delta conditions. Water temperature at Wilkins Slough reached daily-average 74oF mid-month, six degrees above the water quality standard, under flows less than 5000 cfs.
Third, the mid-month super new moon and end-of-month blue moon contributed to the higher river channel stages (Figures 4 and 5) in the north Delta that pooled the warm freshwater inflows and contributed to further warming during the late May “heatwave”.
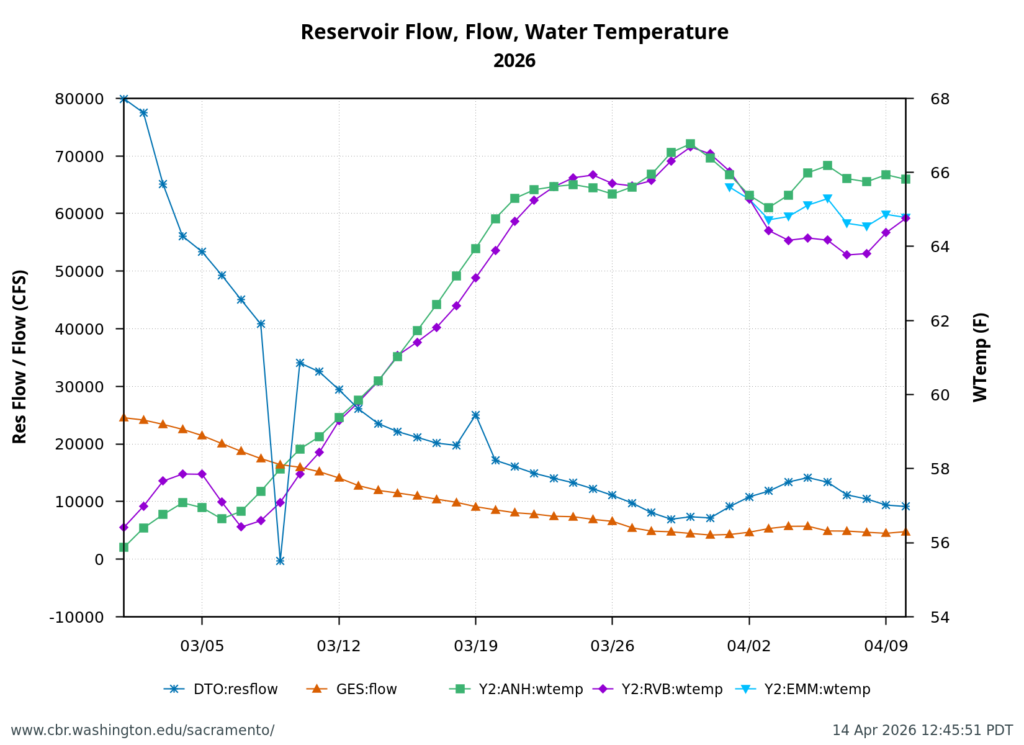
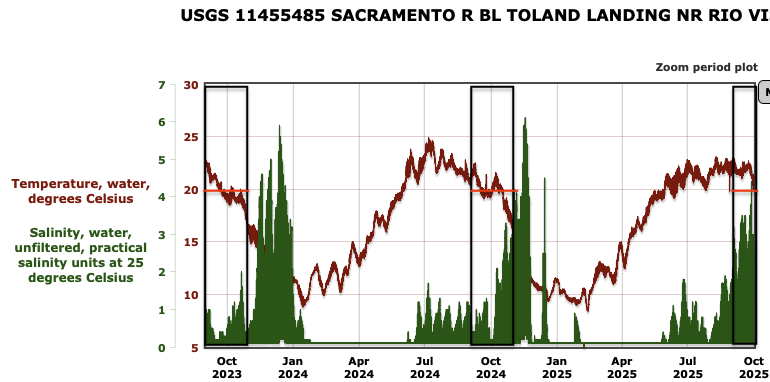
Fourth, a consequence of the warming in the north Delta was warming in the west Delta (Emmaton, Figure 6) and eastern Suisun Bay (Collinsville, Figure 7).
The poor habitat conditions caused significant stress on late immigrating winter-run and spring-run adult salmon and late emigrating salmon smolts. The poor conditions also reduced the likelihood of successful reproduction for sturgeon and smelt..
The suboptimal habitat conditions observed in the lower Sacramento River, Delta, and Bay were preventable. The Bureau of Reclamation could have mitigated these conditions by maintaining Sacramento River flows within a 7,000–10,000 cfs range, north Delta Freeport flows between 15,000–20,000 cfs, and Rio Vista daily-average flow and Delta outflow at approximately 10,000 cfs (Figure 8).
An added 3,000–5,000 cfs (6,000–10,000 acre-feet per day) flow was needed in late May 2026 to avoid the poor conditions. That amount is approximately 2 to 3 percent of Sacramento Valley water project reservoir end-of-April storage, or about a quarter to a third of May water contractor deliveries.
On paper, Reclamation must manage the flows necessary to comply with water quality standards, water right permit requirements, and endangered species take permits. However, Reclamation’s adherence to these regulations has diminished significantly over the past twenty years.
More recently, Reclamation’s operations have become substantively worse for fish under its “Action 5” interpretation of the Biological Opinion for the Central Valley Project. Reclamation adopted Action 5 in December 2025, in response to the Presidential Executive Order 14181 that requires federal agencies to “override existing activities that unduly burden efforts to maximize water deliveries.”
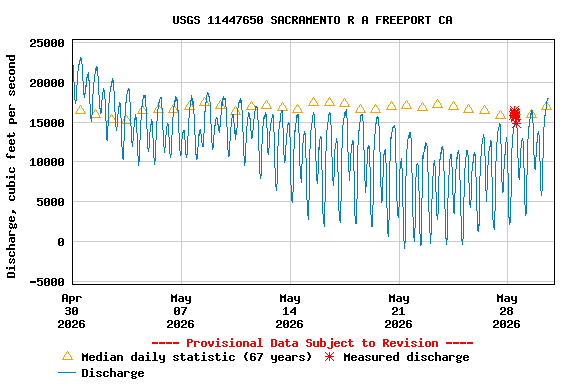
Figure 1. May 2026 Sacramento River hourly Delta inflow at Freeport gage. Also shown in daily average for prior 67 years. Data source: USGS.
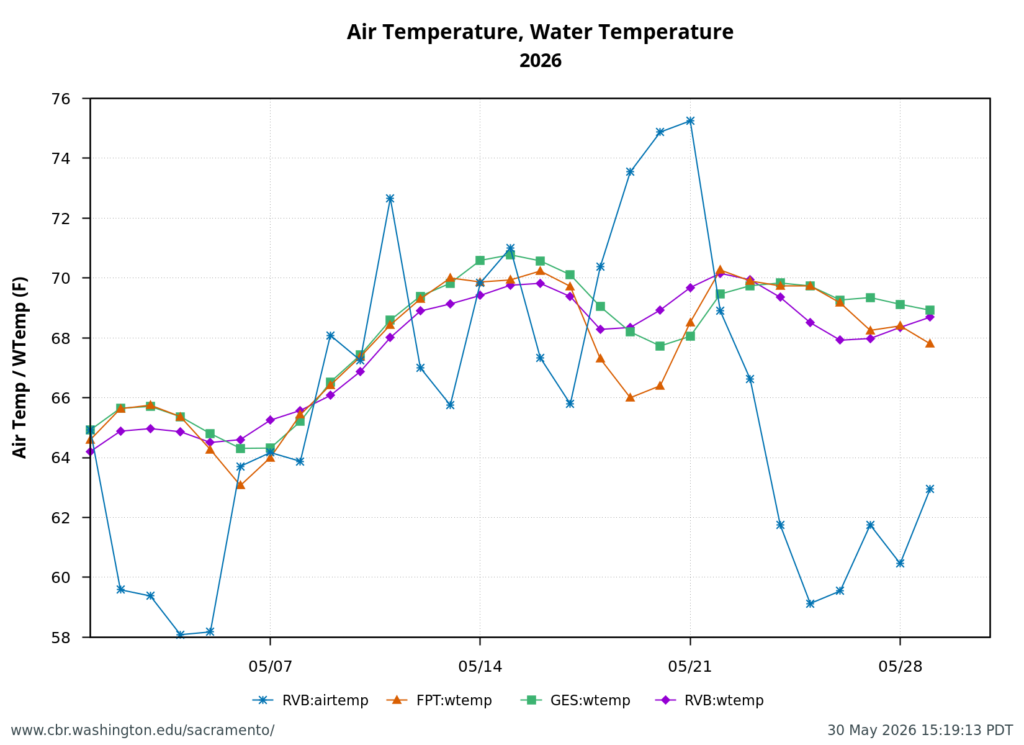
Figure 2. May 2026 air and water temperatures in the Sacramento River channel of the north Delta at Freeport (FPT), below the entrance to Georgianna Slough (GES), and the Rio Vista Bridge (RVB). Data source: CDEC. See map for locations.
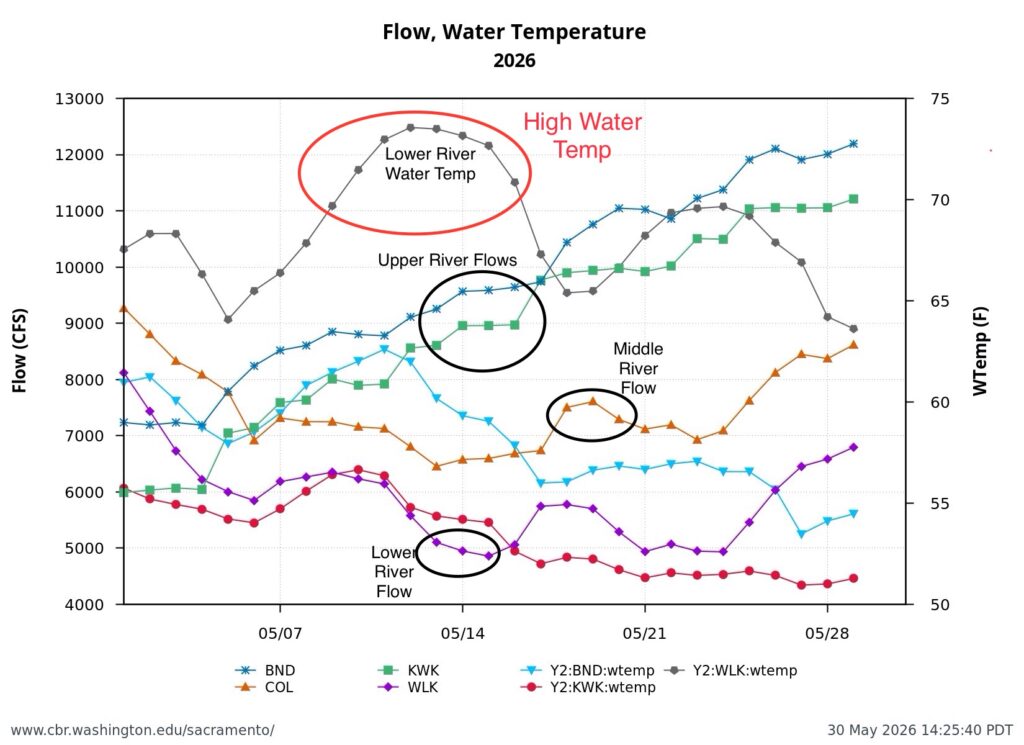
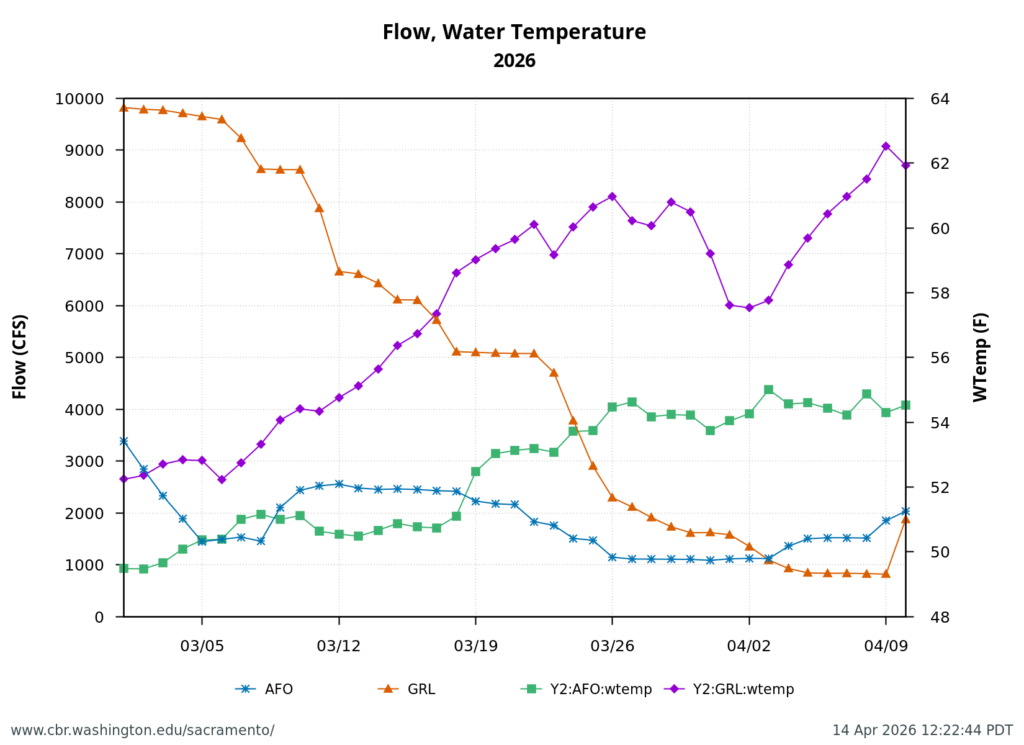
Figure 3. Sacramento River flow and water temperatures in May 2026 at Keswick (KWK), Bend (BND), Colusa (COL), and Wilkins Slough (WLK). Note the difference between upper and lower river flow is from 4000-5000 cfs, due to water contractor deliveries.
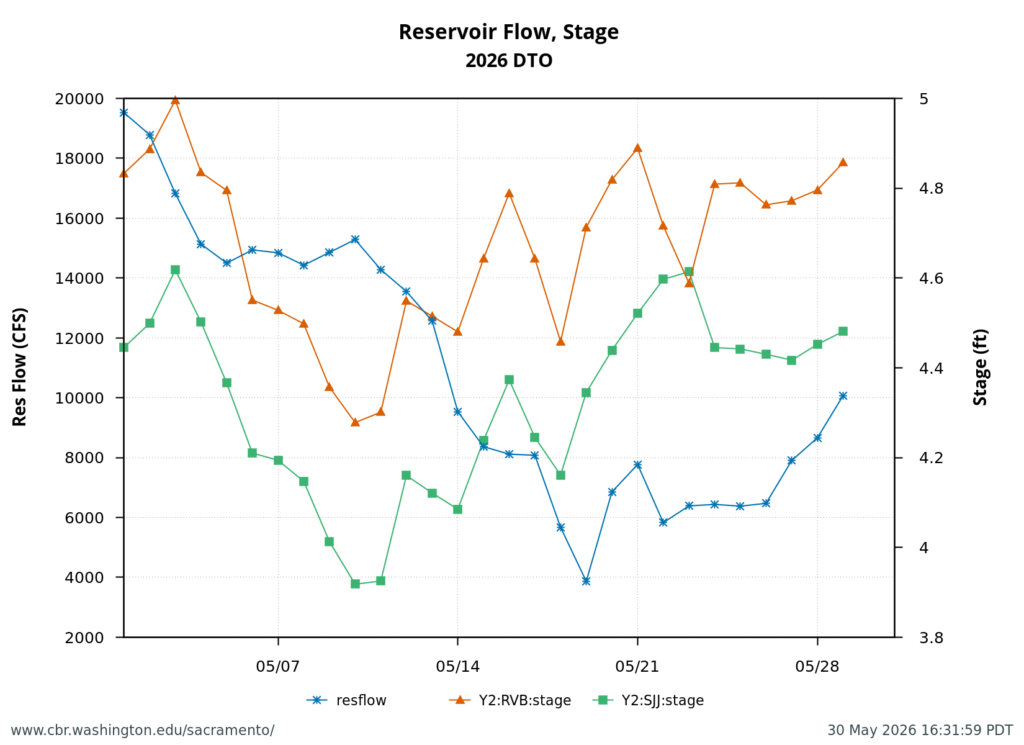
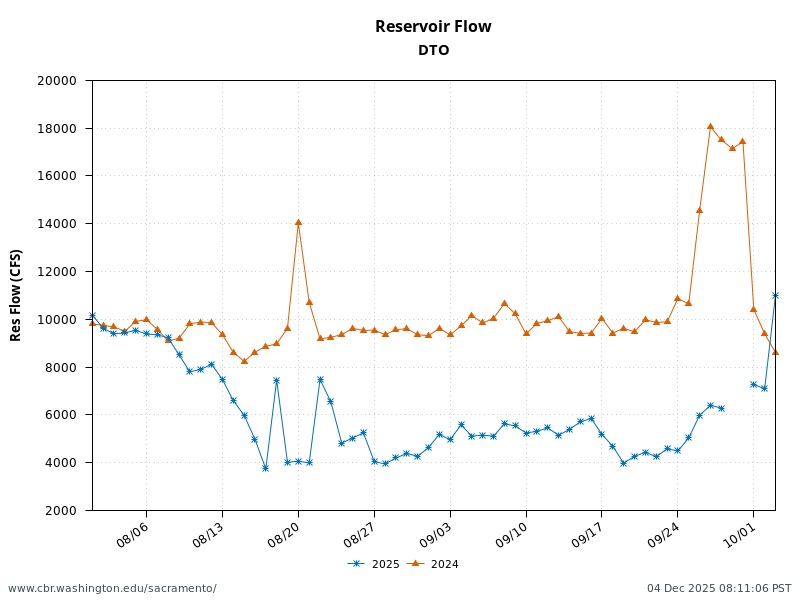
Figure 4. May 2026 Delta outflow (DTO) and average-daily river stage (water surface elevation) at the Rio Vista Bridge (RVB) and Jersey Point (SJJ). See map below for stage locations. Note mid-May decline in outflow and increase in stage occurred as a result seasonal tide changes – the result of the mid-May super new moon and the end-of-May blue moon.
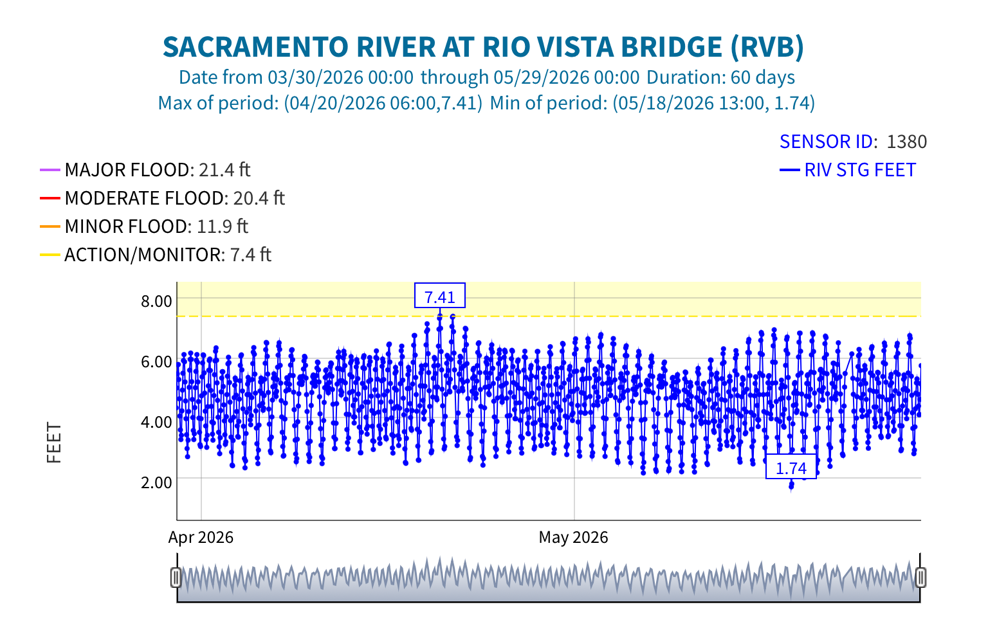
Figure 5. Hourly tide stage at Rio Vista Bridge gage in April-May 2026. Note peak stage (water surface elevations) were about ten days before the two May full moons (1st and 30th).
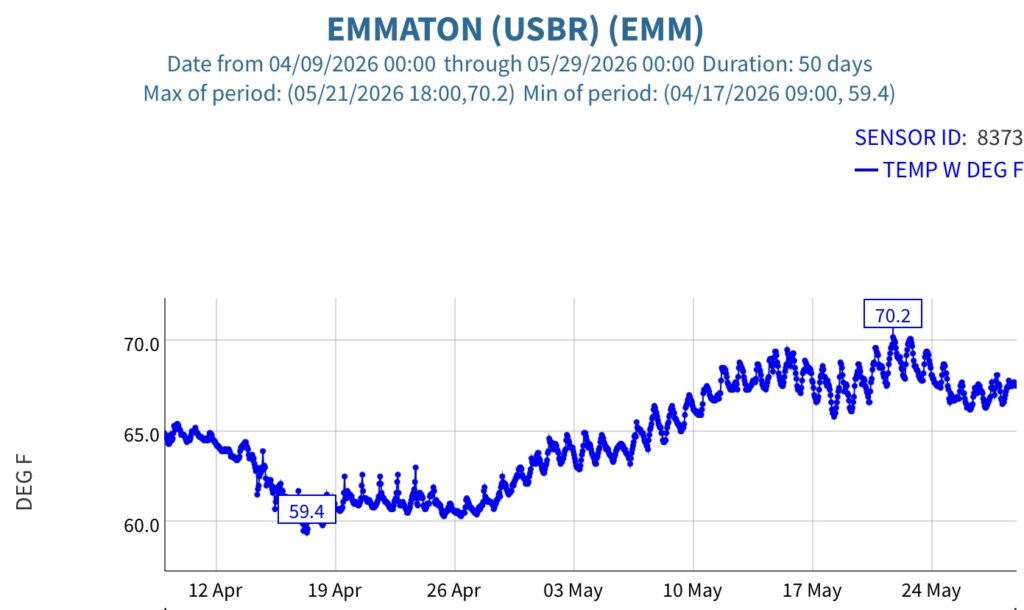
Figure 6. Sacramento River channel hourly water temperature at the Emmaton gage in May 2026.
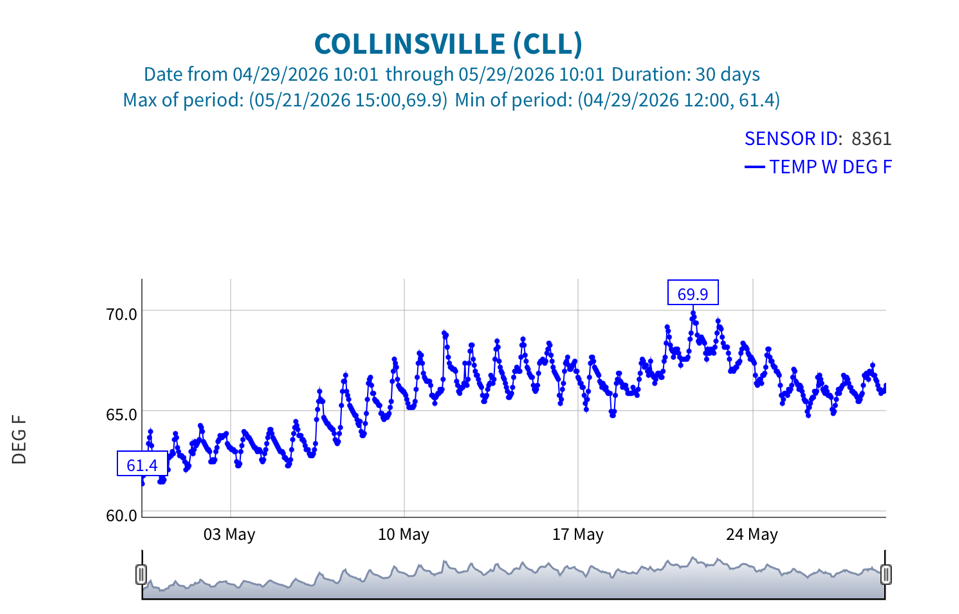
Figure 7. Sacramento River channel hourly water temperature at the Collinsville gage in eastern Suisun Bay in May 2026.
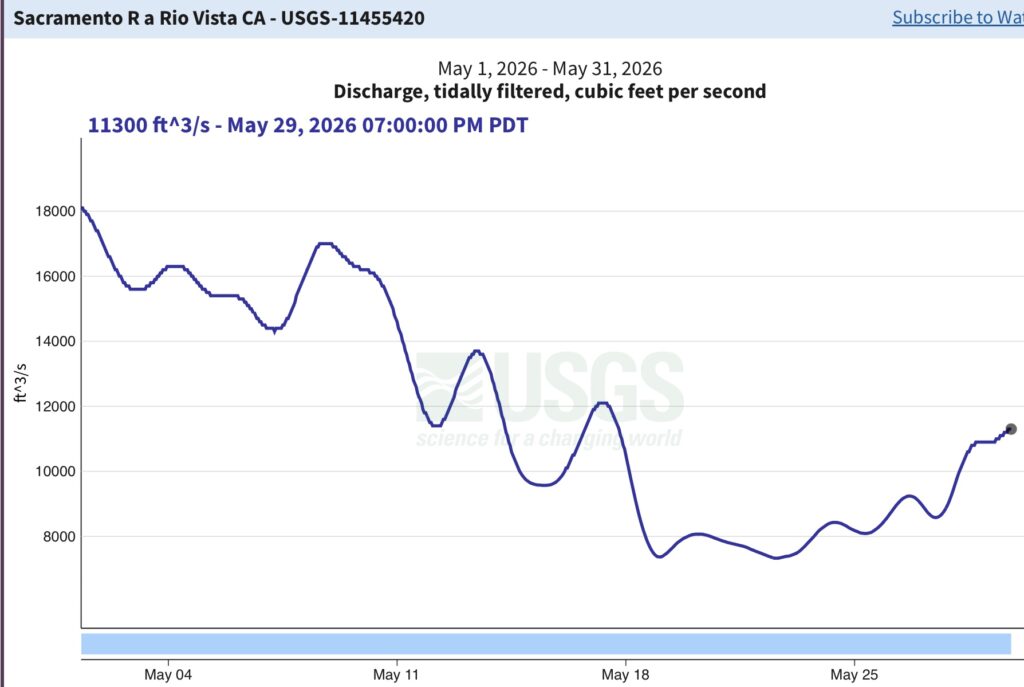
Figure 8. Daily average (tidally filtered) streamflow at the Rio Vista Bridge in May 2026.
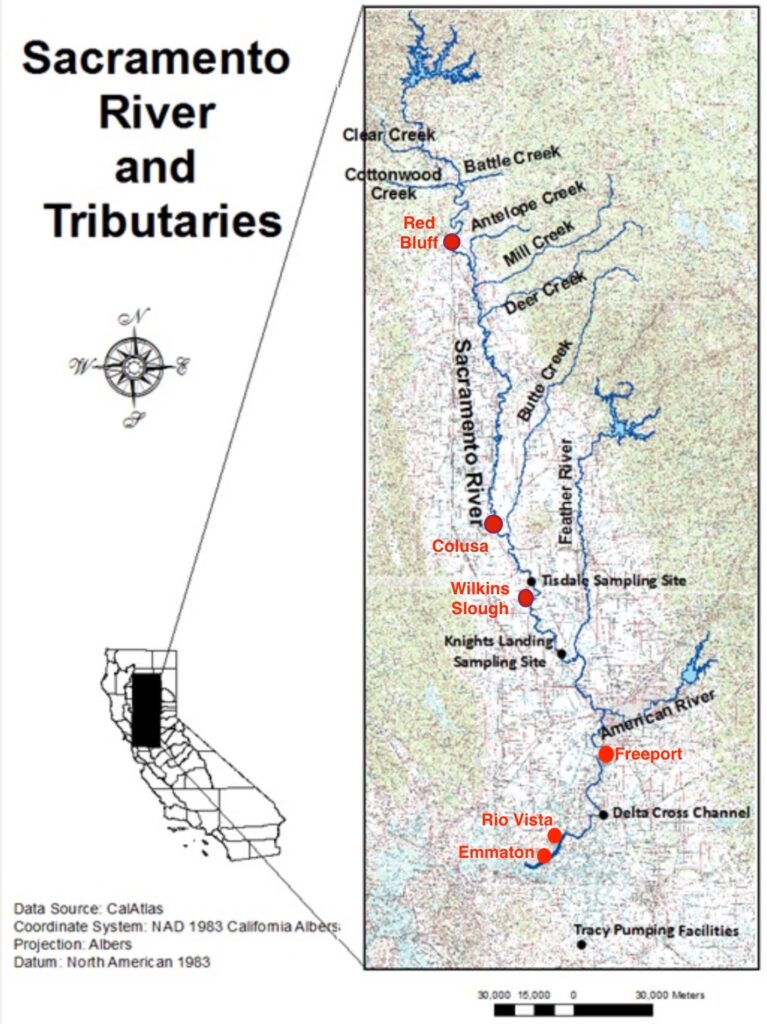
Map of North Delta and Sacramento River Channel