The Big-Notch Project at the Fremont Weir came online in late 2025. In this post, I describe events in December 2025 that provided improved access for juvenile salmon to floodplain habitat in the Yolo Bypass through that new Big Notch.
The goal of notch projects at the Fremont and Tisdale weirs in the Sacramento Valley is to create greater access to floodplain habitats for juvenile winter-run Chinook salmon, as well as fall-run and spring-run, in the upper Sacramento River Valley. The Fremont Weir project, completed in 2025, now improves access for salmon into the Yolo Bypass. The Tisdale Weir notch project, when completed, will improve access of upper Valley salmon populations into the Butte Basin and the Sutter Bypass floodplains.
Background on Floodplains and Butte Creek
The recovery and success of Sacramento River winter-run Chinook salmon is tied to floodplain rearing and smolt production in the wettest years. There is great potential improvement for the survival of endangered winter-run salmon by providing improved rearing access to the Sutter and Yolo flood bypasses.
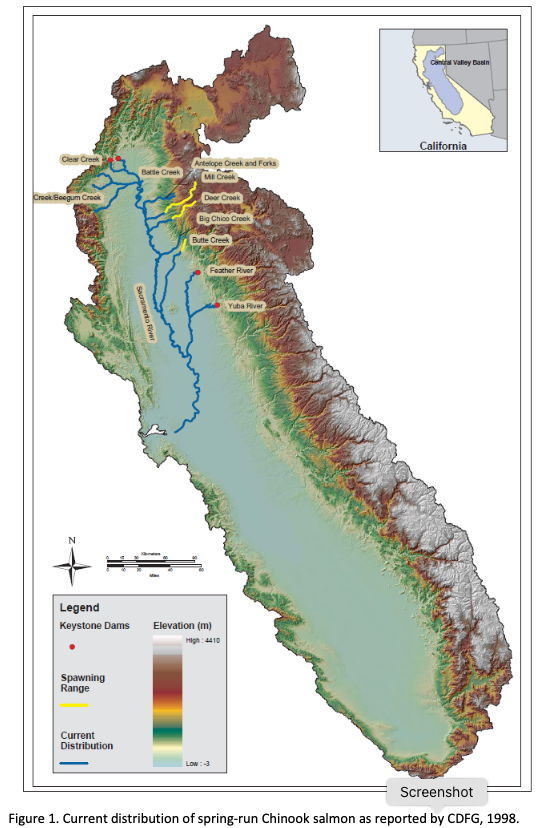
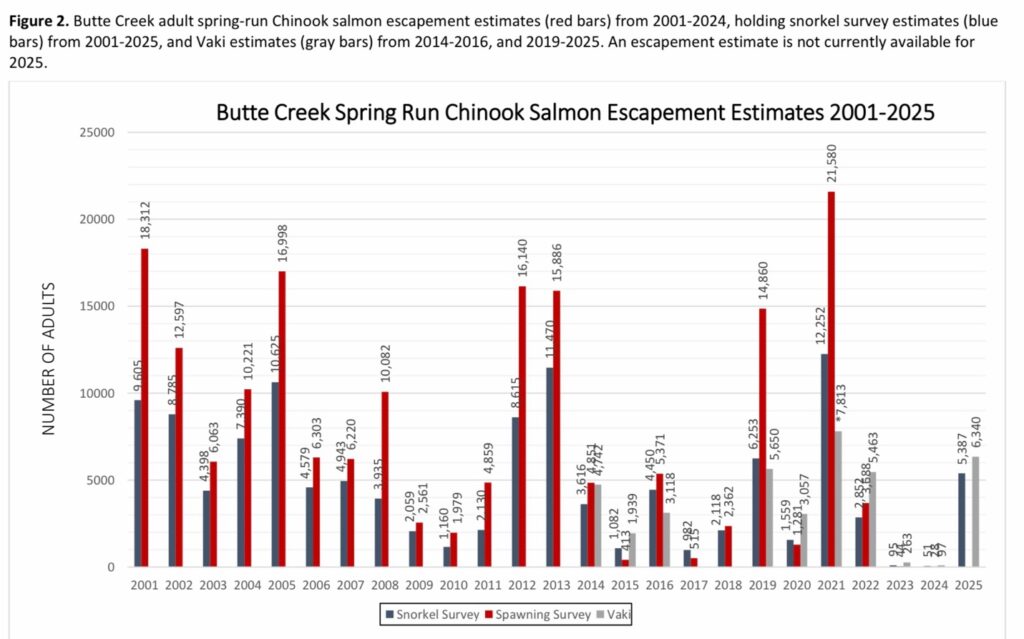
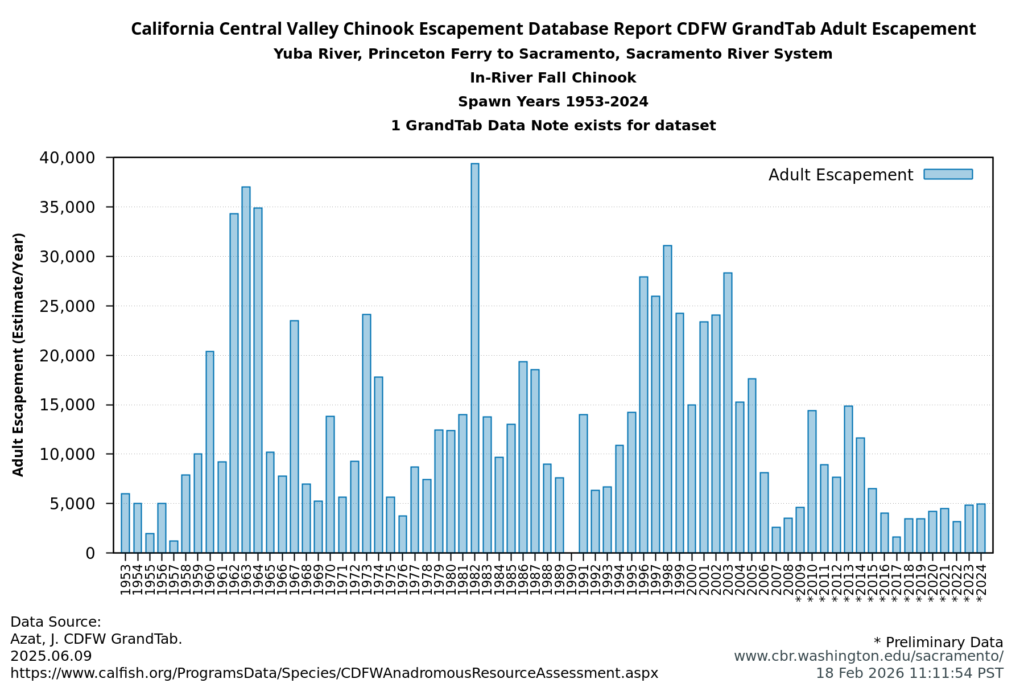
The remarkable recovery of Butte Creek’s wild spring-run Chinook salmon at the turn of the 21st Century provides an excellent example.
The turnaround in Butte Creek followed a decade of restoration activity in the creek and its floodplain by the US Fish & Wildlife Service, the California Waterfowl Association, the Nature Conservancy, CalTrout, Friends of Butte Creek, duck clubs, rice farmers, and many other collaborators.1 The secret to the success was opening the Butte Basin and Sutter Bypass so that juvenile salmon could rear in the floodplain habitat in early winter. This led to accelerated growth and high survival, which in turn allowed early entry of smolts into the ocean by late winter and early spring.
How the Fremont Weir Big-Notch Project Worked in its First Year
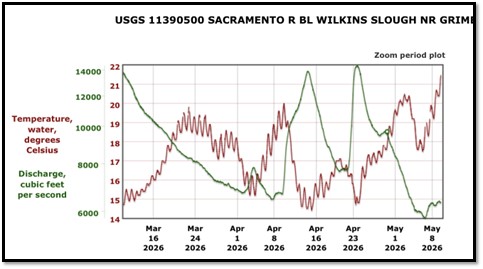
The first significant winter rains of 2025 brought a strong pulse of flow to the lower Sacramento River in late December (Figure 1). That pulse began entering the Big Notch at the Fremont Weir on December 21st (Figure 2). River flow (and flow exiting the Sutter Bypass) passed through the Big Notch through the end of December. River flow was only high enough to overflow the entire Fremont Weir on Dec 27 and 28 (Figure 3). Thus, most of the water flowing into the Bypass at the Fremont Weir passed through the Big Notch. Lesser but substantial amounts of warmer water also flowed into the north Yolo Bypass via the Knights Landing Ridge Cut (Figure 4).
Overflows into the Yolo Bypass (also including the Sacramento Weir) rapidly fill the Bypass (see maps). The Bypass floods to depths of 8-10 feet (Figure 5). The slowing of flows and spread of shallow water leads to rapid warming (of the colder river water) in the flooded Bypass (Figure 6). The warming extends to the lower Sacramento River channel in the north Delta at the Rio Vista Bridge (Figure 7), downstream of the Yolo Bypass’s outlet.
The warmer shallow Bypass habitats (optimal growth 52-56ºF) have high food production that supports increased growth and survival of juvenile winter-run emigrating to the ocean. Substantial numbers of juvenile winter-run salmon likely entered the Yolo Bypass during the December event through the new Big Notch (Figures 8 and 9). The access to the floodplain habitat likely contributed to the higher winter-run smolt 2025 index of the winter-run Juvenile Production Estimate (JPE, Figure 10) and the annual Chipps Island Trawl Survey index (Figure 11). Winter overflows into the other flood bypasses and the relatively wet water year 2025 also contributed.
The Benefits of Notches in Flood Bypass Weirs
The principal benefits of weir notches are that they allow water to enter flood bypasses (overflows) at lower river stages (at stages up to 10 feet or lower), and thus earlier in the late fall or winter. These systems can also enable overflow events during dry winter seasons that would not typically experience overflows. They also allow overflows later in the winter season to enhance adult and juvenile migrations of all the salmon runs through the bypasses (Figures 12 and 13).
The notches can also sustain overflows between periods of normal weir overflows. This not only sustains the access, but also reduces potential for stranding of adult and juvenile salmon. It also maintains good habitat conditions, minimizing overheating or disconnection of bypass habitats.
The broader overall benefits of weir notches are improved smolt production to the ocean, greater sustainable ocean harvest, and improved spawner numbers (escapement).
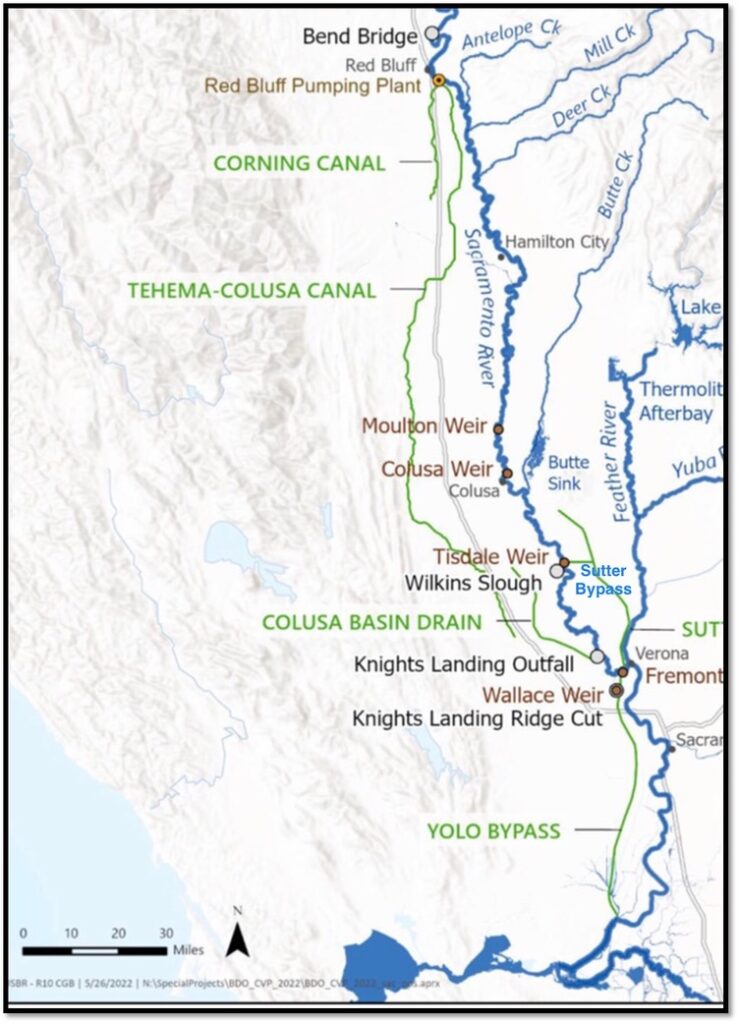
Map of Sacramento River Valley with Flood Weirs and Bypasses.
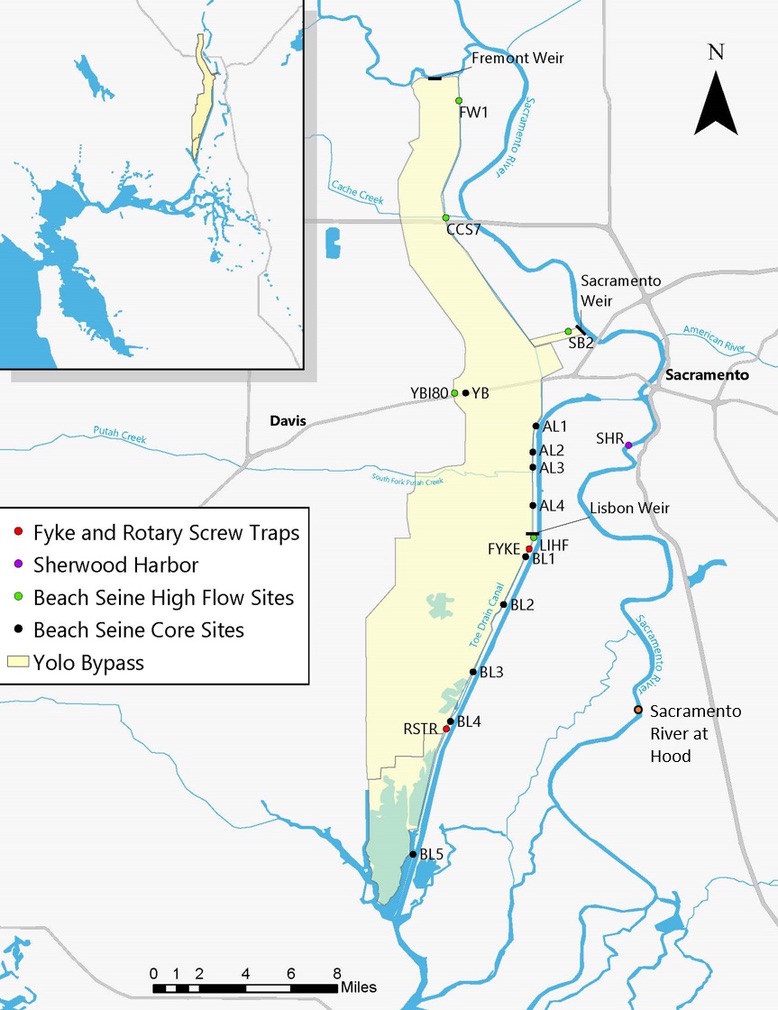
Map of Yolo Bypass – (Note fishery monitoring program sites.)
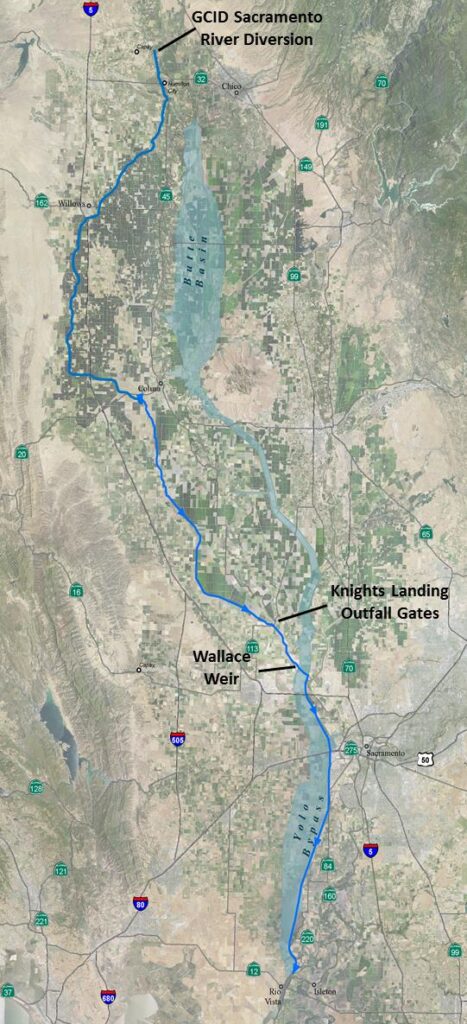
Map of Colusa Basin Drain and Yolo Bypass Tule Canal flow pathway to Rio Vista Bridge.
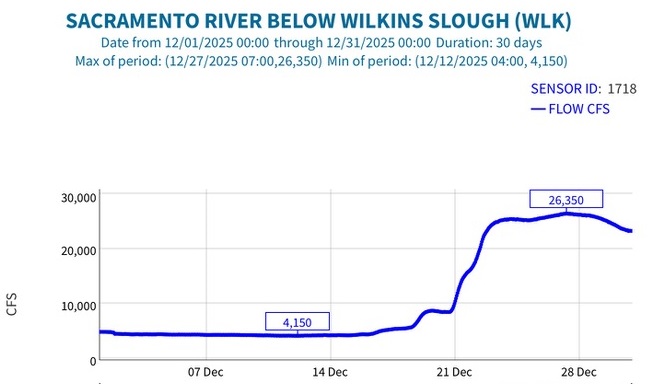
Figure 1. Streamflow in the lower Sacramento River below Wilkins Slough in December 2025. Source: CDEC.
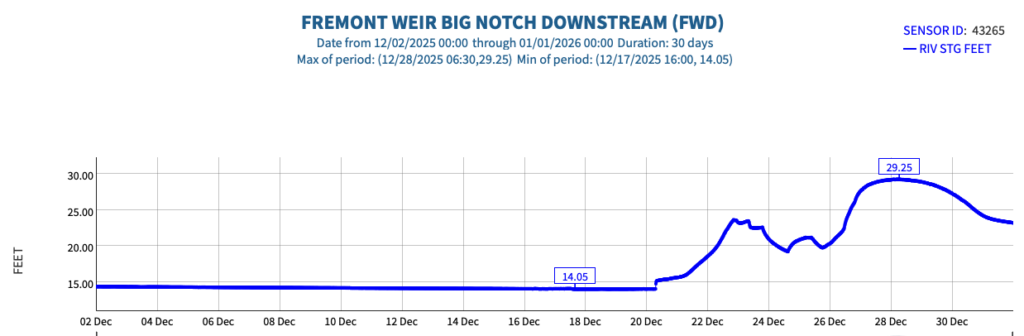
Figure 2, Streamflow in the Yolo Bypass downstream of the Big Notch in the Fremont Weir.in December 2025. Source: CDEC.
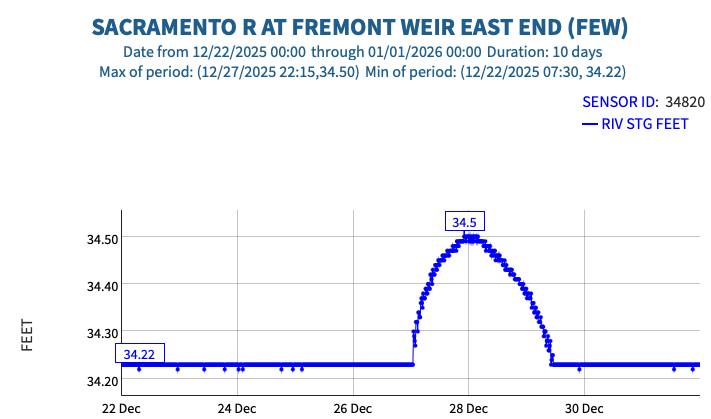
Figure 3. Overflow into the Yolo Bypass at the historical Fremont Weir in December 2025. Source: CDEC.
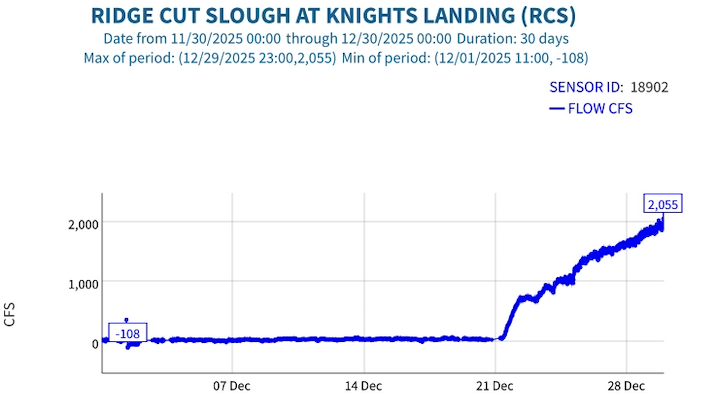
Figure 4. Streamflow in the Ridge Cut Slough (Colusa Basin Drain connection to the upper Yolo Bypass below the Fremont Weir in December 2025.
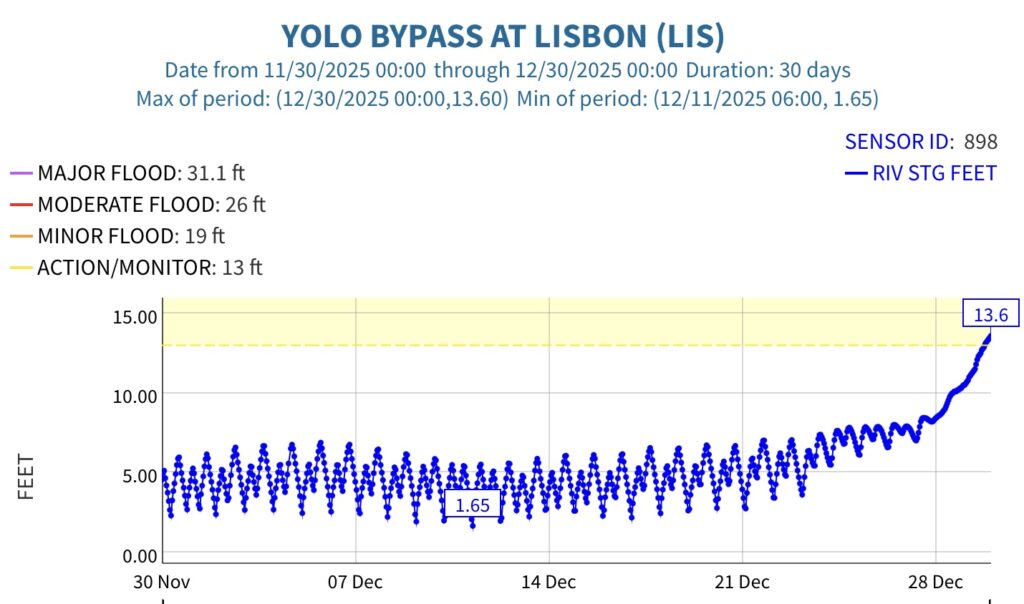
Figure 5. Stage in the Tule Canal of the Yolo Bypass at Lisbon gage in December 2025.
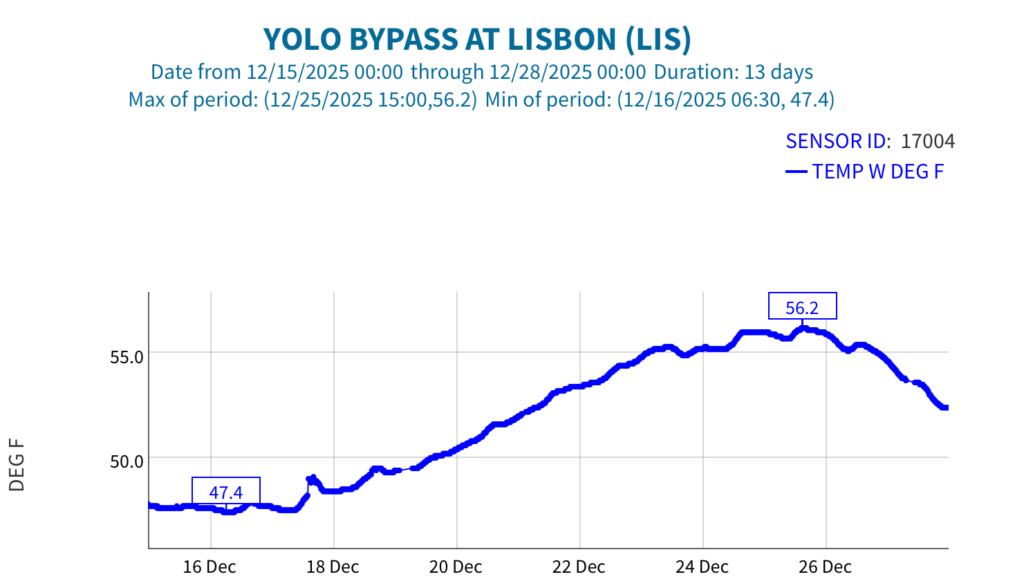
Figure 6. Water temperature at the Lisbon gage in the Yolo Bypass in December 2025.
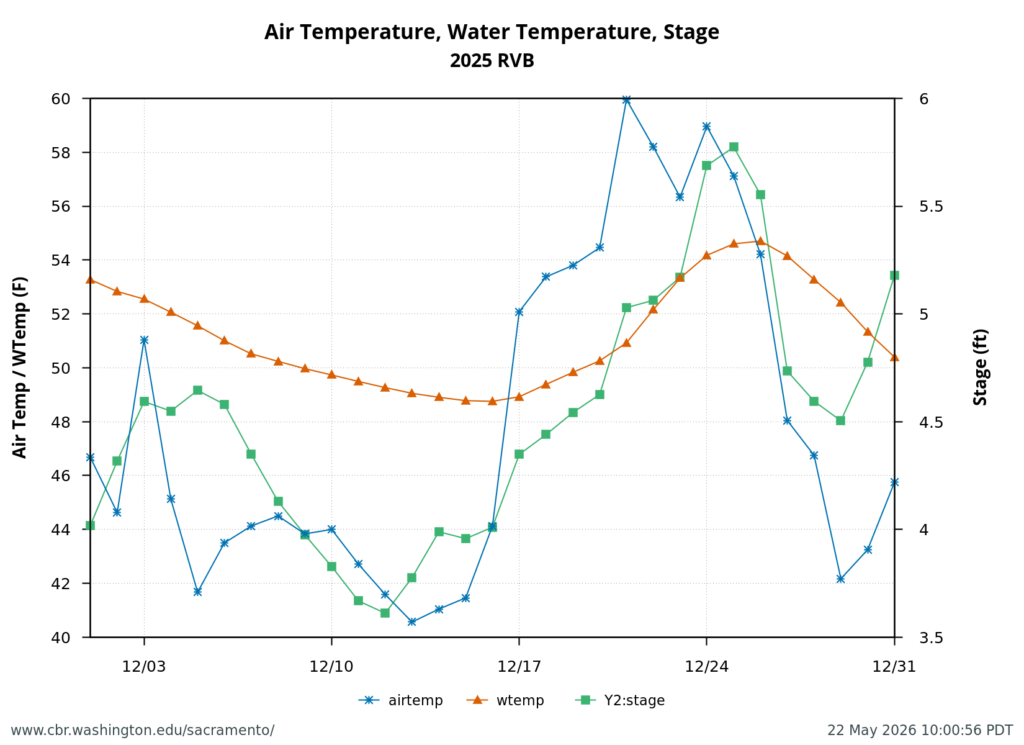
Figure 7. Daily average air and water temperature and river stage at the Rio Vista Bridge of the Sacramento River channel of the north Delta in December 2025. Source: CDEC.
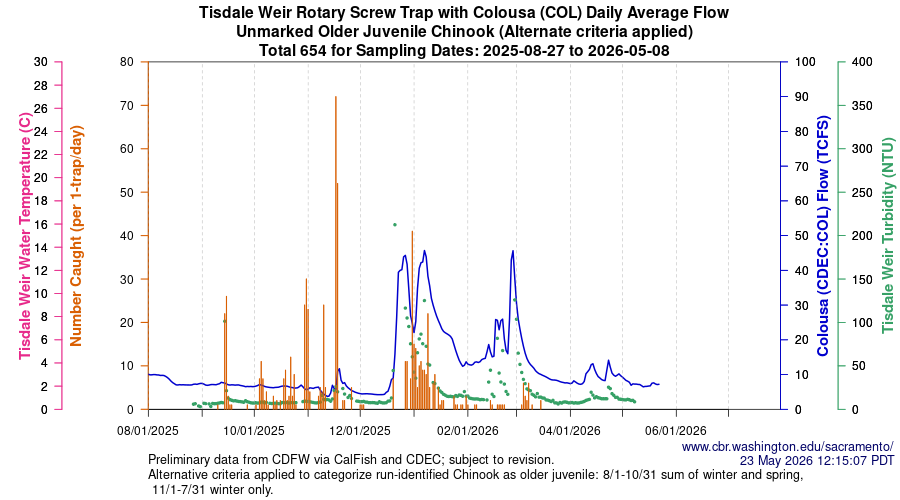
Figure 8. Daily catch of older salmon (non-fry, predominantly winter-run) in Tisdale Screw Trap and environmental conditions September 2025 to May 2026.
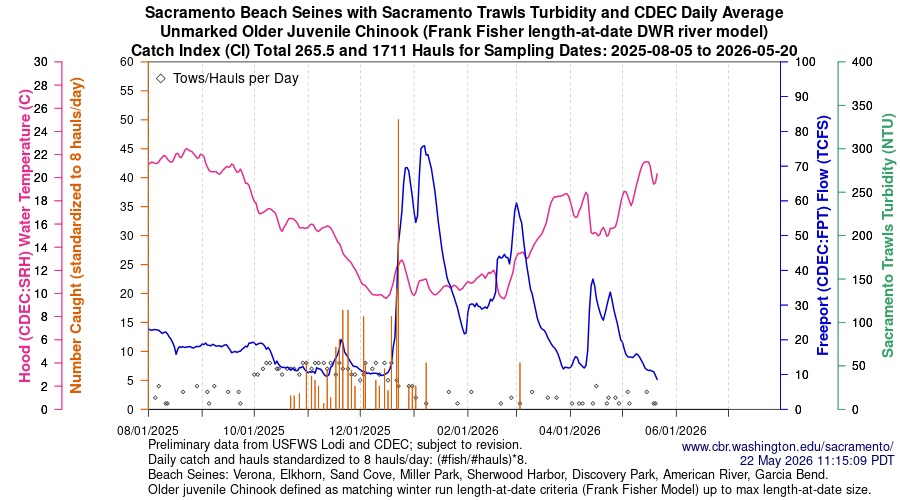
Figure 9. Daily catch of older salmon (non-fry, predominantly winter-run) in Sacramento River near Sacramento beach seines and environmental conditions September 2025 to May 2026.
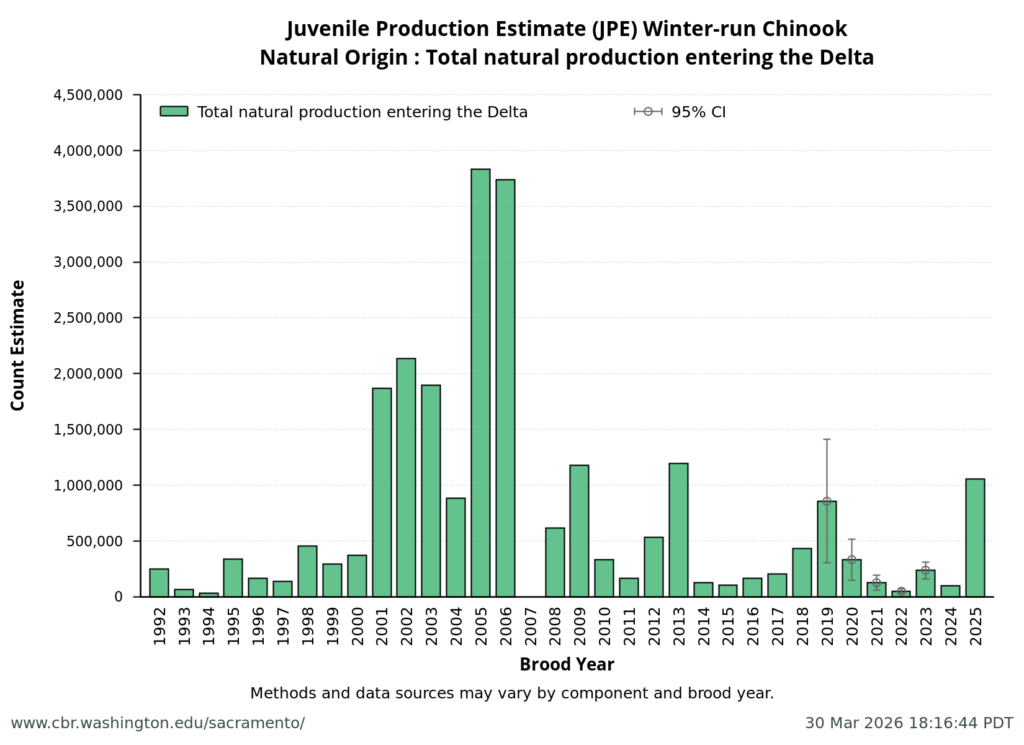
Figure 10. Juvenile Production Estimate (JPE) of winter-run salmon entering the Delta by brood year.
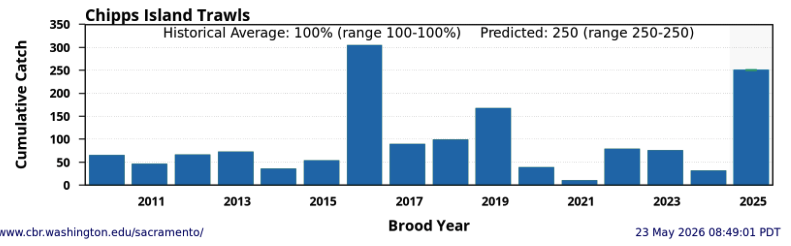
Figure 11. Cumulative catch index of winter-run salmon in Chipp Island Trawl Survey In the east Bay by brood year.
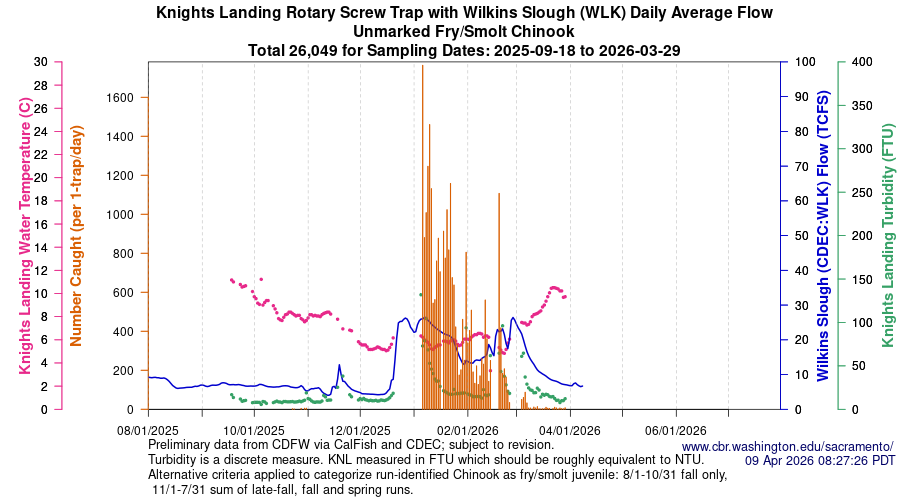
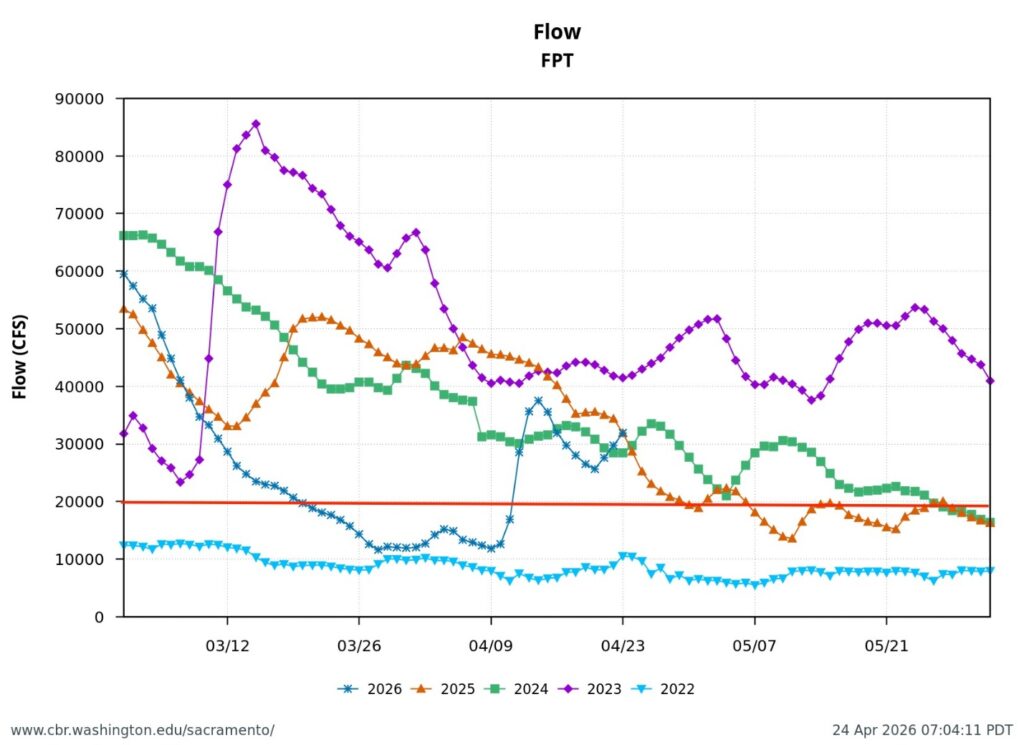
Figure 12. Fry of spring-run and fall-run salmon would enter the Big Notch of the Fremont Weir under these conditions in January-February 2026. The Wilkins Slough flow of the Sacramento River of <30,000cfs indicates most of the flow that would enter the Bypass would be via the Big Notch. Note: Some flow at the Big Notch entrance would also come from the exit of the Sutter Bypass.
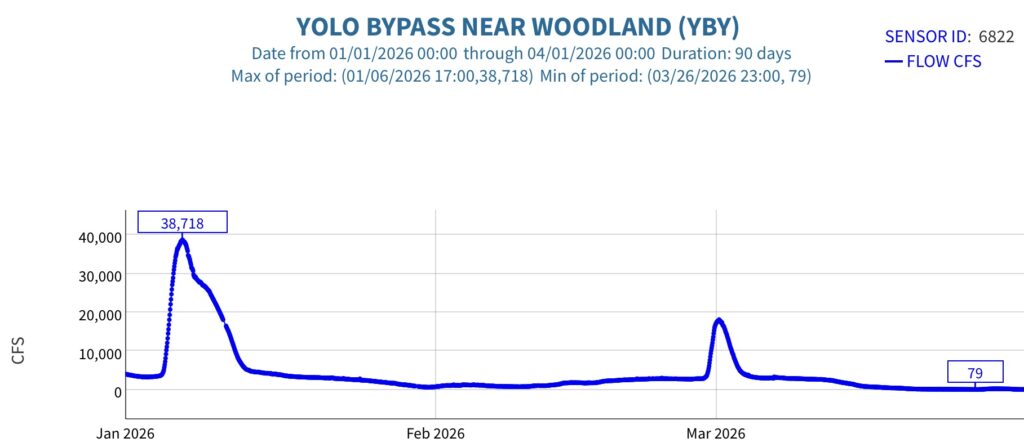
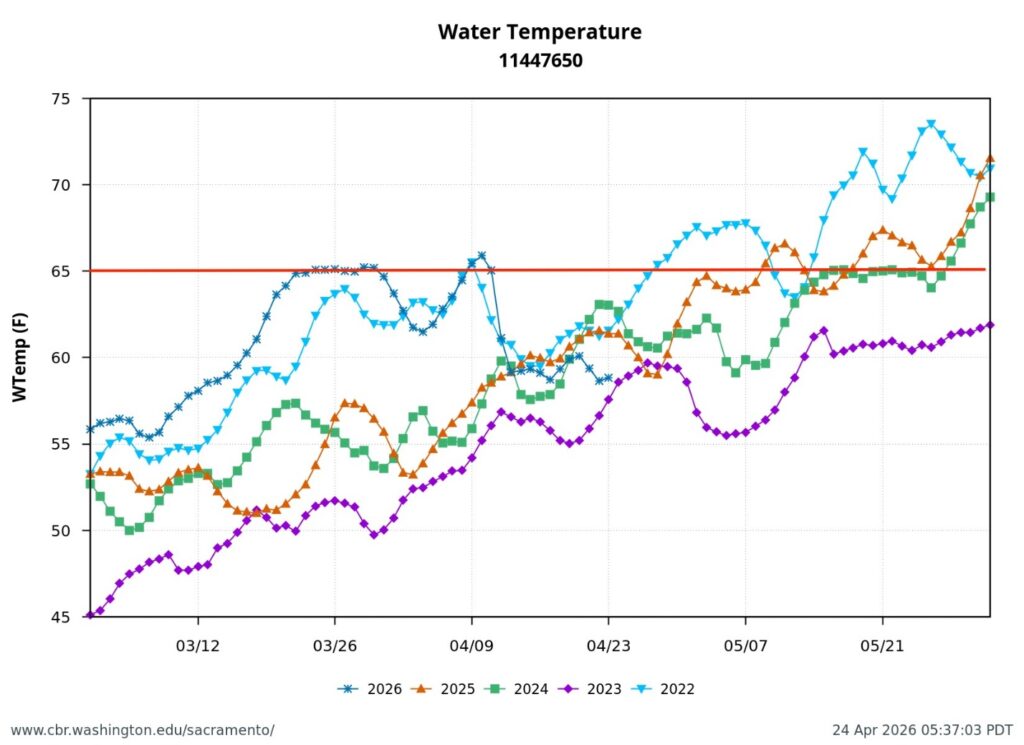
Figure 13. Flow (cfs) in the northern Yolo Bypass in winter 2026. Most of the flow came from the Big Notch. Bypass water temperatures (not shown) were best for salmon fry at 50-55ºF in the January period but reached stressful levels >65ºF in the March period.