The Smelt Working Group (SWG) was created as a requirement of biological opinions for the operation of the State Water Project and Central Valley Project under federal and state endangered species acts (ESA/CESA). The SWG is an eclectic mix of federal and state scientists and engineers whose mandate is to provide recommendations to managers on how operate the Delta to protect the ESA/CESA-listed Longfin and Delta smelt. The group holds weekly meetings. Often the meeting notes do not reflect real concerns of group members. One hopes that this is true in this case; the data and the conclusions don’t appear to line up.
At its April 20, 2015 meeting1, the SWG described the following baseline population conditions:
- The 2014 Fall Midwater Trawl Annual Index for Delta Smelt was 9. This was a record low since the survey began in 1967. With historical indices above 1000 and 600-800 from 2000-2002, an index of 9 is catastrophic.
- Only three Delta smelt were captured in 20-mm Survey #2 (3/30/15-4/8/15). Only one was captured in Survey #3, although an additional 19 were captured at a previously unsampled site further up the Sacramento Deepwater Shipping Channel (4/13-4/16).
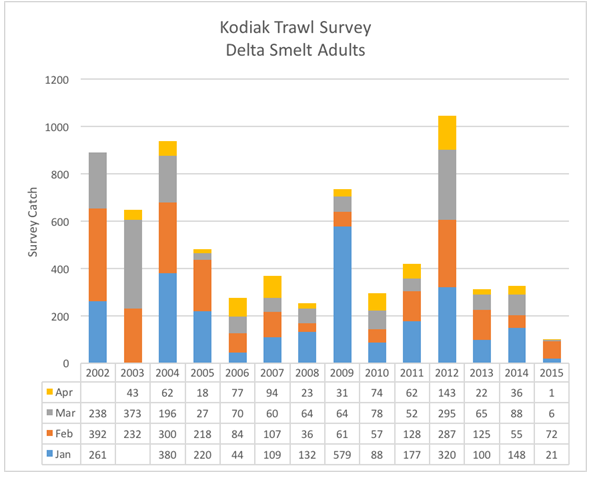
- Spring Kodiak Trawl Survey #4 was in the field the week of April 6, capturing just one Delta smelt. This is also a record low, as were the February and March survey catches.
Delta Smelt
Delta Smelt
The SWG “agreed” on April 20 that there was no need to modify exports from their current 1500 cfs level or to modify Old and Middle River (OMR) reverse flows of -2000 cfs to protect Delta smelt. (They were probably thinking there were no smelt left to be concerned about – see Figure 1). In reality, the risk to the few remaining Delta Smelt from these flows moving towards the south Delta pumps is extremely high, even higher than that for Longfin Smelt.
Longfin Smelt
The SWG also concluded there was no concern for Longfin Smelt (CESA listed only), despite multiple indicators to the contrary.
- Between April 13 and 15, four juvenile Longfin Smelt were salvaged at the CVP pumps and 12 at the SWP pumps; at the same time, a single larva was observed in the larval fish samples at the CVP pumps and four larvae at the SWP pumps. Continued collections in salvage are expected. The SWG concluded that catches in the central and south Delta were not sufficient to reach concern levels based on density or distribution. Note: the odds of a Longfin larvae or juvenile making it all the way to the south Delta, getting through Clifton Court Forebay, and getting salvaged in infrastructure designed to capture much larger fish, are almost infinitesimal. The numbers collected represent a significant take (kill) of Longfin Smelt just from entrainment into the pumping plants. The population’s present distribution and present Delta hydrodynamics support a much higher risk assessment (Figures 2 and 3).
- Larval densities appeared to increase in the central Delta during 20-mm Survey 2. Nonetheless, the SWG concluded that since exports are very low and most larvae are believed to be outside of the region of entrainment, risk of entrainment remains very low. Note: Larval and juvenile Longfin are obviously not outside the influence of the south Delta exports. Net transport of these planktonic fish from the west, north, and central Delta is toward the south Delta.
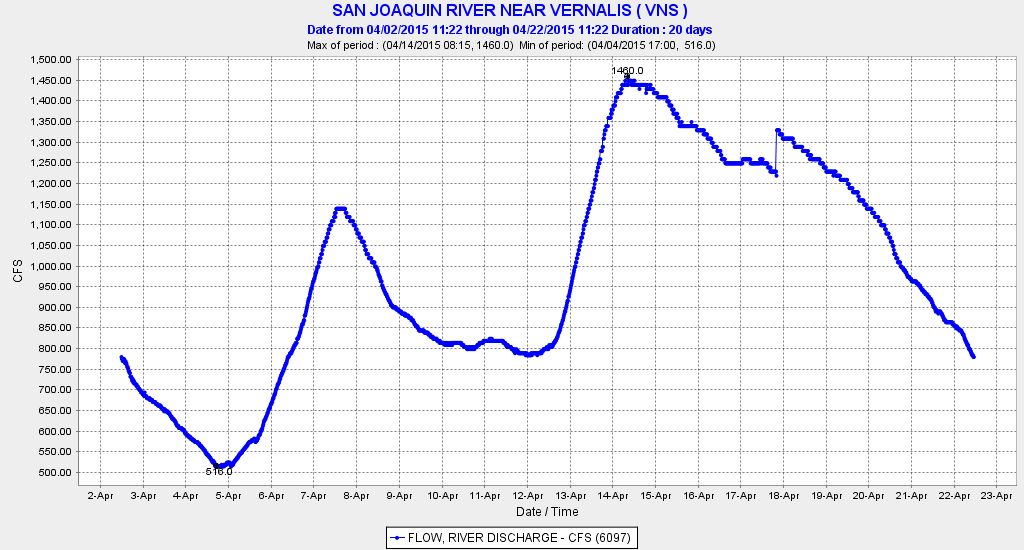
- The SWG concluded that current conditions, particularly the Old and Middle River (OMR) index projected between -1,900 and -2,000 for the week and slightly positive flow at Jersey Point (Qwest), indicate very little risk for fish that do move into or hatch within the central Delta. Thus, they concluded that the overall risk of entrainment remains very low. Note: Figure 3 shows a -2000 cfs Qwest flow at Jersey Pt at Jersey Island. All the indicators show potential for entrainment. The SWG also knew the pulse flow in the San Joaquin River would soon be ending and that conditions (and risk factors) would be worsening in late April.
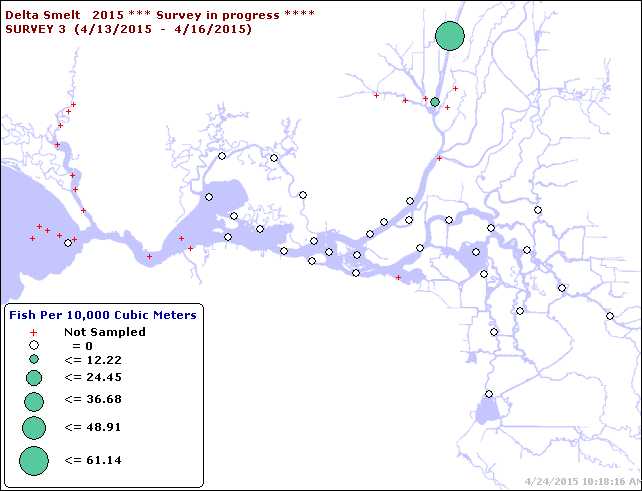
Figure 1. Mid April Delta Smelt distribution in 20-MM Survey2.
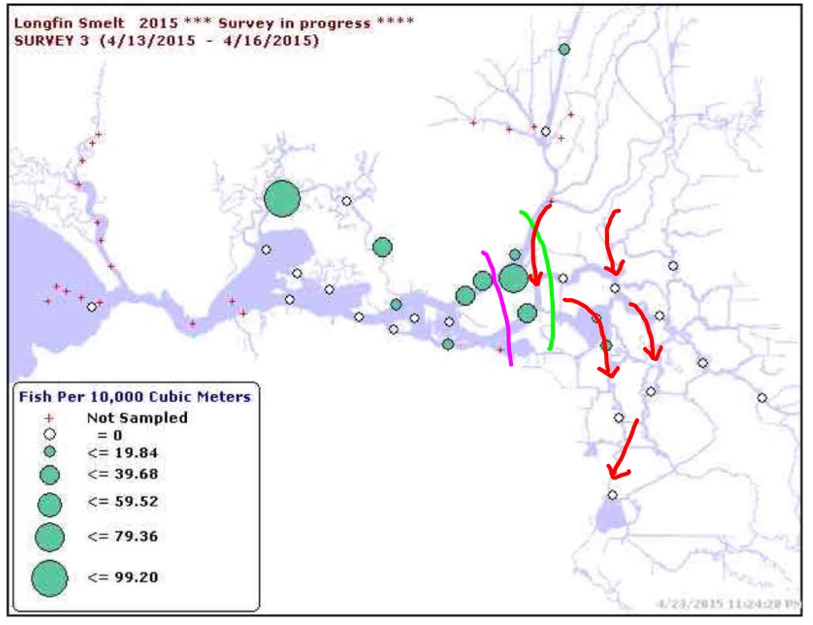
Figure 2. Mid-April Longfin Smelt distribution in 20-MM Survey. Also shown is approximate location of X2 (2640 EC salinity) at magenta line and head of Low Salinty Zone (500 EC salinity) at green line. With real Delta outflow near zero, Delta inflow is predominantly from north and passes across the Delta red arrows to south Delta export pumps. A portion of the inflow passes through the upper Low Salinity Zone (between magenta and green lines). Net negative flows and tidal pumping (high volume flood tides) move smelt into central and southern Delta.
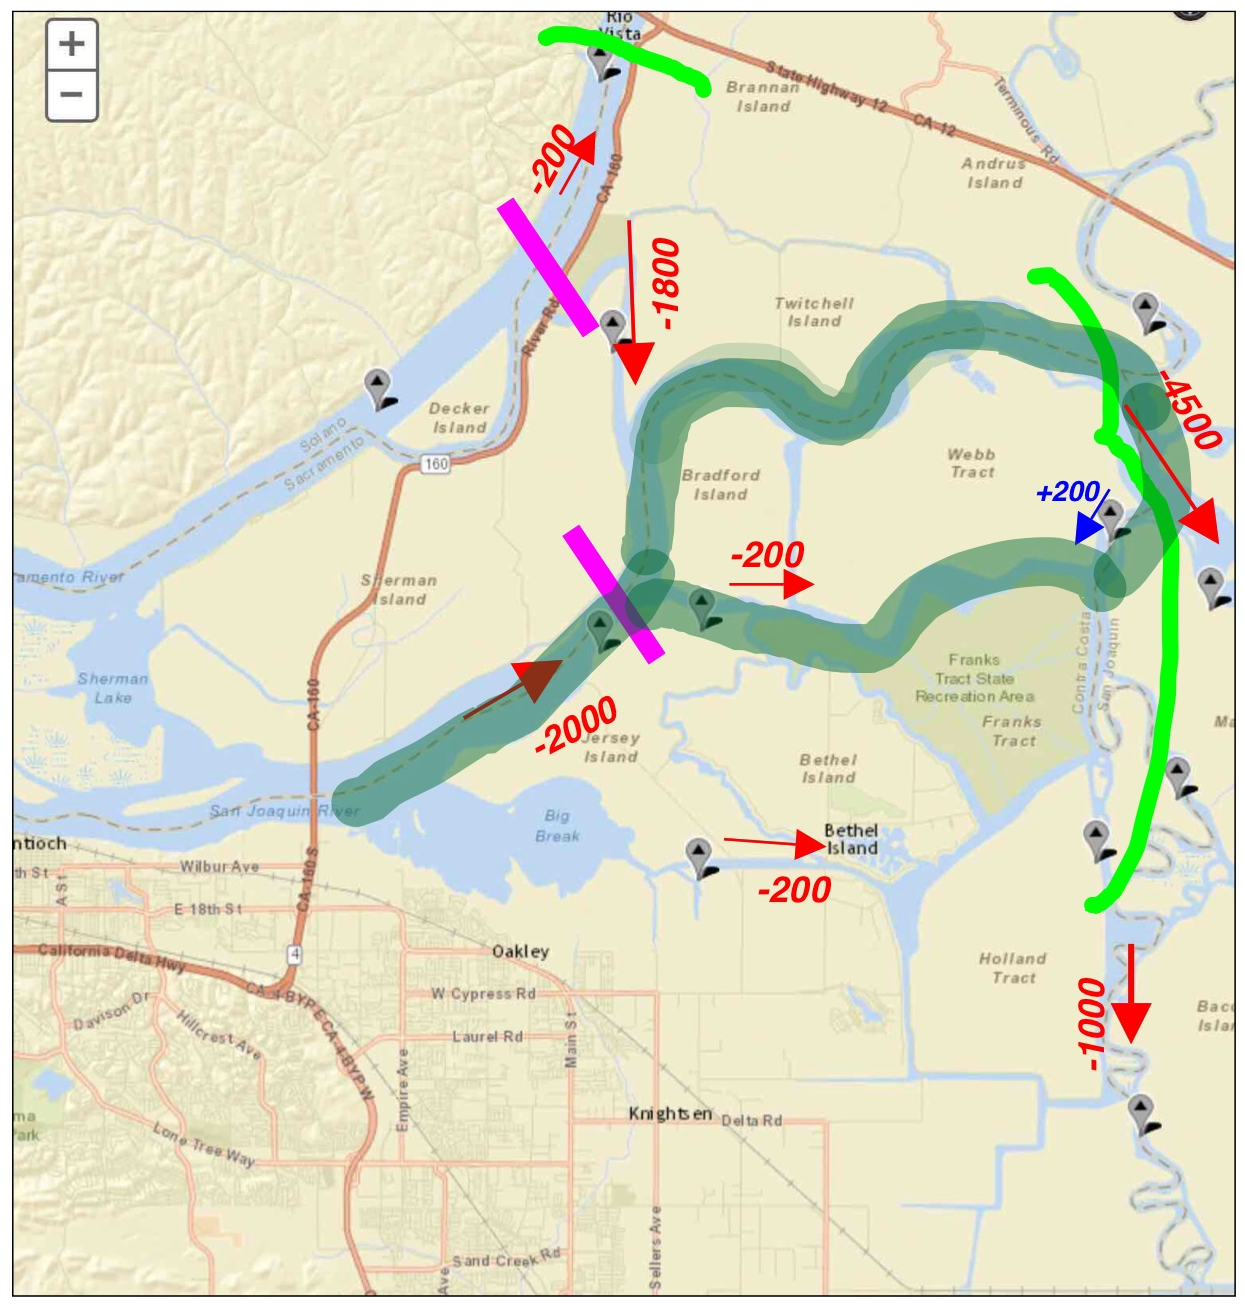
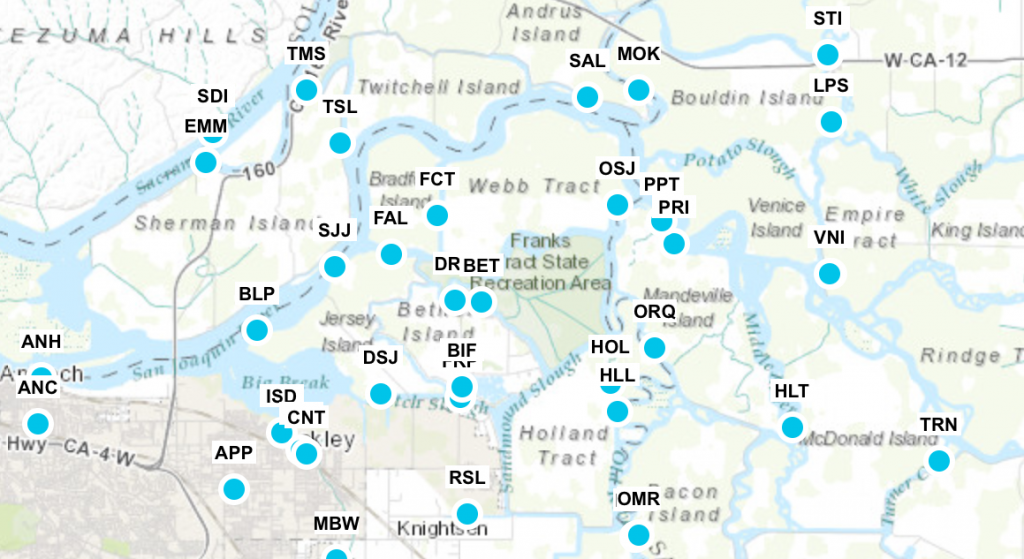
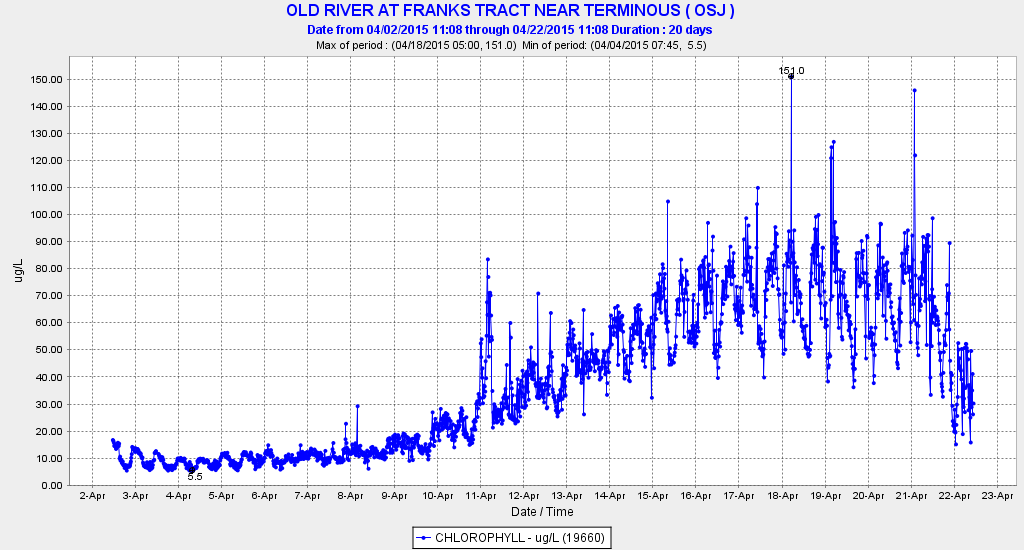
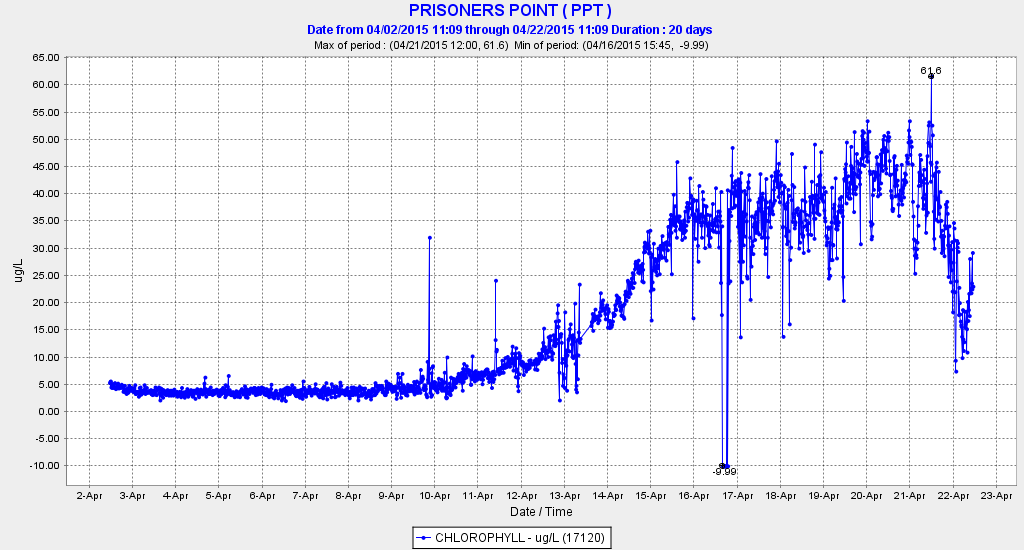
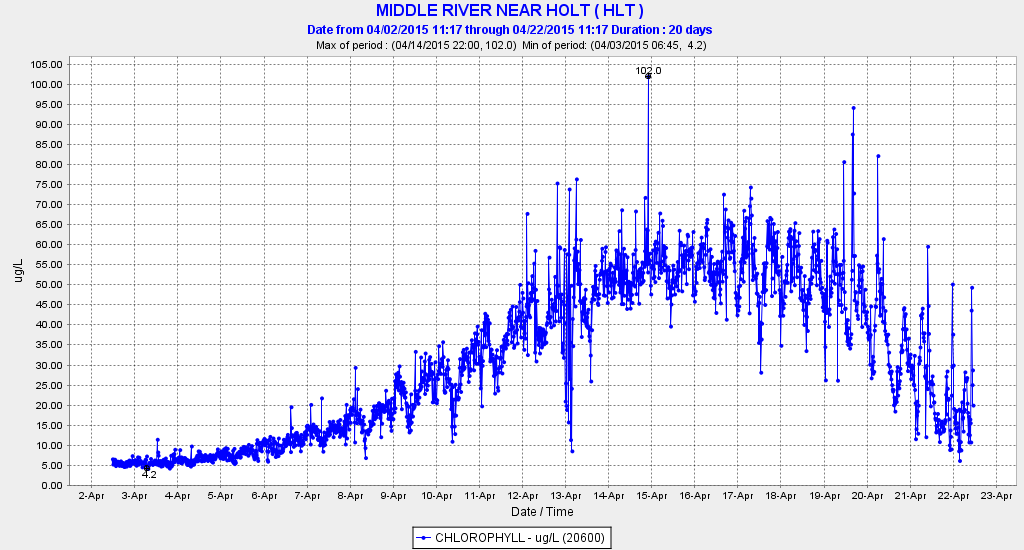
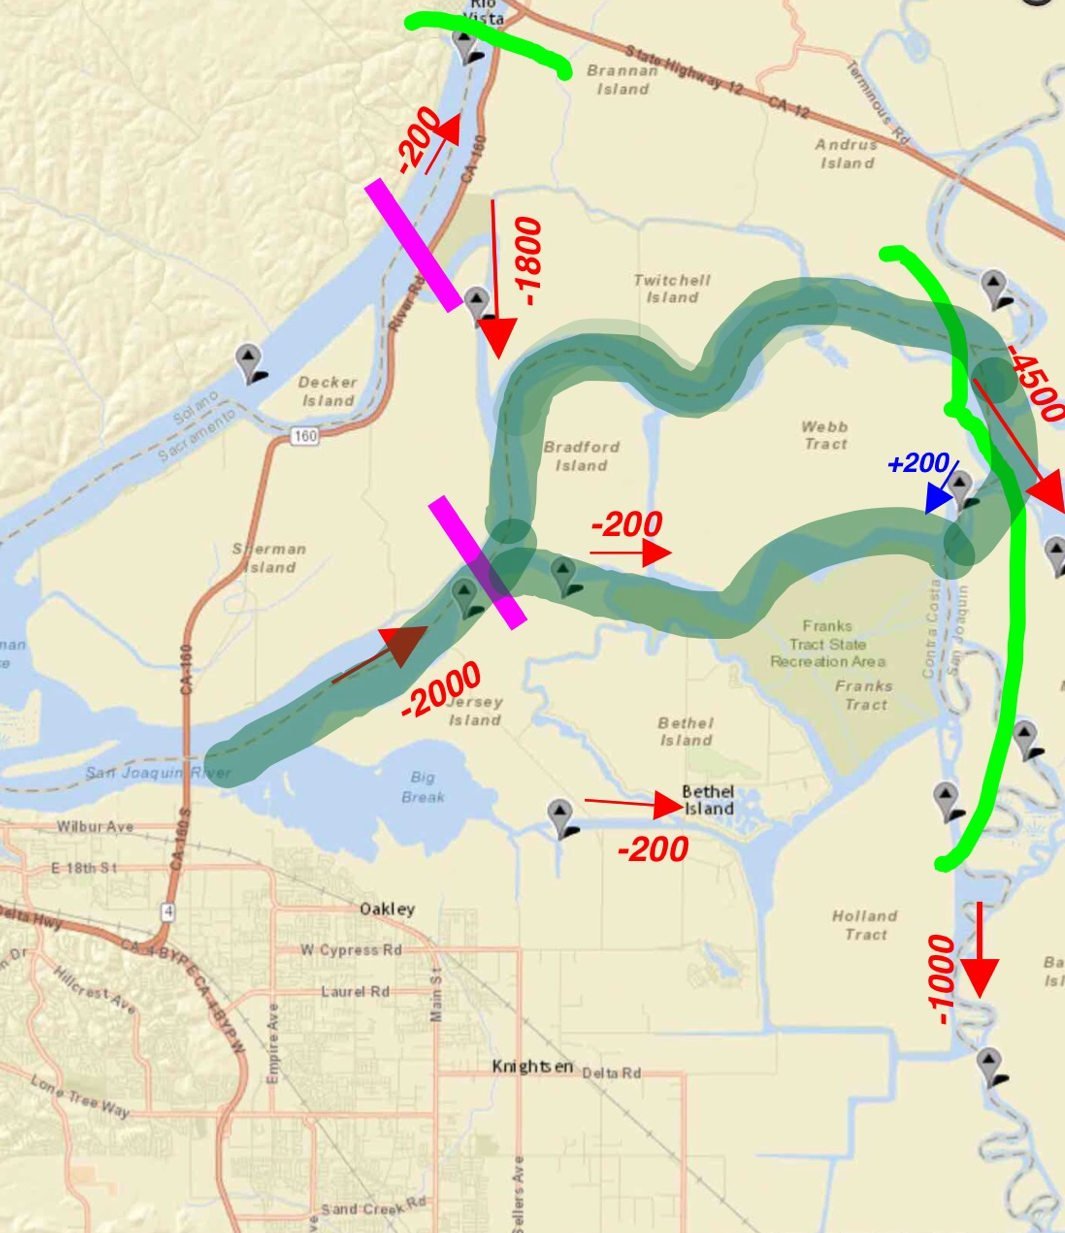
Figure 3. Net hydrodynamic conditions during mid-April “spring” tides (highest elevation of flood tide in April lunar cycle). Magenta line is high tide location of X2 (2640 EC salinity). Light green line is high tide location of head of Low Salinity Zone (500 EC salinity). Longfin and Delta smelt larvae generally concentrate in waters whose salinity is between these two values. Net flow direction is shown with arrows, red being negative. Dark green highlight area is approximate location of mid-April central Delta plankton bloom (chlorophyll levels above 10 micrograms per liter). (Data sources: CDEC and USGS.)