The 2008 Delta Smelt Biological Opinion for Central Valley Project (CVP) and State Water Project (SWP) operations included the Fall X2 Action to protect Delta smelt. The about-to-be implemented “Action 5” that will modify the 2024 biological opinions for the CVP and SWP will eliminate the Fall X2 Action entirely.
The Fall X2 Action required the CVP and SWP to keep brackish water west of the Delta in September and October in wet and above normal water years. The X2 location is defined as the location where salinity is 2 parts per thousand.1 X2 is located within what is known as the low salinity zone (LSZ, 1-6 parts per thousand).
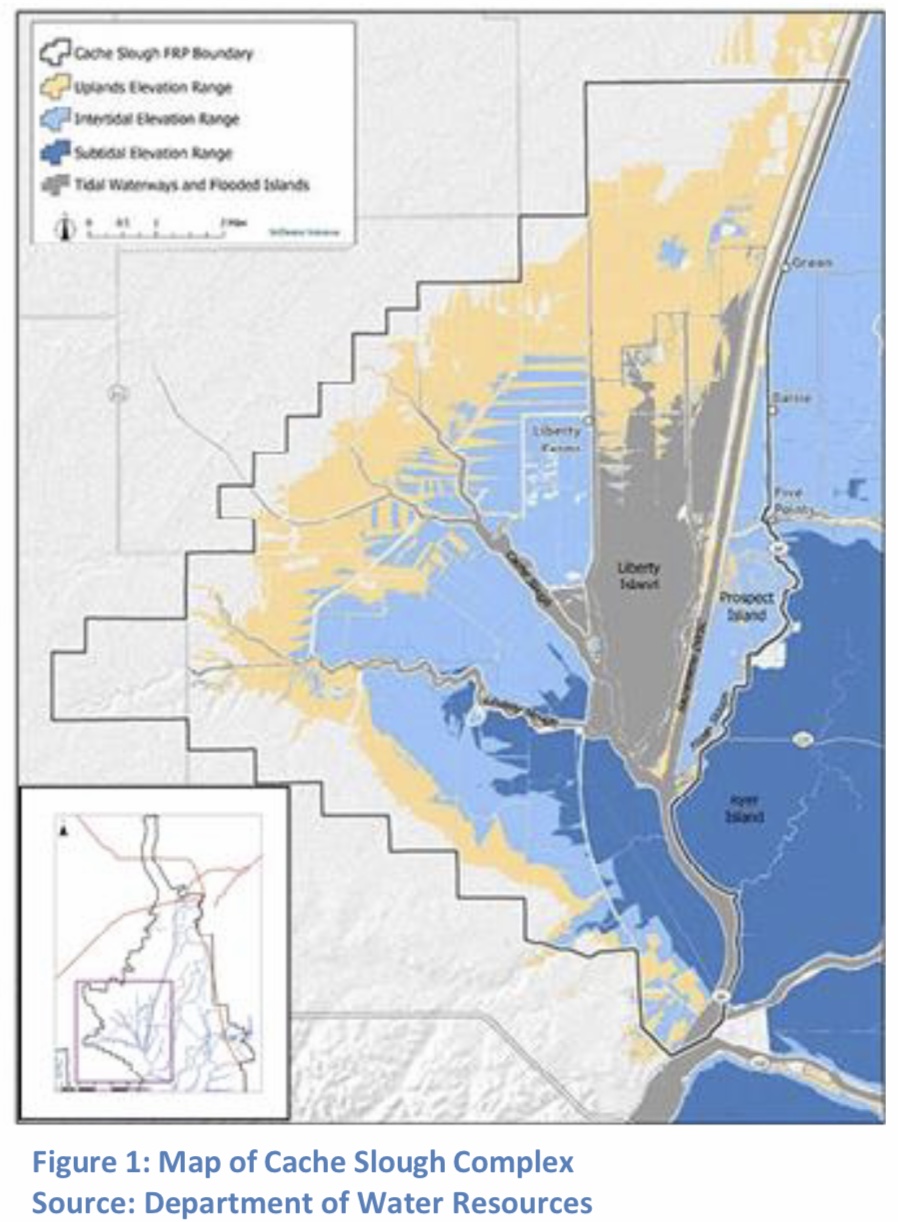
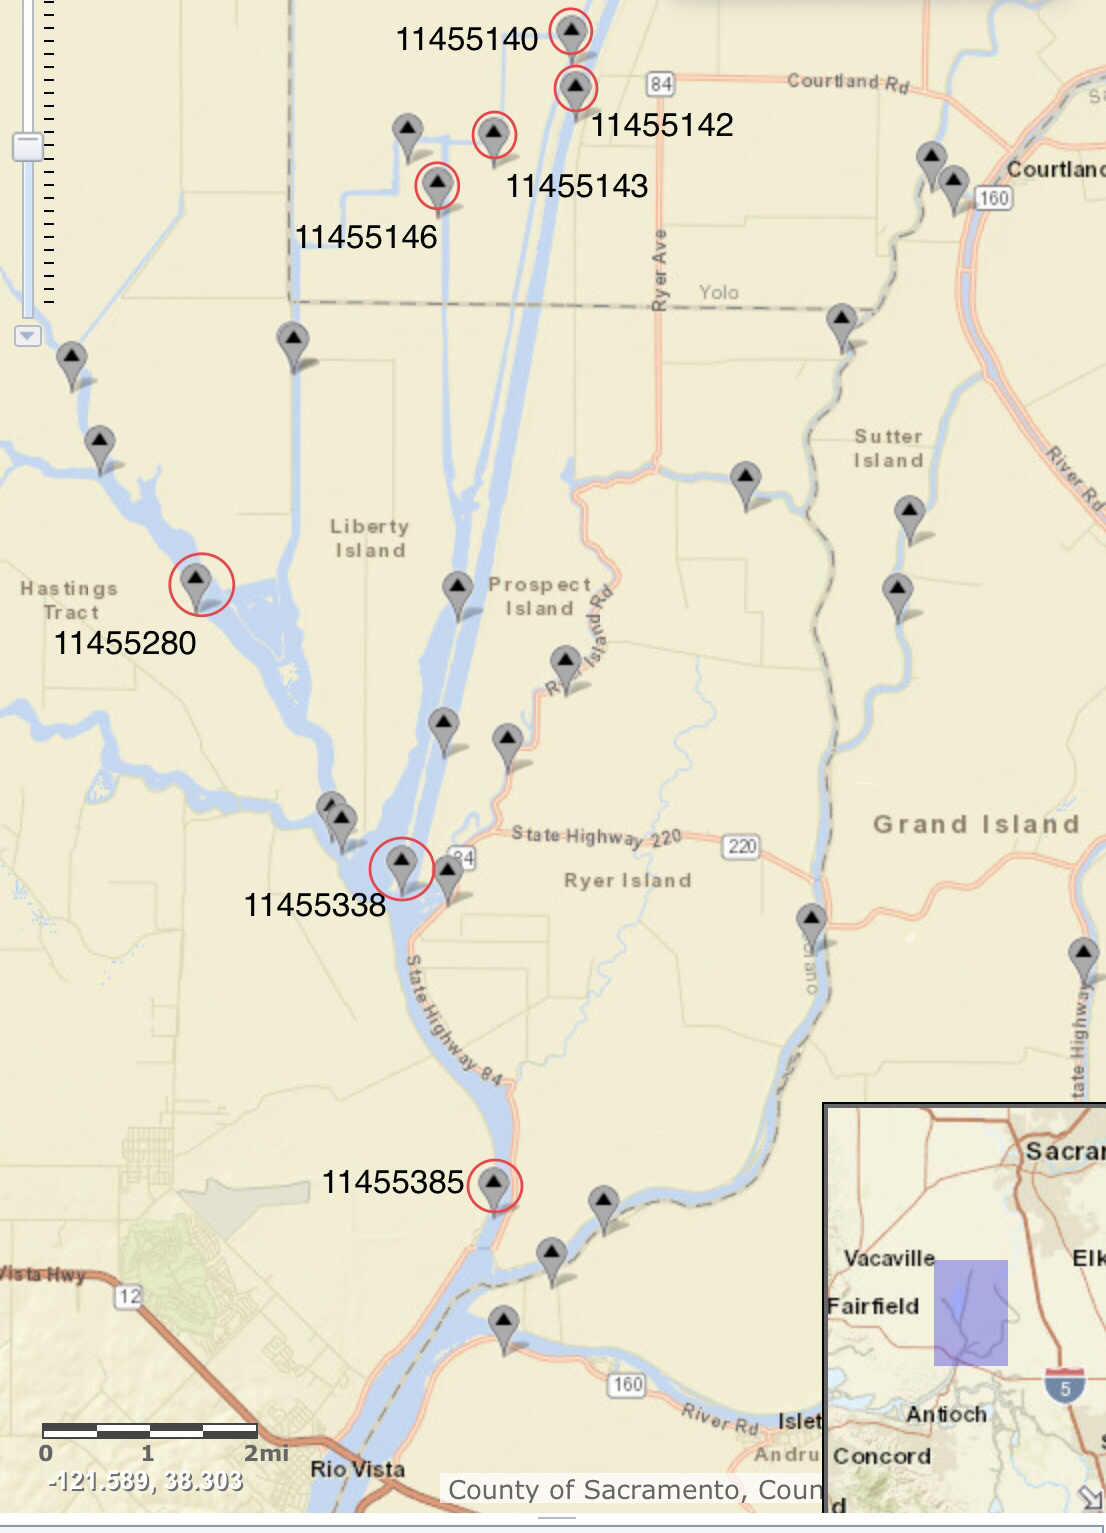
Delta smelt and longfin smelt concentrate in the LSZ near X2 in summer and fall. Keeping X2 at Chipps Island (KM 71 from the Golden Gate, Figure 1) benefits the populations of Delta smelt and longfin smelt. Less effective options for the Fall X2 Action that require less Delta outflow have included other locations as far east as KM 80.
If freshwater outflow from the Delta is too low (at or below about 6000 cfs), the LSZ is located within the narrow channels of the west Delta. Water in the west Delta tends to be warmer and less productive than water in Suisun Bay. It is also more likely to be pulled south by pumping at the CVP and SWP’s south Delta export facilities.
The higher freshwater inflows needed for the Fall X2 Action also benefit other native fishes in the lower Sacramento River, its tributaries, and the Delta.
Harm comes to Bay-Delta fish in the form of high water temperatures and reduced food concentrations. When water temperatures climb into the range of 70-72°F, native fishes, including smelt, sturgeon, steelhead, and salmon, generally suffer stress-related poor growth and survival.
Warm Delta water blocks or hinders adult salmon in their upstream spawning migrations. (A water temperature of 72°F is the salmon avoidance temperature.) Adult salmon will hold in the Bay because of warm water temperatures, resulting in delayed spawning and the expenditure of the critical energy needed for spawning. Warm rivers cause further delay, diseases, and thiamine deficiency, reducing the ability of salmon to spawn successfully. Higher water temperatures (> 65°F) during spawning migrations also lead to reduced salmon egg and embryo survival. High water temperatures in juvenile rearing habitat and emigration routes lower the growth and survival of juvenile salmon, steelhead, smelt, and sturgeon, and increase predation on all these species.
In the Delta specifically, high water temperatures in the Delta block emigration of juvenile salmon and reduce growth rates and survival of juvenile salmon and smelt. Both salmon and smelt species are highly sensitive to warm and varying water temperatures. Heat transfer and retention during high air temperatures from late-spring to early-fall is greater at lower flows.
In summary, water temperatures above 72°F are highly stressful on native Bay-Delta fishes, often leading to poor growth, low-oxygen stress, more disease, greater susceptibility to predation, and competition from non-native fish, all of which lead to reduced survival. Also, many non-native fish such as largemouth bass thrive in higher water temperatures (72- 80°F).
The Fall X2 Action
The Fall X2 Action focuses on increasing Delta inflow and outflow in the months of September and October when seasonal flows are naturally lower and irrigation demands less, while air temperatures remain high. Late summer and early fall are a key period in the life cycle and overall reproductive success of many Bay-Delta native fishes.
Bay-Delta
The Fall X2 Action is needed to maintain low salinity and water temperature in the optimal range of native Bay-Delta fish. In the 2017-2019 period, with two wet years and one below-normal year, the higher prescribed Delta outflow (DTO) of the Fall X2 Action (Figure 2) in the wet years kept the Bay fresher (Figure 3) and Delta outflows cooler (Figures 4 and 5). In the two above-normal years of 2024 and 2025, the lack of a Fall X2 Action in September 2025 (Figure 6) led to high September water temperatures in the western Delta (Figure 7). The lack of Fall X2 Action in October 2024 (Figure 6) contributed to stressful (>65º F) October water temperatures at Rio Vista bridge in the west Delta (Figure 7). 2020, a below normal water year, provides another example of high September-October water temperatures when the Fall X2 Action was not implemented (Figure 8).
Lower Rivers
The Fall X2 Action requires roughly 5000 cfs of extra Delta inflow for two months (assuming needed flow is not provided by foregone river diversions or Delta exports). Releases from Shasta, Oroville, and/or Folsom reservoirs generally provide this inflow. That amounts to roughly 10,000 acre-feet of water per day, or 600,000 acre-feet for the full September-October period. In recent wetter water years, the CVP and SWP have offset some (or all) of this water cost by reducing reservoir releases in the summer and not meeting water quality standards for water temperatures in the lower Sacramento River. Flows in the lower Sacramento River at Wilkins Slough have been near 5000 cfs, when it takes about 10,000 cfs to maintain the 68º F standard.
The Cost
In summary, the amount of fresh water required to keep X2 in Suisun Bay in late summer and early fall of above-normal and wet water years requires approximately 600,000 acre-feet of stored project water or forgone diversions from rivers and exports from the Delta. That amounts to about 5% of total CVP and SWP storage capacity. It is also about 5% of the total annual upstream, in-Delta, and Delta export water use in the Bay-Delta watershed.
The about-to-be implemented “Action 5” that will modify the 2024 biological opinions for the CVP and SWP will eliminate the Fall X2 Action, and this water cost, entirely.
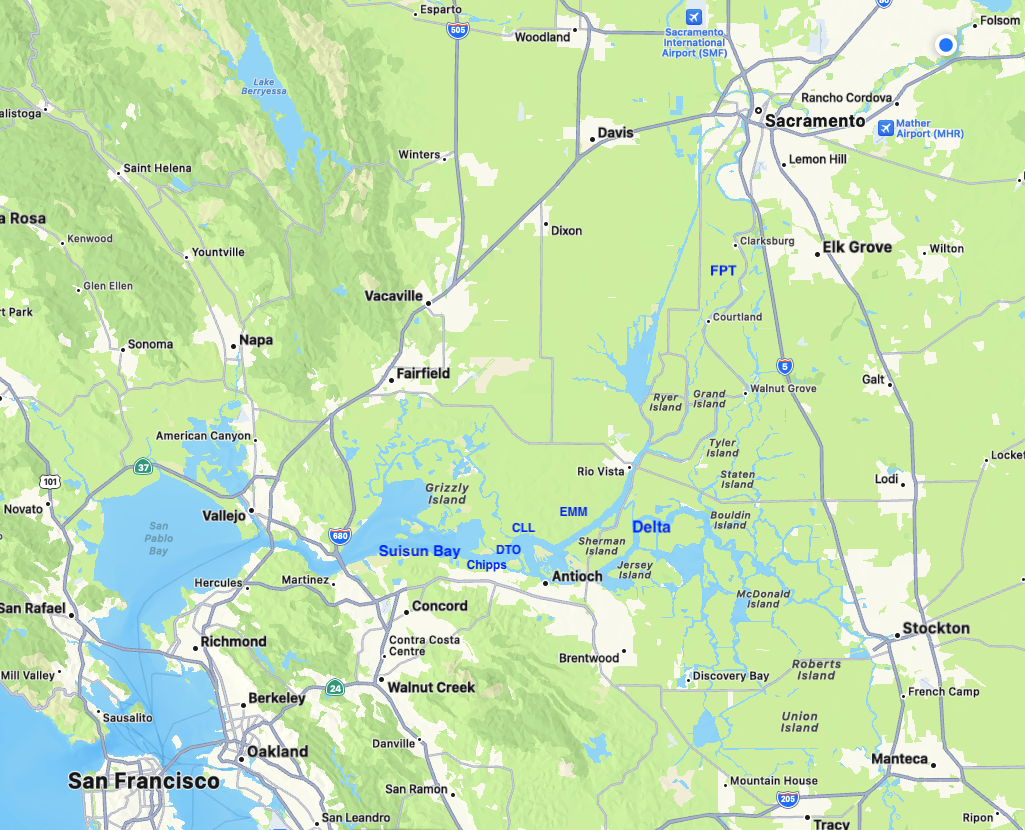
Figure 1. Bay-Delta and key water accounting and water quality locations.
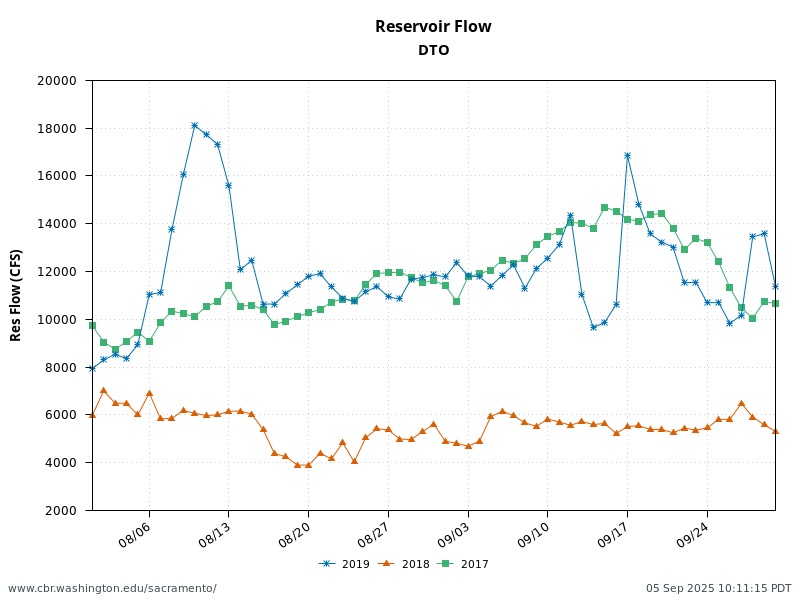
Figure 2. Daily average Delta outflow (cfs) in September-October of water years 2017-2019. Fall X2 Action was implemented in wet year 2017 and 2019.
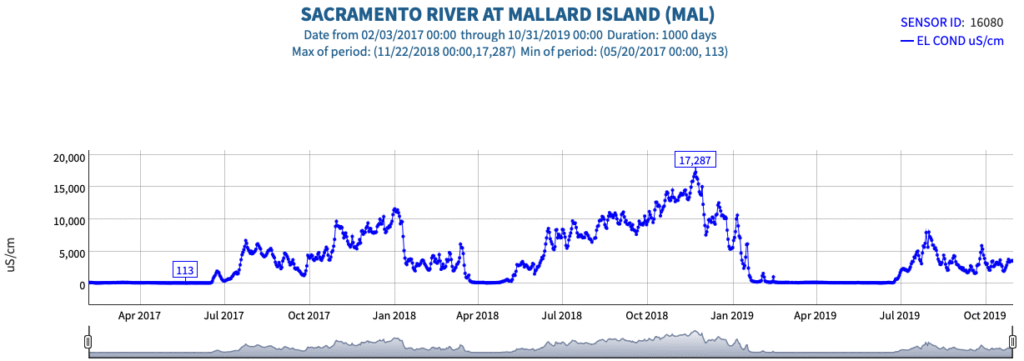
Figure 3. Salinity (EC) of east Bay near Chipps Island at Mallard Slough 2017-2019.
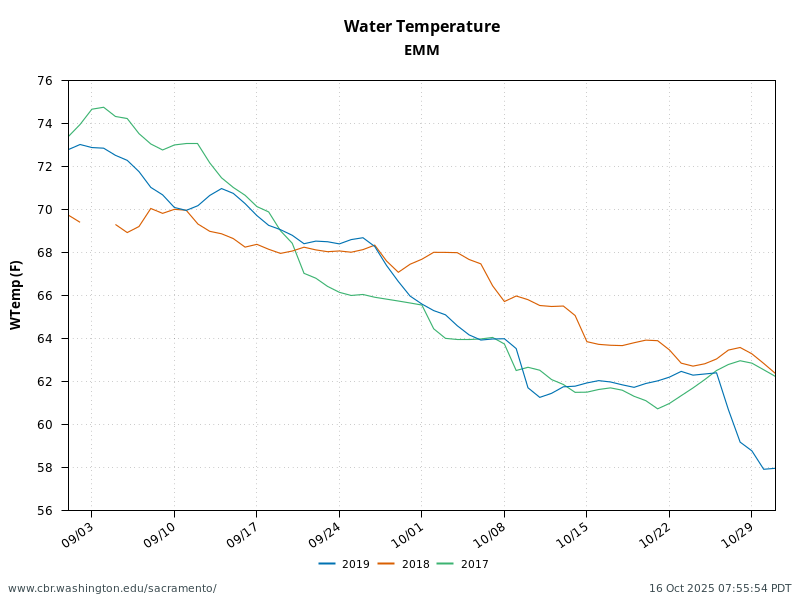
Figure 4. Water temperature in west Delta at Emmaton in September-October 2017-2019.
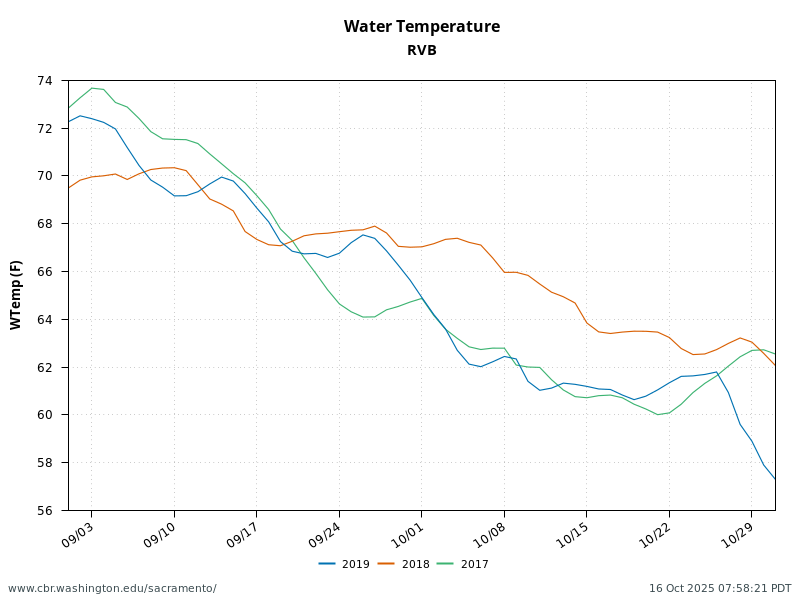
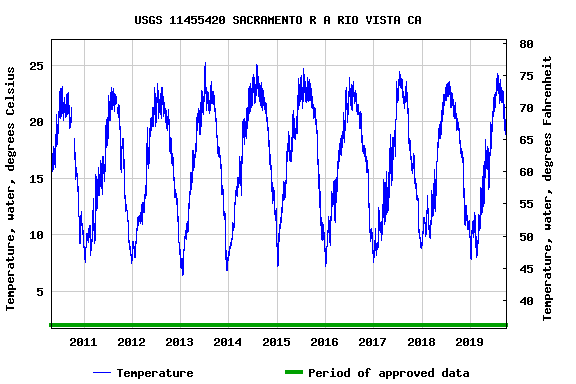
Figure 5. Water temperature in west Delta at Rio Vista in September-October 2017-2019.
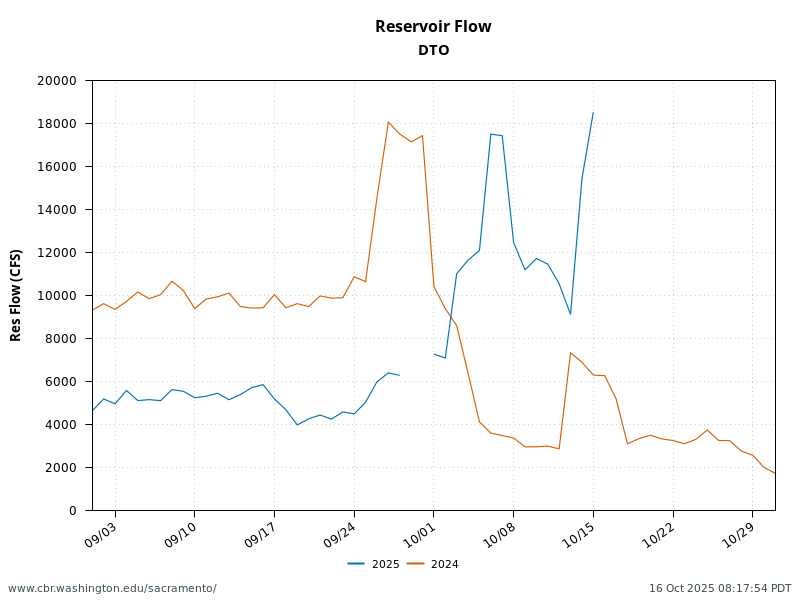
Figure 6. Daily average Delta outflow (cfs) in September-October of above-normal water years 2024 and 2025. Fall X2 Action was implemented in September of 2024 and October of 2025.
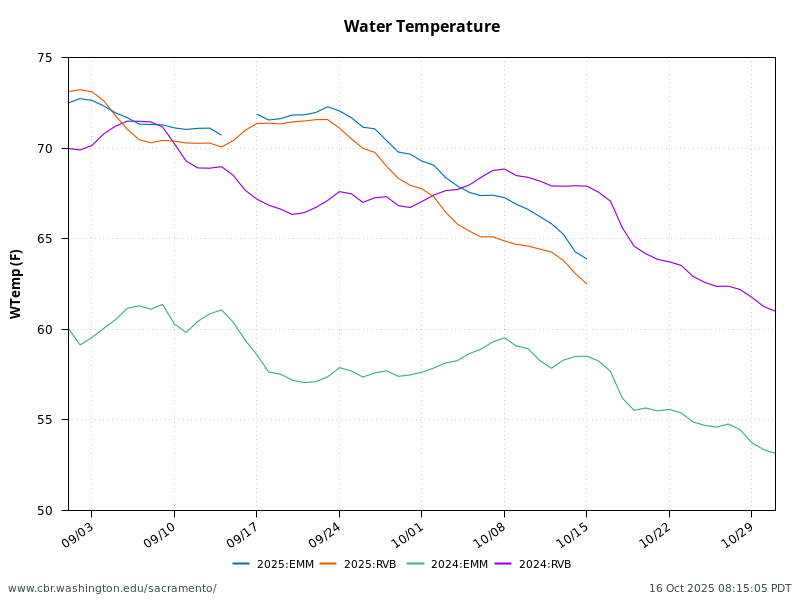
Figure 7. Water temperature in west Delta at Emmaton and Rio Vista in September-October 2024 and 2025.
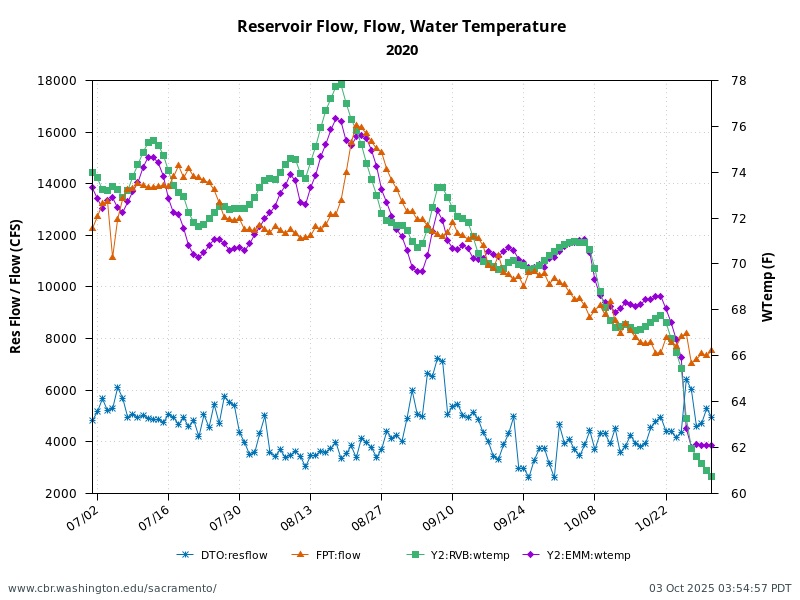
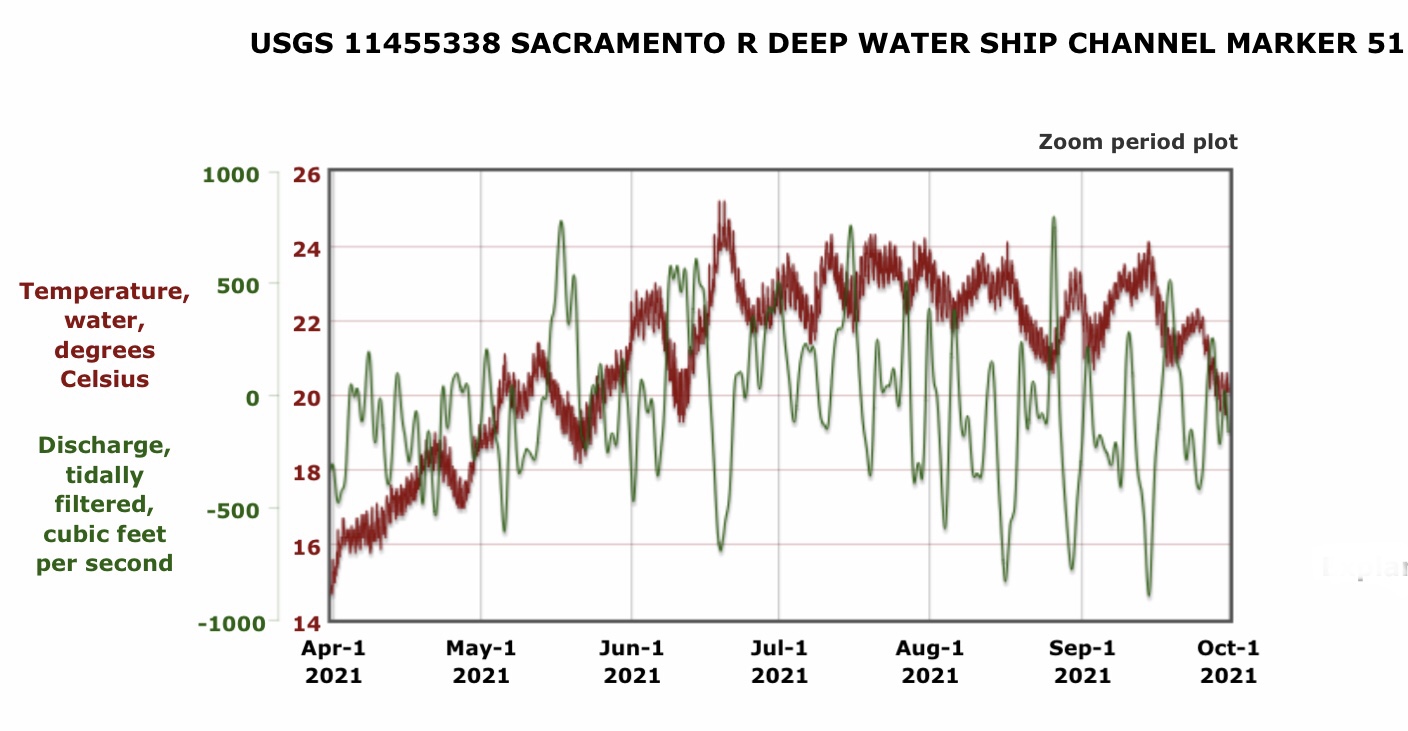
Figure 8. Daily average Delta outflow (cfs), Freeport river flow, and Emmaton and Rio Vista water temperature in July-October of water year 2020. The Fall X2 Action was not implemented in below-normal water year 2020.
- Also measured as about 3000 EC. See https://pubs.usgs.gov/sir/2014/5041/pdf/sir2014-5041.pdf ↩