Reclamation Begins Summer Shasta Operations that Sacrifice Endangered Winter-Run Chinook Salmon to Power Production and Irrigation Deliveries

Reclamation has begun its planned summer operation for winter-run salmon in this critically-dry summer of 2021. After delivering a lot of warm surface water from Shasta Reservoir to its downstream contractors this spring,1 Reclamation has now begun dipping into Shasta’s cold-water pool (Figures 1 and 2). Reclamation’s summer operation will encourage the holding salmon to spawn and, for a time, ensure the eggs can survive in the primary ten-mile spawning reach downstream to the mouth of Clear Creek (CCR). Reclamation’s plan would subsequently raise water temperatures later in summer, after peak spawning and embryo development have occurred.

In first five days (June 17-22) of the new operation, Reclamation met its target temperature. It has released about 8000 cfs of 53ºF water from Keswick Dam to the Sacramento River near Redding (Figure 3). It achieved the target by blending hydropower-peaking flows from Shasta and Whiskeytown dams in Keswick Reservoir, and then releasing the blended water to the Sacramento River below Keswick Dam. During this time, Reclamation released an average of 6500 cfs from Shasta Dam at 50-51ºF, and an average of 1200 cfs at 53ºF through the Spring Creek Powerhouse (SPP) from Whiskeytown, into Keswick Reservoir.

This operation is not sustainable over the summer. It uses more of the cold-water-pool volume than is necessary to maintain temperature control. It sacrifices the cold-water pool in order to continue power peaking and to maintain relatively high downstream irrigation deliveries. Considering all of the factors pushing Keswick release temperatures higher over the summer, there will not be enough cold water by the end of the summer to protect salmon.

High Shasta Dam releases in the afternoon and evening to meet peak power demands pull more water from the warmer surface waters of the reservoir (Figures 4-6). This then requires blending with cold-water releases to keep Keswick water cooler. A similar situation occurs with the Whiskeytown releases (Figure 7-8). In addition, water in Whiskeytown becomes progressively warmer over the summer and requires an ever-increasing amount of Shasta’s cold-water pool to cool that water. Atmospheric heating combines with heating of water from Shasta during power-peaking operations to further affect Keswick Reservoir’s water temperatures (Figures 9 and 10).

Reclamation’s current high demands on Shasta’s cold-water pool will thus require reverting in late summer to warmer water releases. This will lower the survival of late summer spawners and their eggs. It will also leave little cold water for fall-run salmon in October and November. Reclamation is willing to accept these trade-offs to make relatively high power and irrigation deliveries.

To reduce the loss of winter-run (and fall-run) salmon this summer, CSPA and two other organizations submitted an alternative Temperature Management Plan (CSPA TMP) to the State Water Board on May 23, 2021. The CSPA TMP would provide better summer water temperatures and salmon egg survival. The CSPA TMP, comprised of a transmittal letter, descriptive elements and spreadsheet, proposes a release of just 5000 cfs of 52-53ºF water from Shasta Dam’s gates and minimal warmer water inputs from Whiskeytown/Trinity. The CSPA TMP proposes a 5000 cfs release of 53-54ºF water from Keswick, with less daily peaking power production to limit withdrawals of warm water from the surface of Shasta reservoir.

The CSPA TMP would minimize impacts to the salmon and save approximately 200,000 acre-feet of Shasta storage. It would also save 200,000 acre-feet of Trinity storage. It would greatly reduce power production from five system powerhouses, though power generation capacity would still be available for periods of extreme power demand.

Above all, the CSPA TMP would reduce water supply deliveries in the Sacramento Valley and eliminate water transfers from Shasta in the summer and fall. Reclamation is willing to sacrifice a substantial portion of the Sacramento River’s salmon in order to prioritize agricultural water deliveries. The CSPA TMP prioritizes a system operation that will reasonably protect salmon, and allocates water supply based on the water that is available within the constraints of that operation.

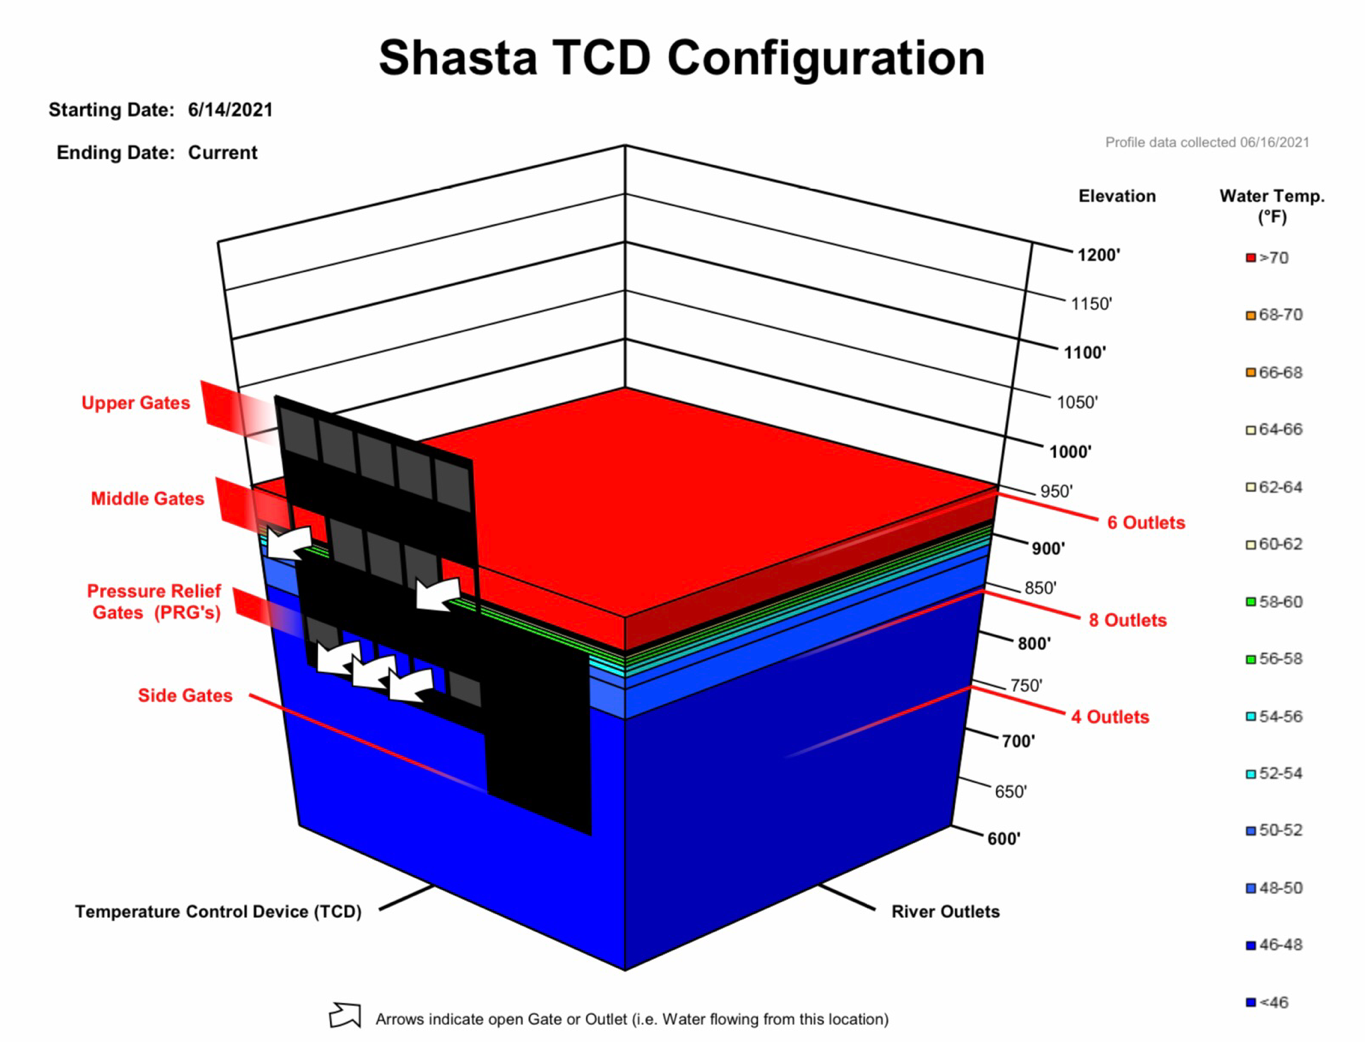
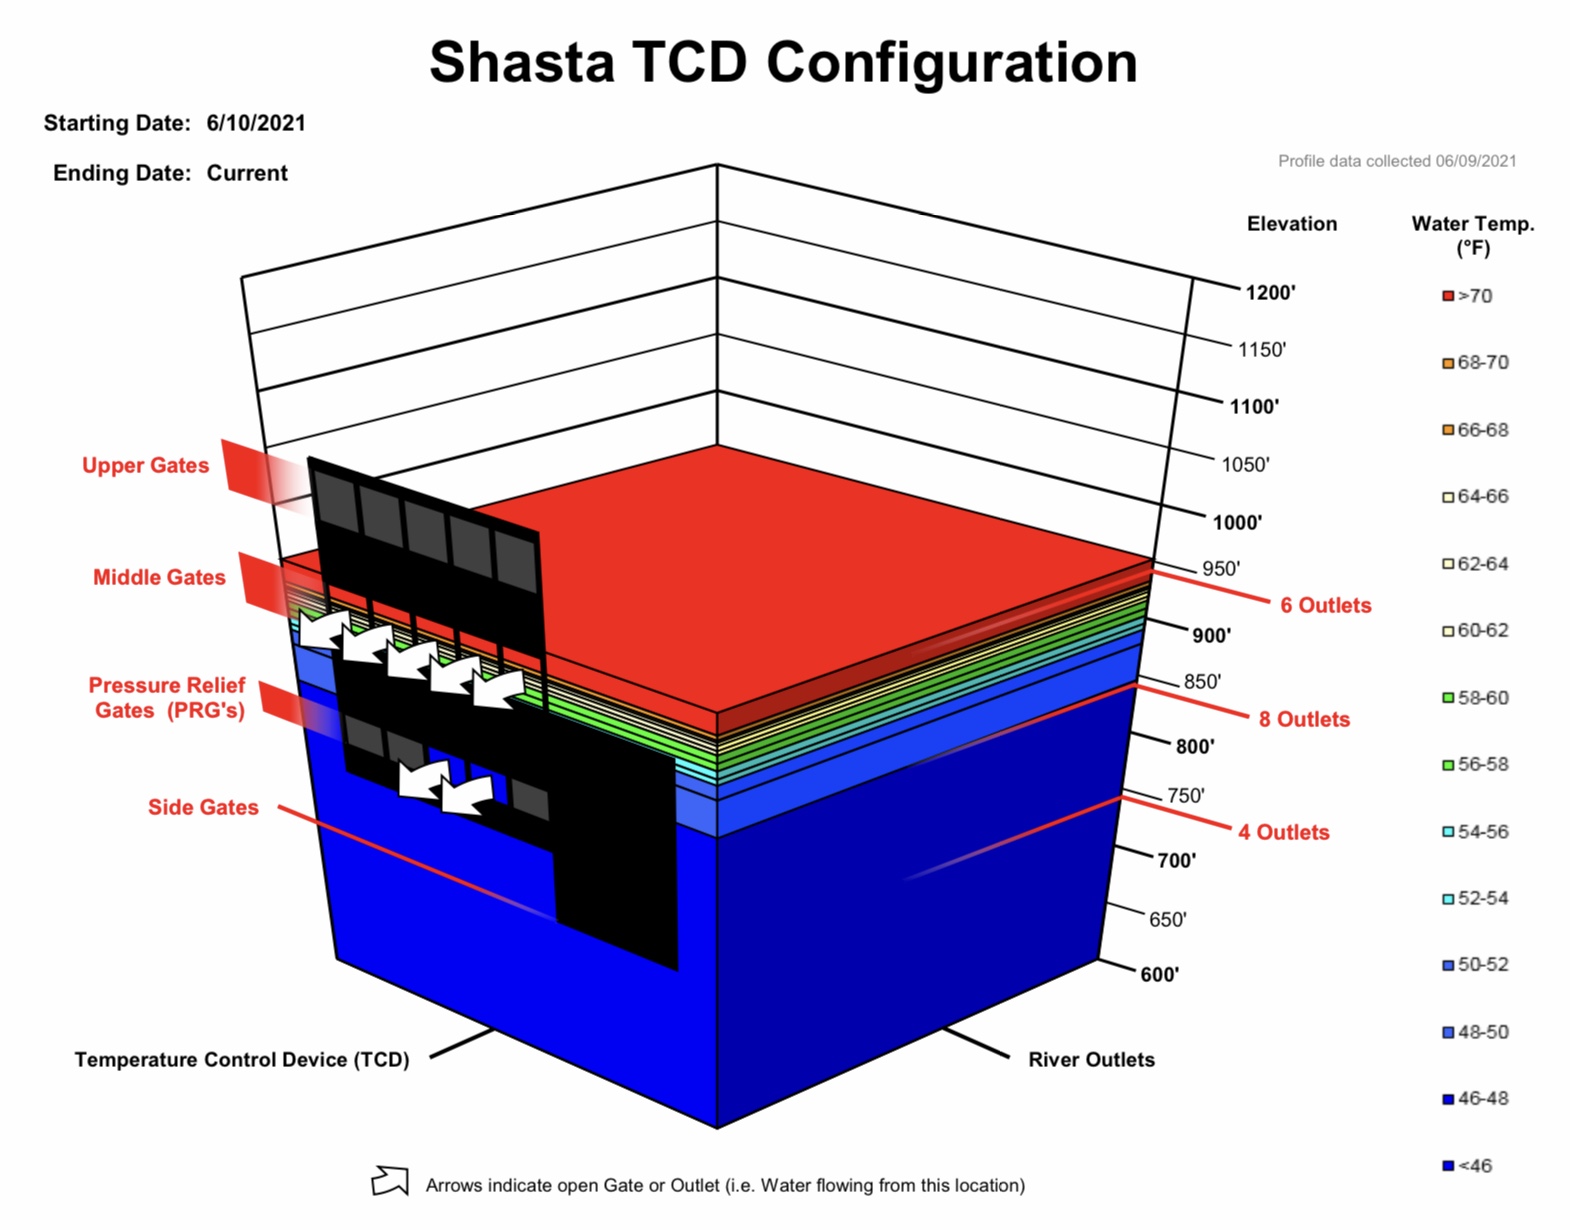
Figure 1. Shasta Dam infrastructure and operations, and cold-water pool conditions, during the June 17-22 period. Note water release from PRG gates, drawing from the layer of water less than 48ºF, and release from middle gates of water that is 70ºF or warmer. The combined flow release from the Temperature Control Device was 6000-7000 cfs of 51-52ºF water.

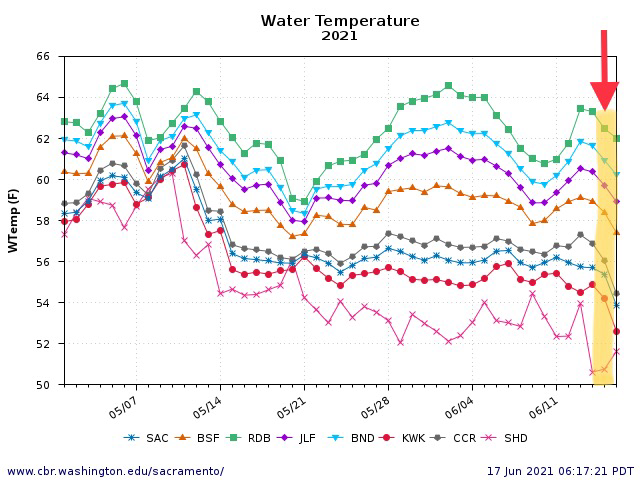
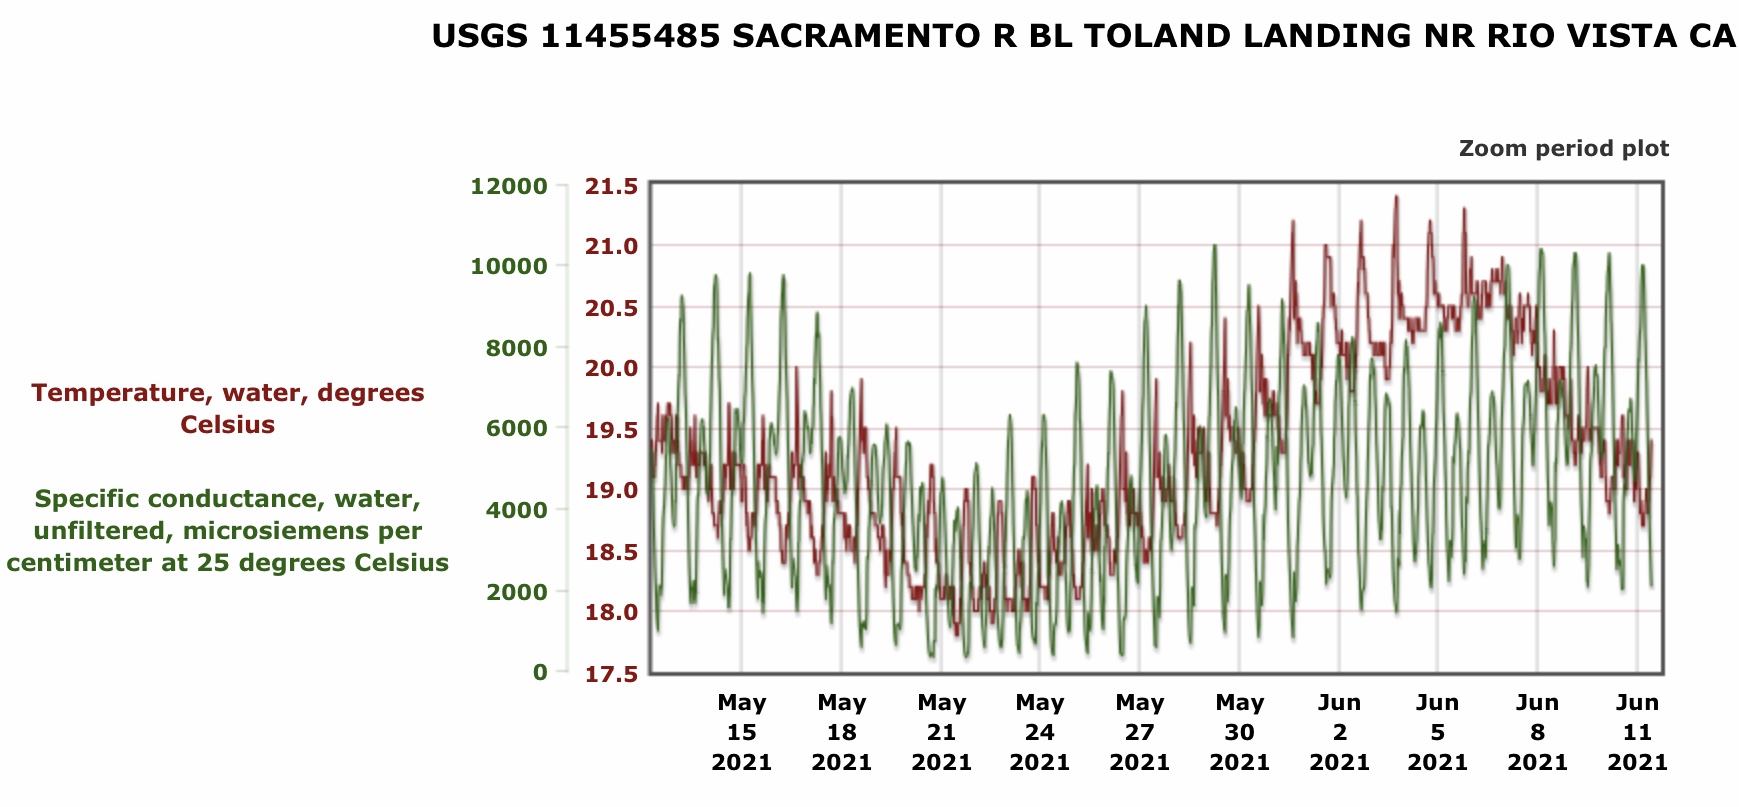
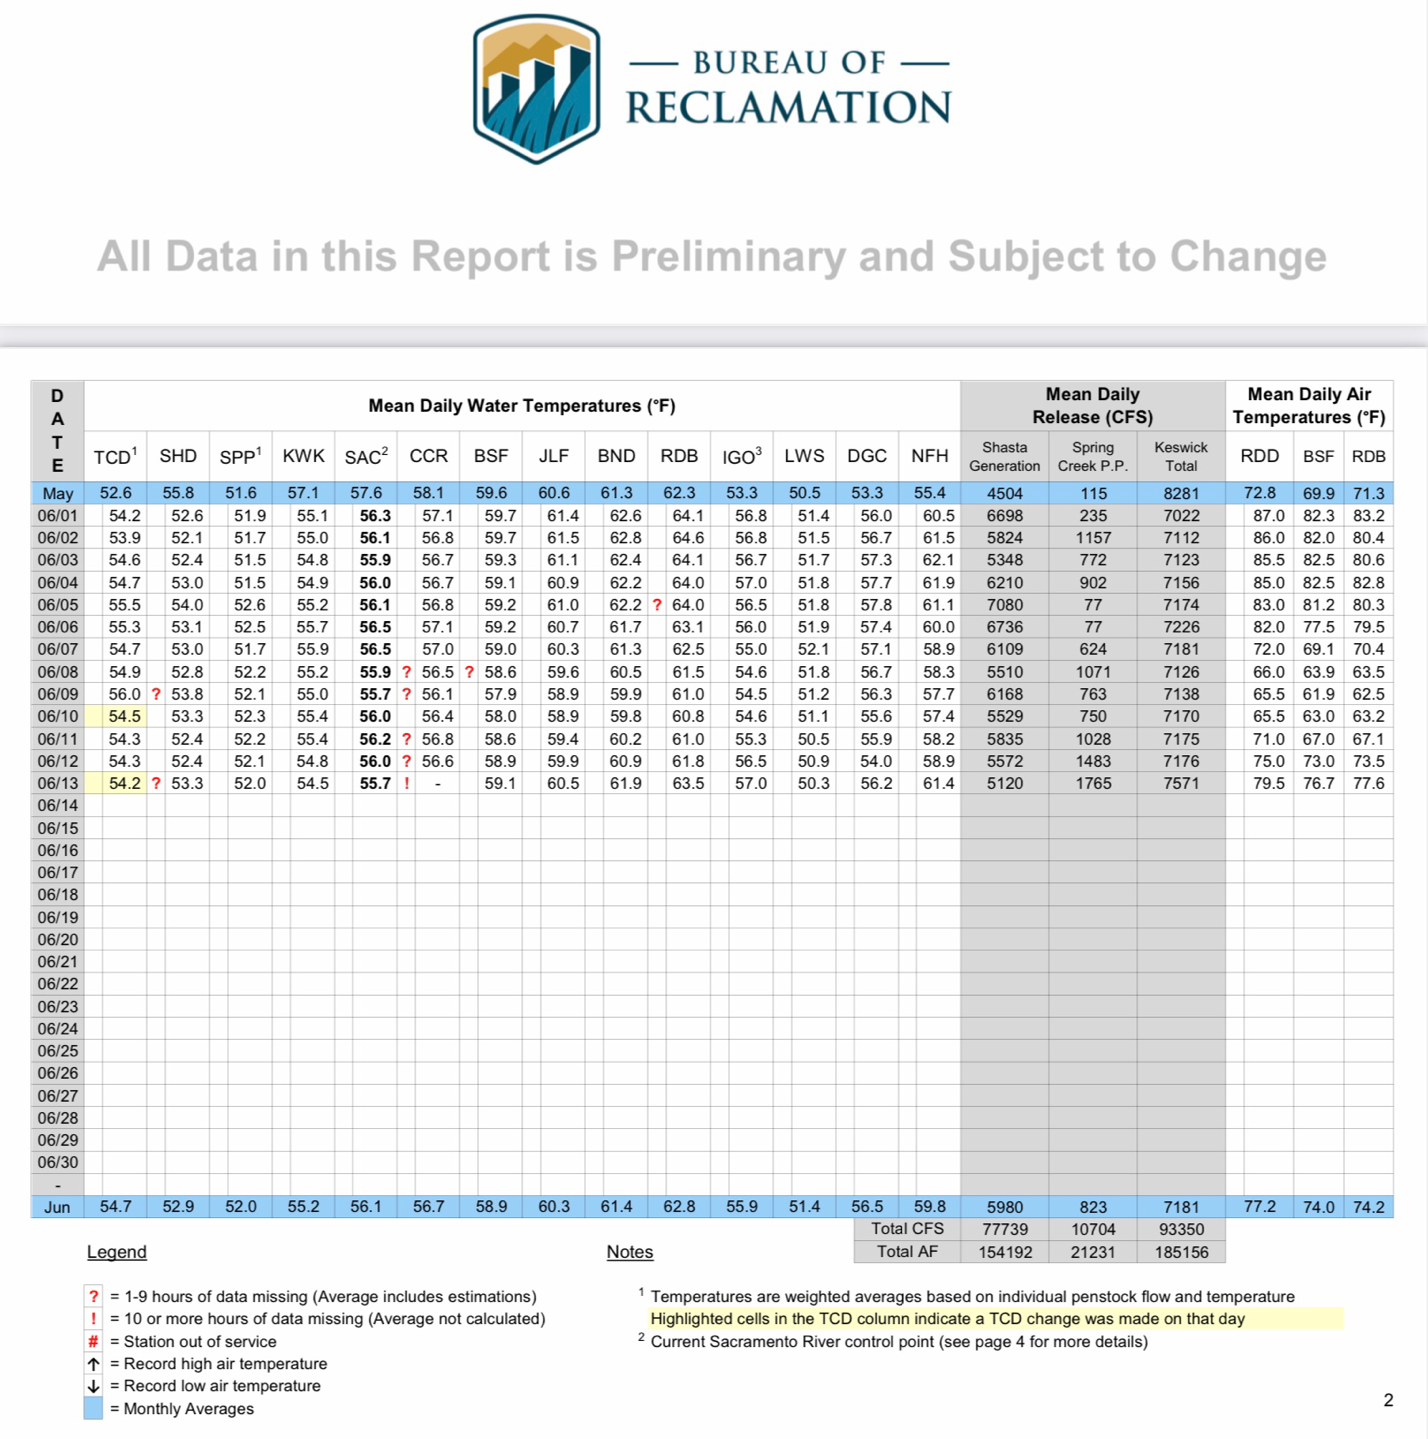
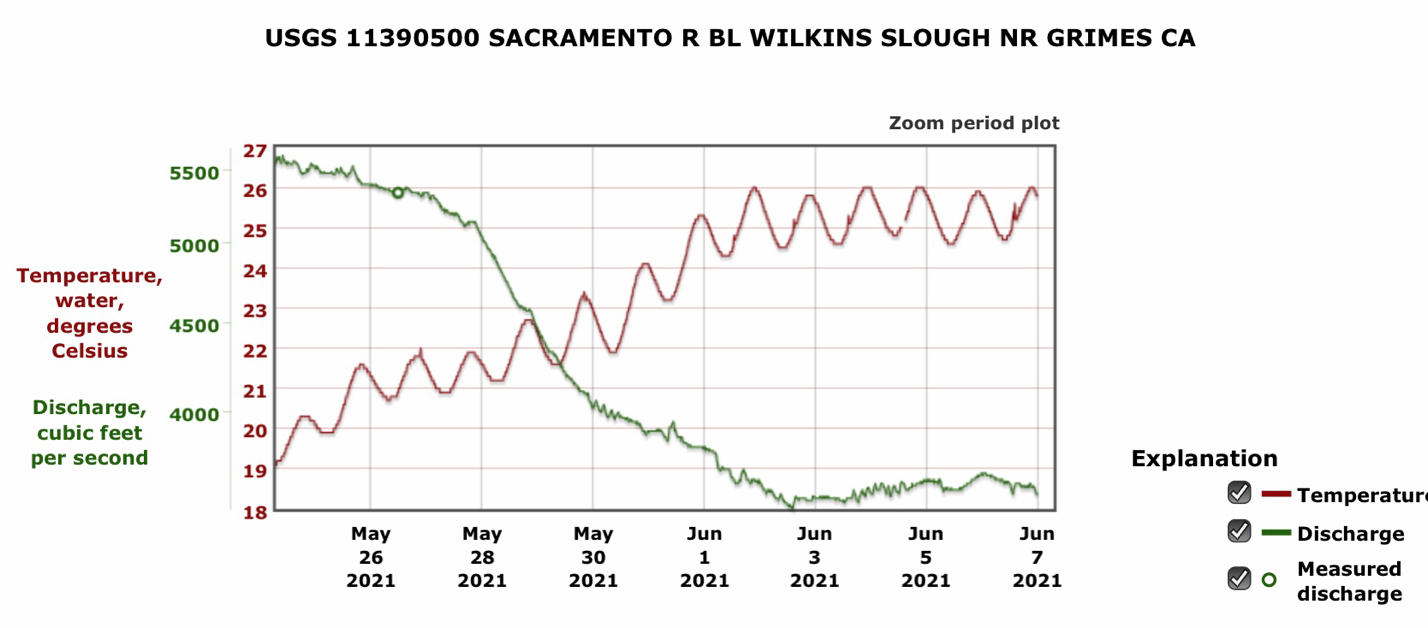
Figure 2. Water temperatures (ºF) recorded at Sacramento River gages from Shasta Dam (SHD, RM 310) downstream to Red Bluff (RDB, RM 240) 5/1-6/16, 2021. Keswick Dam (KWK, RM 300) is the release point from the Shasta Dam complex to the Sacramento River. Spawning area is ten miles downstream of Keswick to mouth of Clear Creek (CCR). Red arrow points out yellow highlight of recently changed operation to benefit salmon spawning.

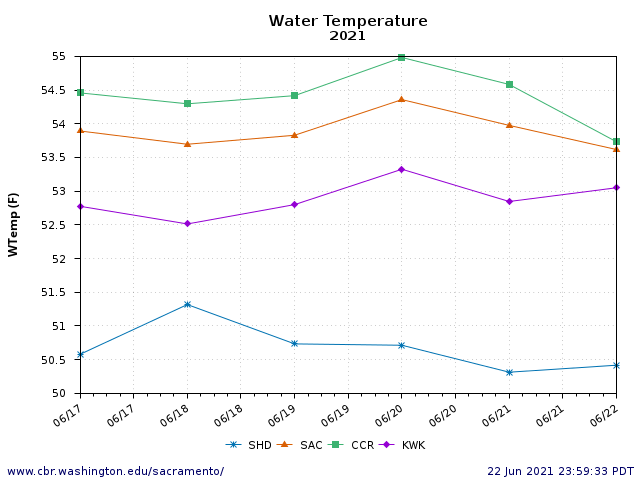
Figure 3. Water temperatures (daily average. ºF) from Shasta Dam release (SHD) and from Keswick Dam (KWK, RM 300) downstream through primary winter-run spawning reach to gage located just upstream from mouth of Clear Clear Creek (CCR, RM 290). Note: the difference between SHD and KWK release temperatures are due to inputs to Keswick Reservoir from Whiskeytown from Whiskeytown Reservoir through the Spring Creek Powerhouse (SPP) and to internal heating and mixing in Keswick Reservoir. The compliance control point gage is SAC, located at the midpoint of the ten-mile spawning reach. The compliance point target was 55ºF during the period.

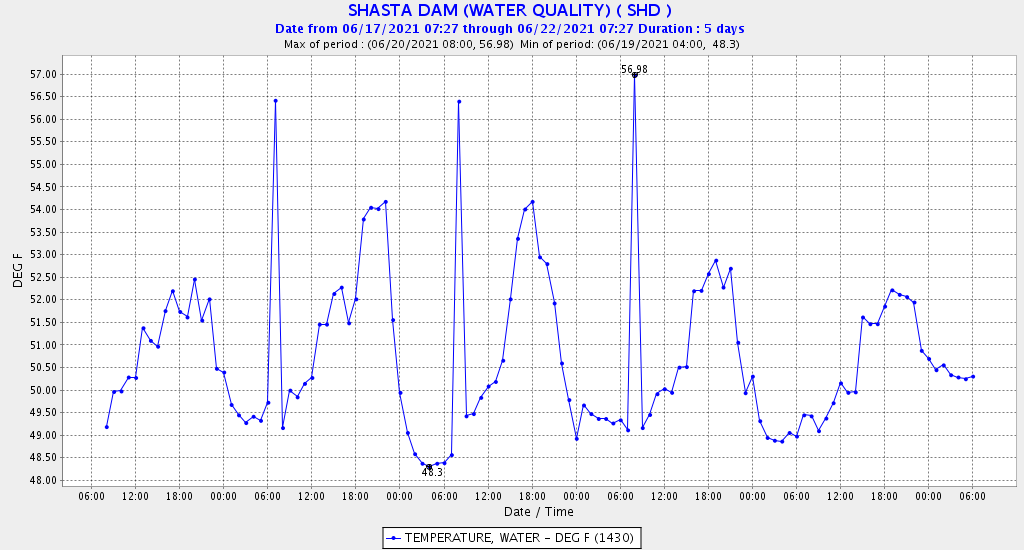
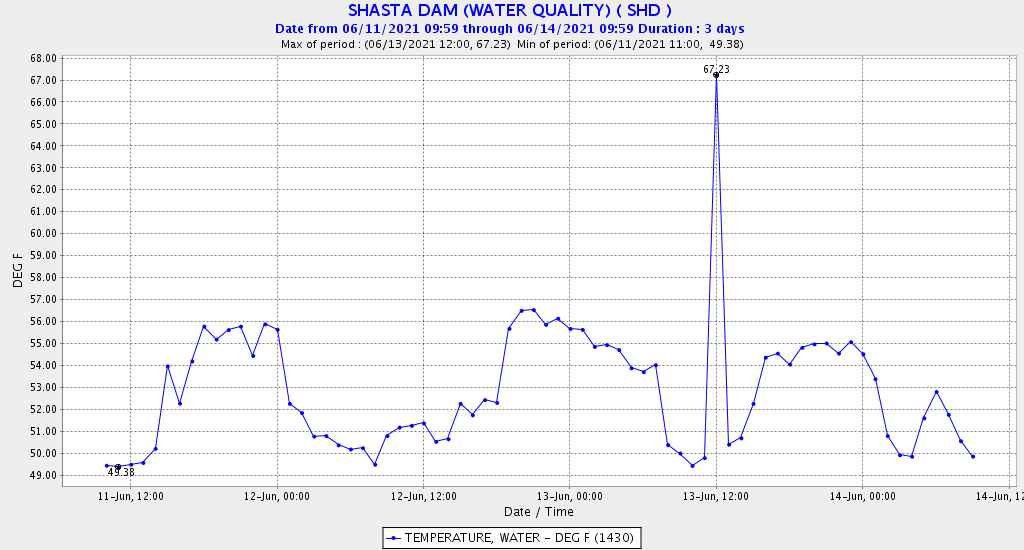
Figure 4. Water temperature (ºF) at gage SHD immediately downstream of Shasta Dam, June 17-22.

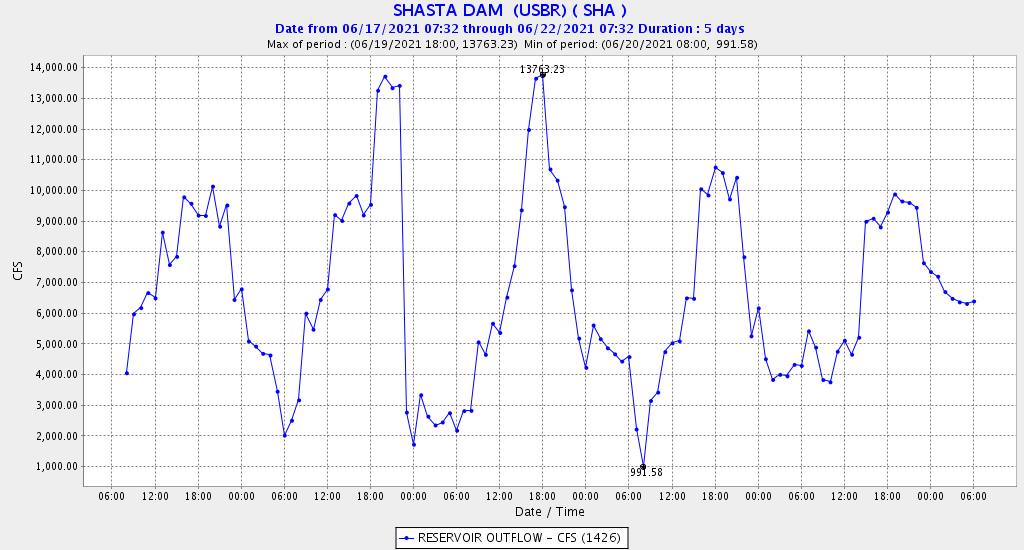
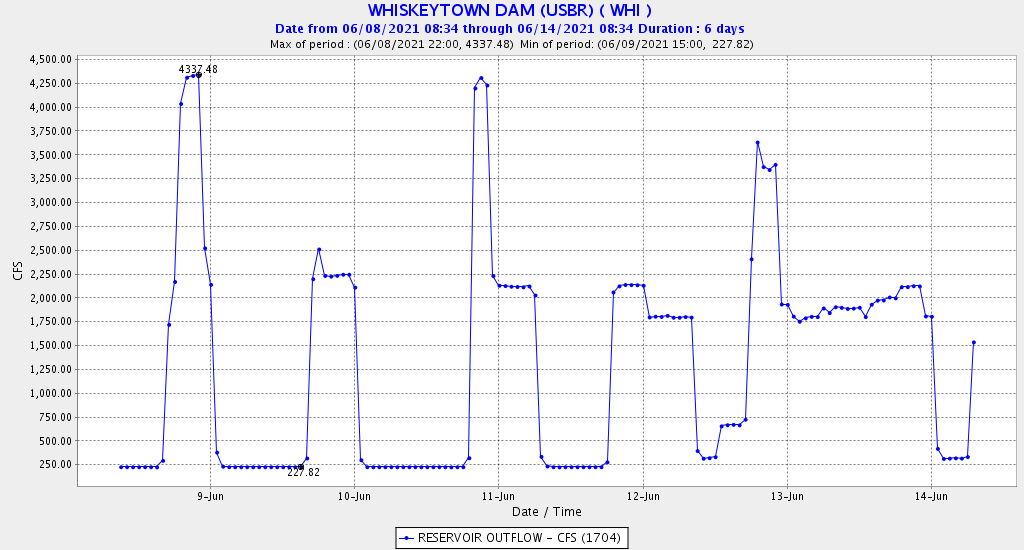
Figure 5. Shasta Reservoir hourly outflow (cfs), June 17-22.

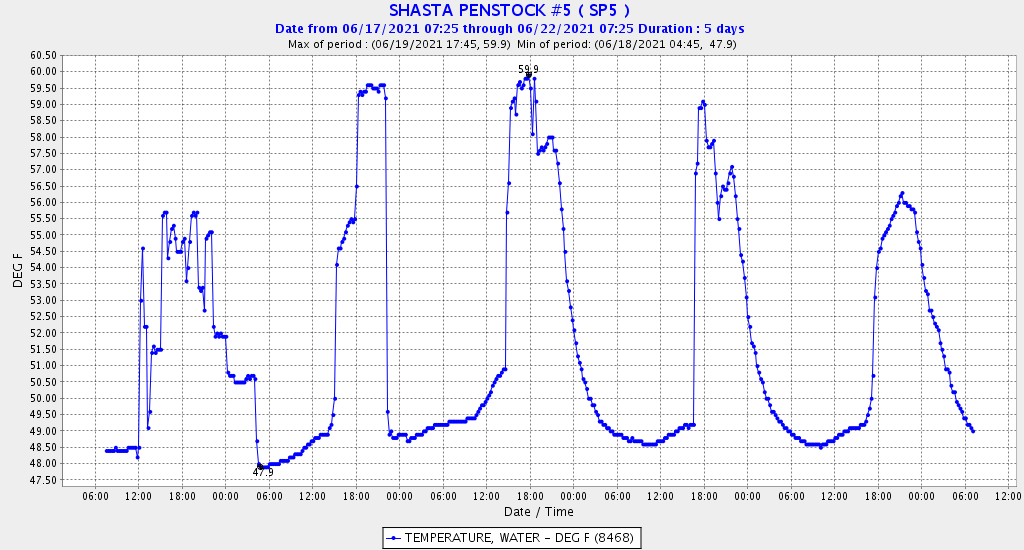
Figure 6. Water temperature (ºF) at gage SHD immediately downstream of Shasta Dam, June 17-22.

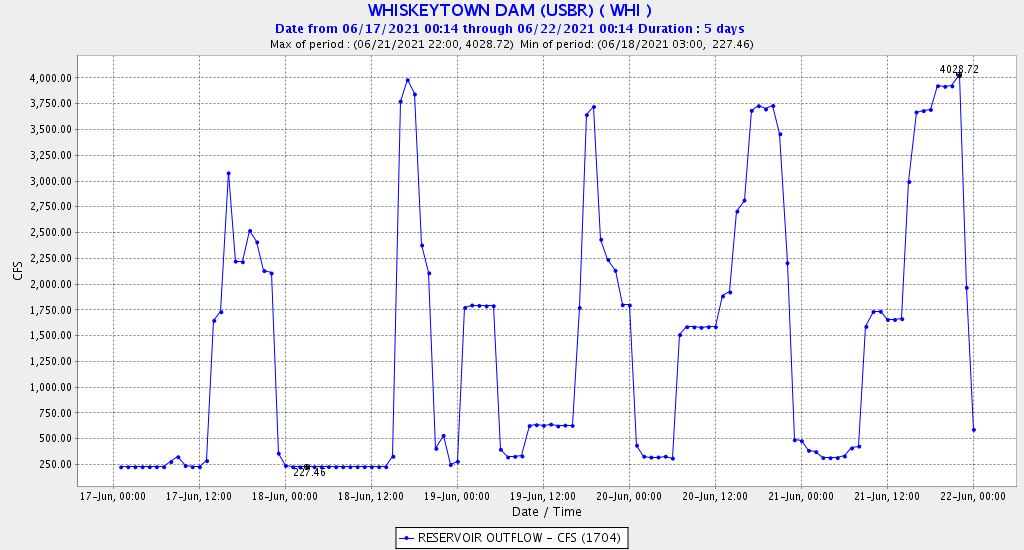
Figure 7. Hourly measued water release (cfs) from Whiskeytown.

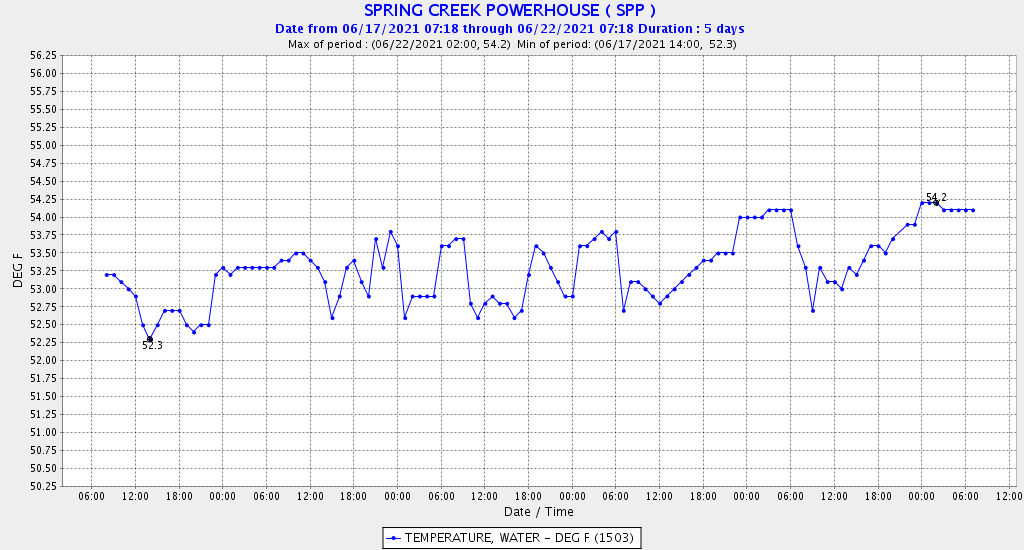
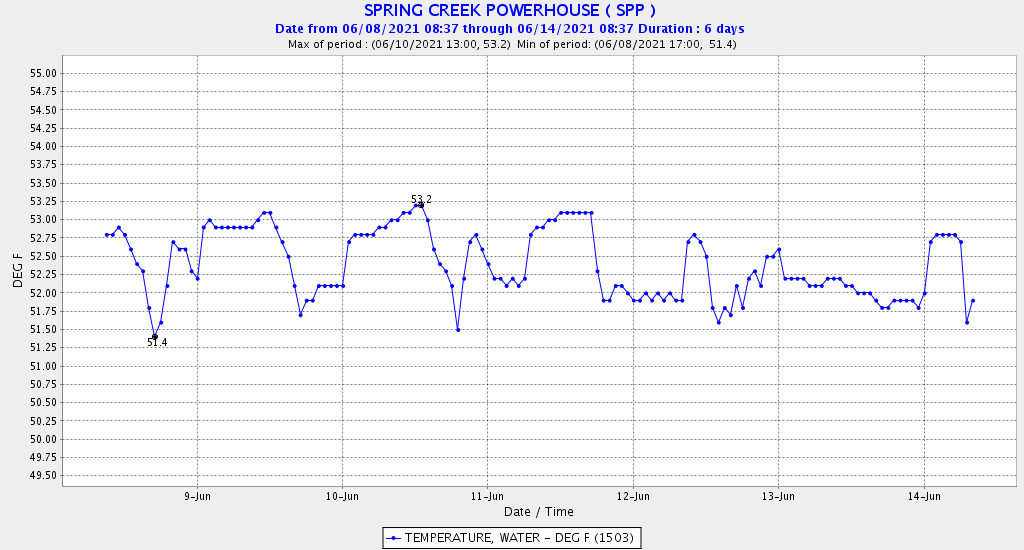
Figure 8. Water temperature (ºF) at gage SPP immediately downstream of Spring Creek Powerhouse June17-22.

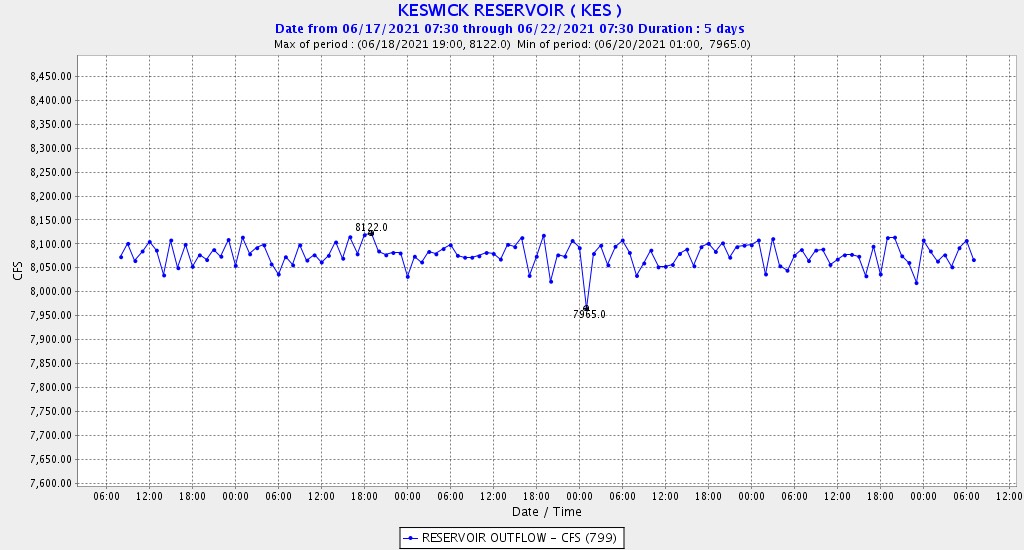
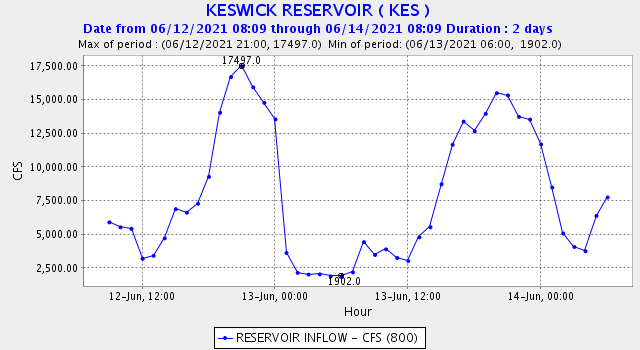
Figure 9. Keswick Reservoir hourly outflow (cfs), June17-22.

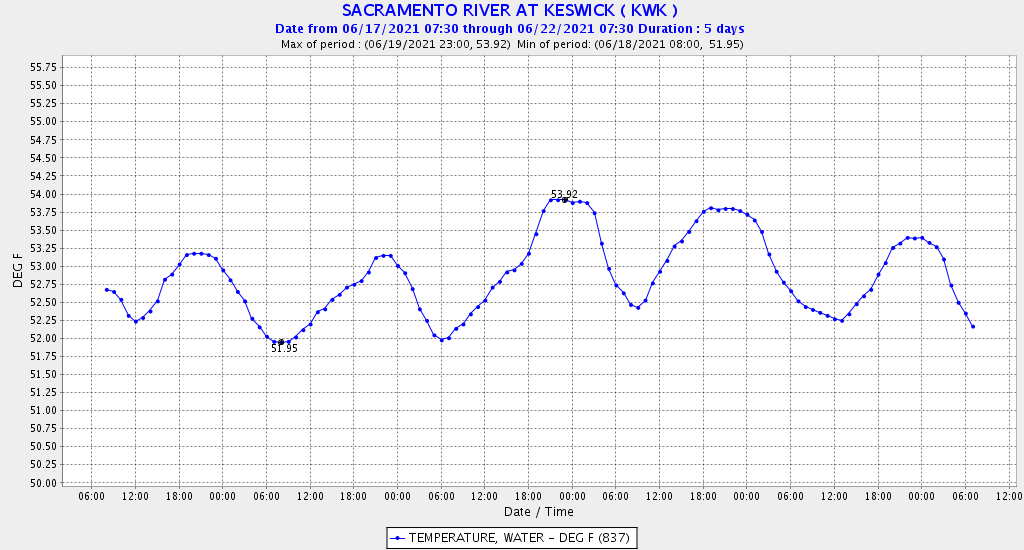
Figure 10. Water temperature (ºF) at gage KWK immediately downstream of Keswick Dam, June17-22.

Hatchery Delta Smelt 2021

Efforts continue to gain approval for releasing hatchery-raised delta smelt in the San Francisco Bay-Delta Estuary. However, given a poor prognosis for a successful introduction, the chances of approval are not good.1  The biggest obstacle is the absence of a location to release the hatchery-raised fish that will allow their survival and thus contribute to the species’ recovery. Another problem is the potential detrimental effect on the remaining wild smelt from genetic compromise.

To me, the answer to the second issue is clear. With few if any “wild” delta smelt left on Earth, it is essential to get as many hatchery smelt out into the wild as soon as possible to save the species. Let the genetics get worked out later by Mother Nature.

Two locations for release of hatchery smelt seem most plausible: the low salinity zone in the west Delta/eastern Suisun Bay and the Deep-Water Shipping Channel in the north Delta. These are primary late spring and early summer nursery areas that are most likely to have the right habitat conditions (water temperature and low salinity) and food supply. These two locations were the last known concentrations of juvenile delta smelt (Figure 1) from the last strong adult spawn in 2012 (Figure 2).

The better of the two sites is the eastern-Bay/west-Delta location, because the ship-channel gets too warm by summer (Figure 3). In contrast, the region between Collinsville in eastern Suisun Bay and Decker Island in the west Delta is cooler and within the low salinity zone (Figures 4 and 5). A nighttime near-bottom release into cooler, deeper channel waters would give the hatchery smelt at least a minimum opportunity to acclimate to the warm Bay-Delta waters.2

Figure 1. Last known prime late spring and early summer nursery area of delta smelt (2012, 20-mm survey). Red lines denote approximate location of X2 (~2000-4000 EC) at the time.

Figure 2. Adult delta smelt catch index from monthly winter trawl surveys 2002-2021.

Figure 3. Water temperature (ºC) and salinity (EC) in spring 2020 in Deep Water Ship Channel.

Figure 4. Water temperature (C) and salinity (EC) in spring 2021 in Sacramento River channel near Collinsville in eastern Suisun Bay.

Figure 5. Water temperature (ºC) and salinity (EC) in spring 2021 in Sacramento River channel near Decker Island in the western Delta.

Peaking Power at Shasta Dam in Summer 2021 – Saving Winter Run Chinook Salmon

In a recent 6/13/21 post, I discussed various tradeoffs of Shasta Reservoir operations on water supply deliveries, power production, and salmon survival for summer 2021. In that post I made reference to tradeoffs with peaking power production at the Shasta hydropower system. This post provides more information on those potential tradeoffs.

Peaking Power Production

Peaking power refers to the release of varying amounts of water through power turbines on a within-day schedule to meet the peak power demands of the regional electric grid. Inflows into Keswick Reservoir near Redding show the peaking power production schedule from Shasta Dam and Whiskeytown Dam into Keswick Reservoir on the Sacramento River (Figure 1). Over a recent two-day period, June 12-14 2021, hourly inflows to Keswick Reservoir ranged from 1900 cubic feet per second (cfs) to 17,500 cfs. Peak inflows were in late afternoon and evening, reflecting peak power demands. Minimum inflows were in the early morning, when power demand is low.

Peaking Power and Water Temperature from Shasta Dam

High releases for peaking power at Shasta Dam can draw warm water from near the surface of Shasta Reservoir (Figure 2). Water temperature below the dam increased from 50ºF to 56ºF in the recent example peaking periods, June 12-14. The positive relationship between dam release flow and water temperature is obvious (Figure 3).1

Peaking Power and Water Temperature from Whiskeytown Dam

In contrast to Shasta Dam, there was minimal influence on water temperatures when there were peaking releases from Whiskeytown Dam from June 12-14. The release water temperatures into Keswick Reservoir through the Spring Creek Powerhouse are minimally influenced by the flow rate (Figures 4 and 5). On June 13, there was no peaking through Spring Creek Powerhouse, but there was little variation in water temperature from peaking days on June 12 and 14.

Summary of Shasta-Keswick Operations

Shasta-Keswick operations is about to enter a new phase of summer operations. Under the Bureau pf Reclamation’s planned operations, there will be larger volumes of exports from the Trinity River system through Whiskeytown Reservoir over the summer. There will also be larger release volumes from Keswick Reservoir to meet increasing downstream contractor demands (Figure 6).

Proposed Operations

The proposed CSPA Temperature Management Plan2 for June-October, 2021 would provide a lower Keswick Dam release. First, Trinity exports would end, except for releases of 300 cfs down Clear Creek, because Trinity water releases through Spring Creek Powerhouse are already pushing the threshold temperature of 53ºF. Second, Shasta release would be limited to releases from coldwater pool at 52ºF to provide 5000 cfs total Keswick release, thereby saving Shasta storage. Third, peaking power at Shasta Dam would be minimized to ensure that warm surface waters are not drawn into the TCD gates (Figure 7) during peaking operations.

Sustaining the cold-water pool in Shasta through the summer is a function of (1) maintaining total storage and cold-water-pool volume in storage: (2) reducing Whiskeytown releases when they become too warm (>53ºF); and (3) minimizing warm water from peak power releases. Such a strategy would help save winter-run salmon eggs in the summer spawning season.

Figure 1. Inflow (cfs) to Keswick Reservoir from Shasta Dam and Spring Creek Powerhouse (cfs), June 12-14, 2021.

Figure 2. Water temperature (ºF) of the water released from Shasta Dam, June 12-14, 2021.

Figure 3. Relationship between water temperature and Shasta Dam release volume, June 12-14, 2021.

Figure 4. Total reservoir release (cfs) from Whiskeytown Dam, June 12-14, 2021. Note that of the minimum 250 cfs release, about 125 cfs were released to Clear Creek to maintain base flows and were not releases through Spring Creek Powerhouse.

Figure 5. Water temperature of water exiting the Spring Creek Powerhouse into Keswick Reservoir, June 9-14, 2021.

Figure 6. Summary of Shasta operations, June 1-13, 2021. Note SAC is gage station 5 miles below Keswick Dam on Sacramento River. Source: https://www.usbr.gov/mp/cvo/vungvari/sactemprpt.pdf

Figure 7. Shasta Dam operations and reservoir storage conditions on June 10, 2021. Source: https://www.usbr.gov/mp/cvo/vungvari/sactemprpt.pdf .

  1. At other times, depending on specific conditions and operations, the opposite relationship is true.  See https://calsport.org/fisheriesblog/?p=3596, Figure 6, for example from 2014 when higher temperatures were associated with lower release volumes.
  2. Referenced in https://calsport.org/fisheriesblog/?p=3714.  The May 23, 2021 CSPA Temperature Management Plan proposed limiting Trinity exports to 300 cfs for the entirety of the June-October period, to be released exclusively down Clear Creek.  In addition to the water temperature benefits in the Sacramento River, such operation would also conserve cold water and overall storage in Trinity Reservoir.

The Week the Salmon Died

It was the first week in June 2021. The salmon were the last of 2021’s endangered winter-run and threatened spring-run Chinook salmon heading up the Sacramento River to spawn below Shasta Dam and in tributary streams. Many were in the middle of their 300-plus-mile journey from the Golden Gate through the Bay, the Delta, the lower Sacramento River. Water temperatures rose to lethal levels through the lower end of the Sacramento River, as flows at Wilkins Slough (River Mile 125) dropped nearly 50% to 3500 cfs and water temperatures reached 25ºC (Figure 1).

Water temperatures above 68ºF (20ºC) are stressful for salmon, and 72ºF (22ºC) is their maximum tolerance limit that forces them to seek cold-water refuge. If salmon cannot find refuge, water temperatures near or above 77ºF (25ºC) are lethal.

On June 1, the State Water Board approved a “temporary urgency change petition” (TUCP) from the Bureau of Reclamation and the Department of Water Resources (DWR) to reduce Delta outflow. By June 2, less than half of the flow released in Redding to the upper reaches of the lower Sacramento River flow (about 8000 cfs, including 7000 cfs from dam releases) was reaching Wilkins Slough, 180 miles downstream. In those 180 miles, more than half the flow was diverted to agriculture. The high early-June water temperatures and low flows are unprecedented for late spring (Figure 2).

Reclamation and DWR’s petition discussed impacts to fish in the Delta. The water temperatures in the Sacramento River at Wilkins Slough in the first week in June show how the Delta and salmon far upstream are connected. The upstream impacts of bad Delta decisions is once again transparent: low requirements for Delta outflow means low flows and lethal water temperatures in the Sacramento River.

An extreme heat period for the Sacramento Valley is expected for the third week of June, and it is still only spring. Winter-run and spring-run adult salmon that made it to the spawning grounds below Shasta and Keswick dams earlier this winter and spring are very likely to experience highly stressful water temperatures (>60ºF) for holding and spawning. Because it is releasing too much agricultural water now, Reclamation is likely to run out of cold water in Shasta by the time that fall-run salmon arrive in Redding in October and November.

The drumbeat of dying salmon will be pounding all summer and into the fall.

Figure 1. Water temperature and Sacramento River flow at Wilkins Slough (RM 125) 5/25-6/7, 2021.

Figure 2. Water temperatures in the Sacramento River at Wilkins Slough (RM 125) in dry years of of the past decade. Values for 2021 are literally over the top. The lethal level for salmon is 77ºF. Stress occurs at >68ºF. Migration ceases at 72ºF.

Longfin Smelt 2021 – Another Poor Year

The Bay-Delta longfin smelt population, listed as threatened under the California Endangered Species Act, is having another poor year because of the Bay-Delta habitat conditions in critically dry year 2021. Winter spawning and early rearing habitat conditions were poor due to low Delta outflow. Spring conditions have been similarly poor, with low Delta outflows and high water temperatures. Summer conditions will be even worse.

Winter

As in prior dry years, longfin spawned in the Delta in winter 2021. Their newly hatched pelagic larvae accumulated in the low salinity zone in eastern Suisun Bay close to Chipps Island near the city of Pittsburg (Figures 1 and 2). In wetter years, longfin larvae accumulate further west in western Suisun Bay and San Pablo Bay, and are also more likely to spawn in Bay tributaries, especially the Napa River. With Delta export pumps diverting about one-third of winter freshwater inflow to the Delta and Bay, significant numbers of larval longfin smelt were susceptible to being drawn into the central and south Delta, away from their low salinity zone nursery area in eastern Suisun Bay.

Spring

With low spring Delta outflows of 3000-6000 cfs, similar to critical drought years 2014 and 2015 (Figure 3), longfin juveniles were concentrated in the low salinity zone in the western Delta (Figure 4). In that location, they are more vulnerable to Delta exports than in the prior winter, and are also subjected to warmer water temperatures (Figure 5) detrimental to their survival (Jeffries et al. 2016).1

Summer

The prognosis for the summer is grim, given expected water temperatures over 68ºF under low flows allowed under the Temporary Urgency Change Petition (Figure 5).

Population Response

The combination of low outflow (poor habitat), vulnerability of larval and juvenile longfin smelt to export, and reduced numbers of adult spawners that have survived in recent years leads to low population recruitment (Figure 3).2

Summary and Conclusions

In a critically dry year like 2014, 2015, or 2021, Delta outflows should not fall below 6,000-8,000 cfs on a daily or tidally filtered basis (Figure 3). Such outflows keep the low salinity zone west of the Delta in Suisun Bay, where water would be cooler and longfin would be less likely to be drawn into the central and south Delta. State recovery planning for longfin smelt should also proceed as has been recommended.3

Figure 1. Catch distribution of larval longfin smelt in the mid-January 2021 larval fish survey. Red area is approximate location of low salinity zone. Red arrow is net direction of west Delta flow toward south Delta export pumps. Data Source: CDFW survey online report.

Figure 2. Catch distribution of larval longfin smelt in the February 2021 larval fish survey. Red area is approximate location of low salinity zone. Red arrow is net direction of west Delta flow toward south Delta export pumps. Data Source: CDFW survey online report.

Figure 3. Delta outflow in spring and early summer 2014, 2015, and 2021. Note the sharp decline in late May 2021 (blue line) following approval of Temporary Urgency Change Petition (TUCP).

Figure 4. Catch distribution of larval longfin smelt in the May 2021 20-mm fish survey #5. Red area is approximate location of low salinity zone (2-4 EC). Blue areas are higher salinity zones in Bay. Red line is approximate location of X2. Data Source: CDFW survey online report.

Figure 5. Longfin Recruits (Fall Midwater Trawl Index) vs Spawners (Index from two years prior) in Log10 scale by water year. The relationship is very strong and highly statistically significant. Adding Delta outflow in winter-spring as a factor makes the relationship even stronger. The 2019 brood year index was lower than expected, given the potential number of spawners (from the relatively high 2017 index) and 2019 having been a wet year. The 2020 index is as expected for a dry year, with low spawner numbers.