I recommended a new June Delta outflow standard of 10,000 cfs in a post on June 23 2020. This increase from the current standard of 7000 cfs would keep salt and Delta smelt out of the Central Delta and better maintain adequate water temperatures for emigrating Central Valley salmon smolts.
In this post, I consider the recommended 10,000 cfs value in the context of how the California Department of Water Resources (DWR) and the Bureau of Reclamation (Reclamation) estimate Delta outflow as they manage Delta hydrology and federal and state exports from the south Delta. This should further explain why an increase in the June Delta outflow standard is necessary.
It helps to recall my description in a September 2019 post how DWR and Reclamation estimate Delta outflow: “Delta Total Outflow is a daily-average algorithm calculated in cubic feet per second (cfs) for Station DTO, a hypothetical location near Chipps Island in Suisun Bay.“ This is different from the US Geological Service’s (USGS) method of calculating real-time outflow. As an example, I overlaid the DWR and USGS for the summer of 2018 (Figure 1).
The State’s D-1641 June water quality standard is: the monthly average of the average outflow for each day must meet or exceed 7000 cfs (monthly average of daily averages). DWR and Reclamation comply with this standard using their own estimation method, not real-time outflow. Figures 2 and 3 below show the differences in the DWR and USGS methods in May-June 2020.
In May-June 2020, DWR and Reclamation maintained Delta outflow (using their own estimation method) near 7000 cfs, except during a mid-May storm when estimated outflow reached a peak of 15,300 cfs (Figure 2). But viewed from a different perspective, there were significant dips in the USGS estimation of outflow during spring tides around June 5 and June 19. The DWR method of estimating didn’t pick up these dips at all. These periods where USGS showed negative net outflow showed up in the monitoring of salinity as well (Figures 4-6). Periods of low or negative outflow were also periods of high salinity at key Delta monitoring stations.
Although net daily Delta flows are relatively small compared to real-time tidal flows (Figures 7 and 8), net flows affect water quality and fish habitat conditions on a daily basis. The salinity data for May-June 2020 at False River (Figure 5) is particularly significant. (Note the spikes in salinity during spring tides around June 5 and June 19). False River is the gateway to Franks Tract. As salinity increases in False River, smelt will move upstream (towards lower salinity conditions) in Franks Tract. As I described in an April 28, 2020 post, Franks Tract is a “smelt trap” where smelt that enter almost invariably perish.
Increasing the standard for June Delta outflow so that the required monthly average of the average outflow for each day is 10,000 cfs, not 7,000 cfs, would not fully offset the effects of spring tides and the use of averaging in DWR’s method of calculating compliance. But it would help protect Delta habitat from salt intrusions during spring tides and keep the low salinity zone and young Delta smelt out of the Delta. Although DWR and Reclamation did a good job in May-June 2020 of staying above 7000 cfs each day using their calculated outflow method, adding an explicit minimum daily flow standard to the monthly flow standard could also help. This would likely have the result of reducing exports during periods of the spring tides in the monthly lunar tidal cycle.
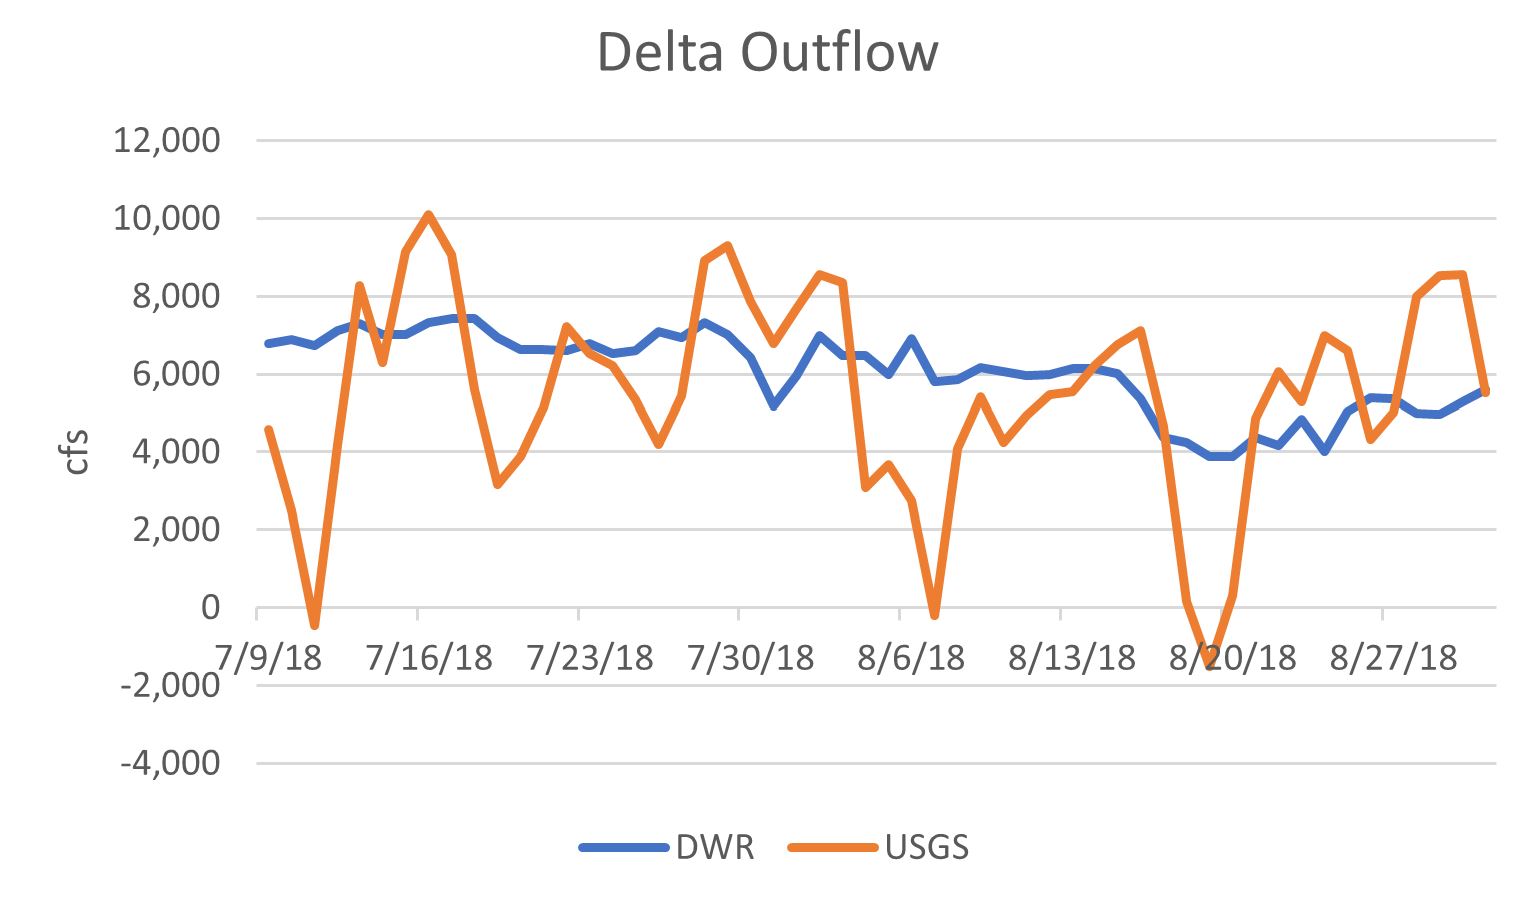
Figure 1: Daily outflow estimated by DWR and USGS in summer 2018.
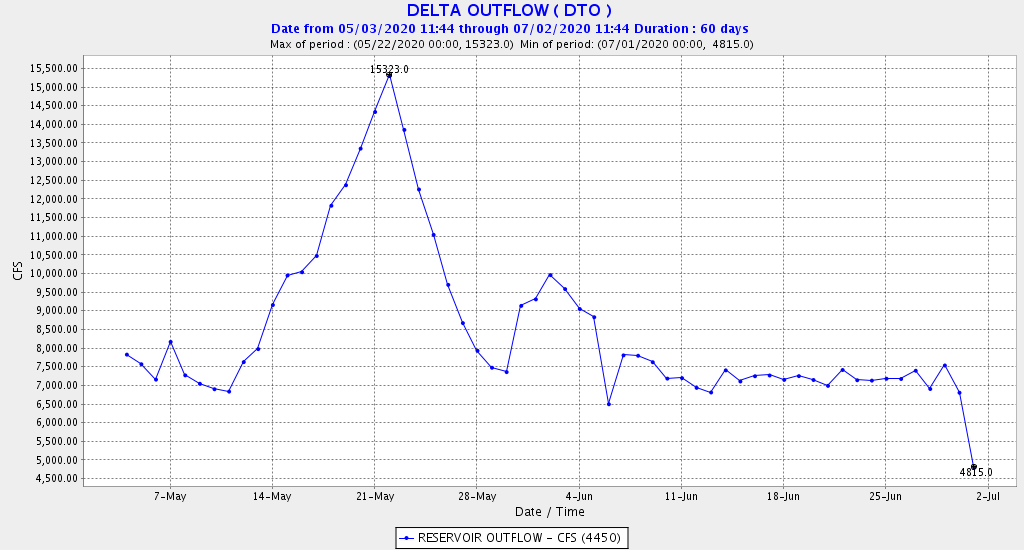
Figure 2. DWR’s calculated Delta outflow in May-June 2020. Note switch to July standard of 5000 cfs outflow on July 1. Source: CDEC.
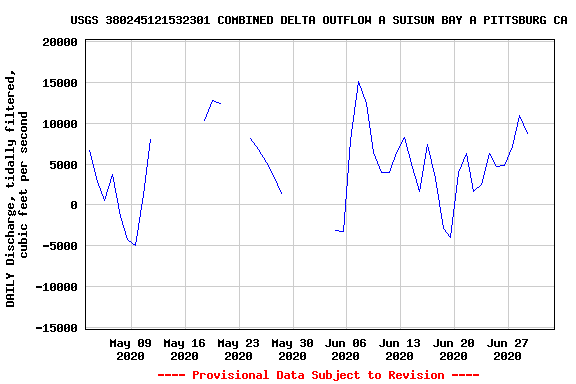
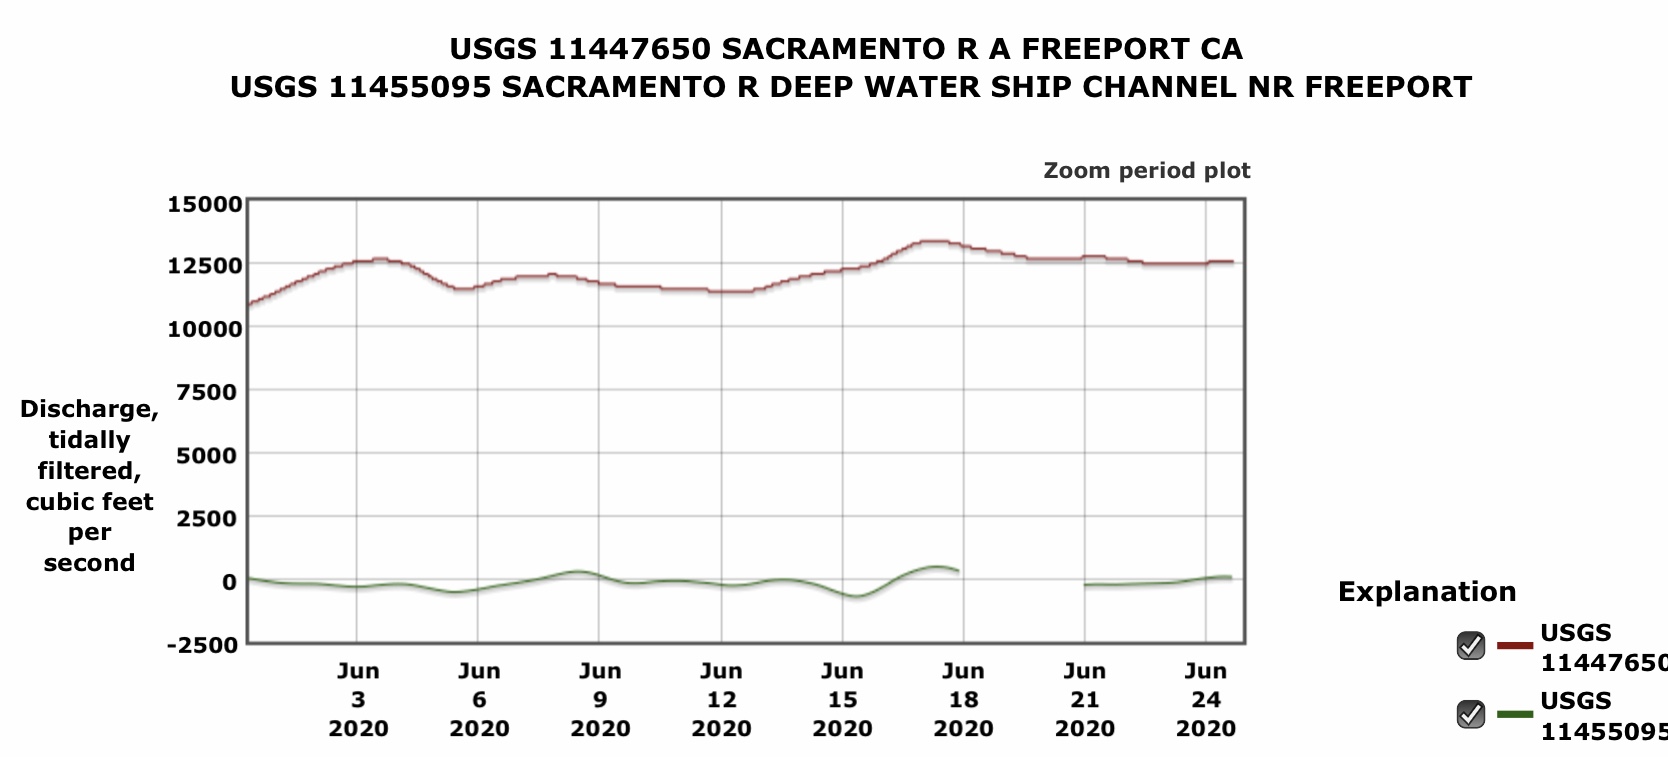
Figure 3. USGS’s estimate of tidally filtered Delta outflow as estimated in May-June 2020. Spring-tides occurred May 9, May 23 (not measured because of storm inflows), and also on June 5 and June 19. Note dips in outflow on June 5 and 19; these dips do not appear in DWR’s estimate in Figure 2.
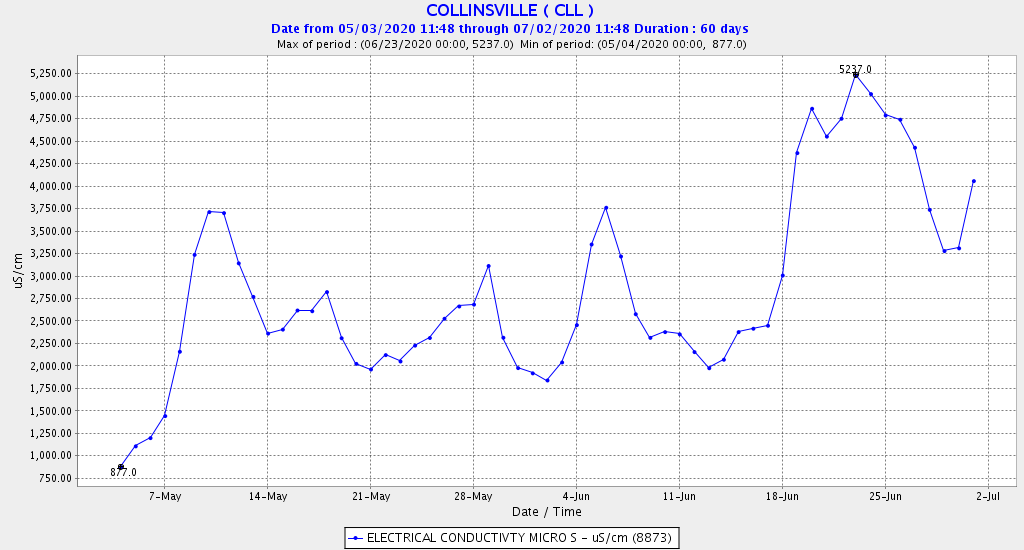
Figure 4. Salinity (conductivity) in eastern Suisun Bay at Collinsville in May-June 2020. Note peaks in salinity during net negative outflow with spring tides on June 5 and 19 (see Figure 3).
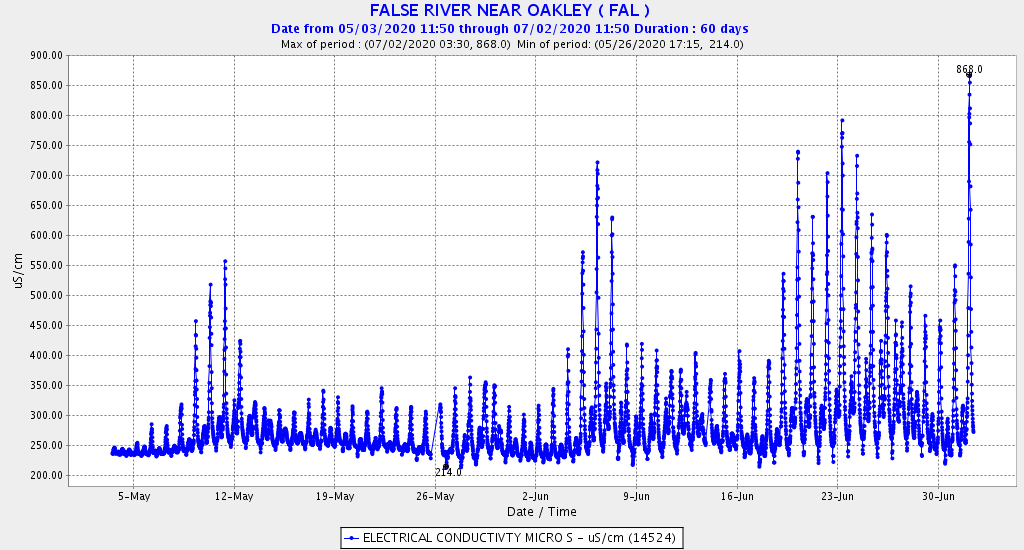
Figure 5. Salinity (conductivity) in False River in west Delta in May-June 2020. Note peaks in salinity during net negative outflow with spring tides on June 5 and 19 (see Figure 3).
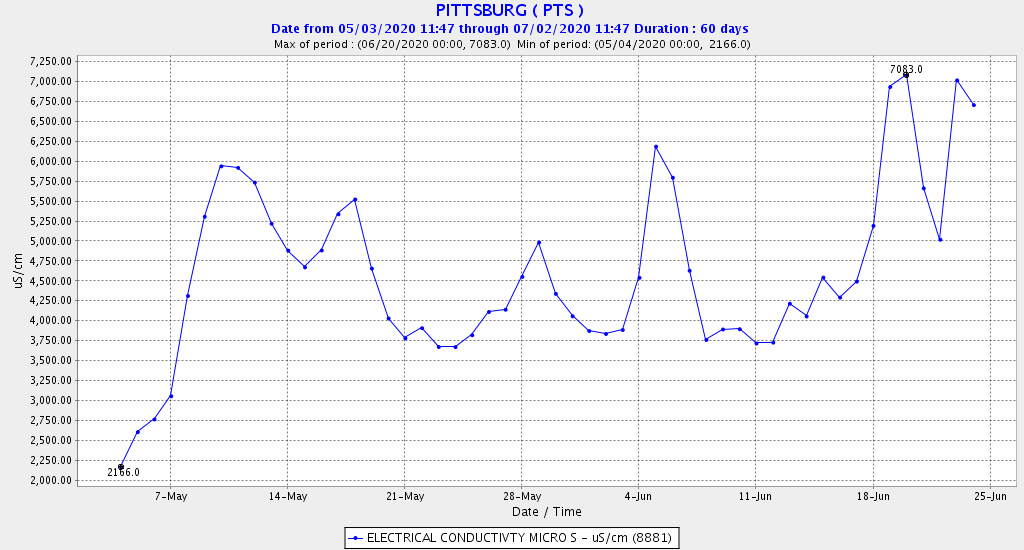
Figure 6. Salinity (conductivity) in eastern Suisun Bay at Pittsburg in May-June 2020. Note peaks in salinity during net negative outflow with spring tides on June 5 and 19 (see Figure 3).
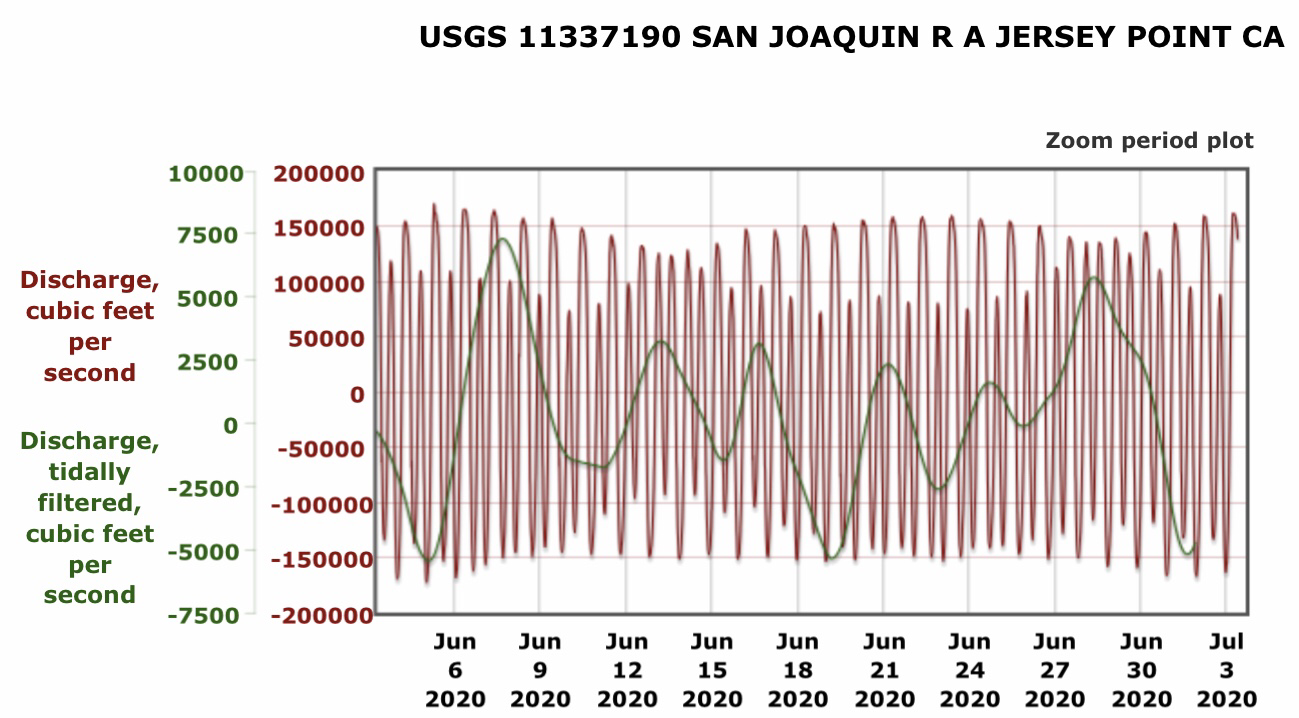
Figure 7. Hourly river flow and tidally filtered flow in lower San Joaquin River channel in western Delta at Jersey Point in June 2020. Note highly negative peak flows with spring tides on June 5 and June 19.
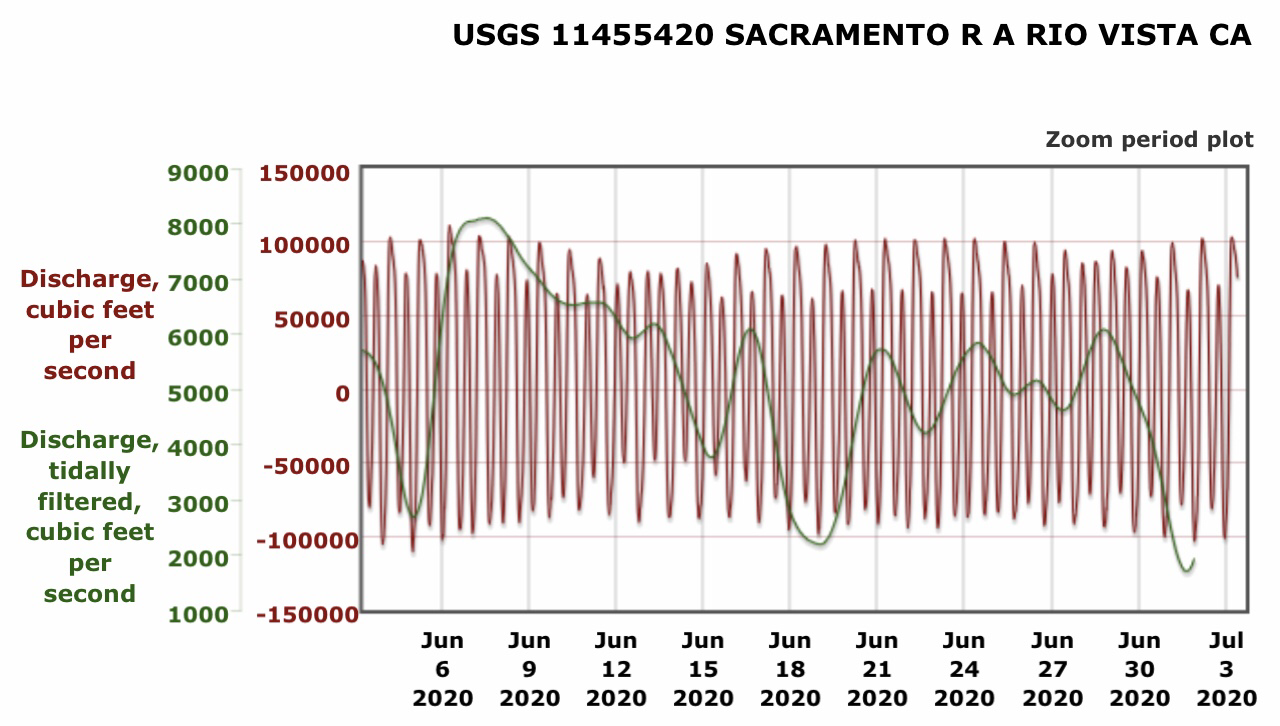
Figure 8. Hourly river flow and tidally filtered flow in lower Sacramento River channel in western Delta at Rio Vista in June 2020. Note spring tides on June 5 and June 19.