
In a recent post (May 6, 2020), I discussed the need to increase flows in the lower Sacramento River to reduce water temperatures for emigrating juvenile spring-run and fall-run hatchery and wild Chinook salmon. I recommended maintaining water temperatures below 65°F/18°C per the scientific literature. Water managers increased flows (or reduced diversions) on about May 11 (Figure 1), and with the help of cooler weather (Figure 2), water temperatures came down significantly through the lower Sacramento River (Figures 1, 3, and 4).
The National Marine Fisheries Service (NMFS), California Department of Fish and Wildlife (CDFW), and US Bureau of Reclamation (BOR) have begun a multi-year study to evaluate the potential survival benefits for juvenile spring-run and fall-run Chinook salmon of managed spring flow pulses in the Sacramento River.1 Such action is prescribed in the NMFS 2019 biological opinion for the federal Central Valley Project. The problem with the prescription is that it applies only in wetter years when there is high Shasta Reservoir storage (4 million acre-ft end-of-April), while the need is greatest in drier years when reservoirs capture most if not all the water from limited precipitation events.
But why study the concept with 50 years or more of data available? Just looking at this spring’s data shows the role flow can play in keeping temperature below levels that are known to increase salmon mortality. In this blog I have shown over and over the order-of-magnitude benefits to population recruitment that comes from maintaining flows and water temperature. The scientific literature is replete with analyses of the effects of water temperature on salmon. We know that temperatures in the lower Sacramento River on May 9-10 were bad for immigrating adult salmon and emigrating juvenile salmon, so why not acknowledge the problem and correct it?
And why just study the benefit of a single flow pulse? Results would depend on so many factors. In Figure 1, weather forecasts indicated the May 7-9 heat wave days ahead, so why wasn’t the flow pulse applied earlier? Or were water managers simply responding to water demands or violations in water quality standards that occurred May 8-10 at Verona?
In any case, the May 2020 example shows that flows and water temperatures in the lower Sacramento River need to be actively managed to protect salmon.
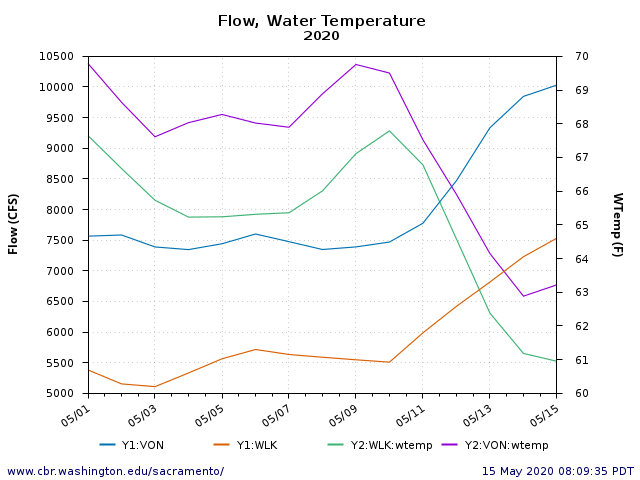
Figure 1. Water temperature and streamflow in the Sacramento River at Wilkins Slough and Verona May 1-15, 2020. See Figure 4 for gage location.
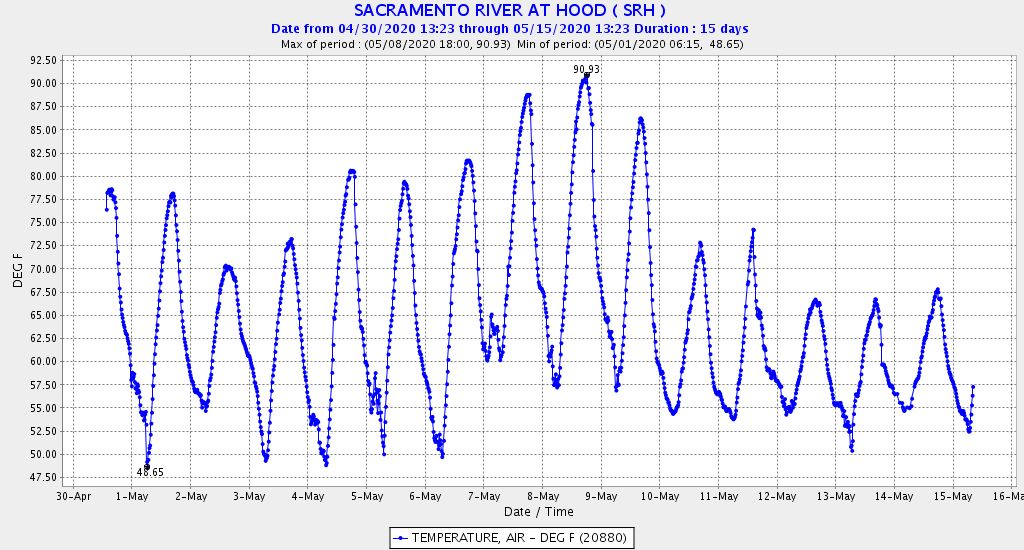
Figure 2. Air temperature at Hood near Freeport May 1-15, 2020.
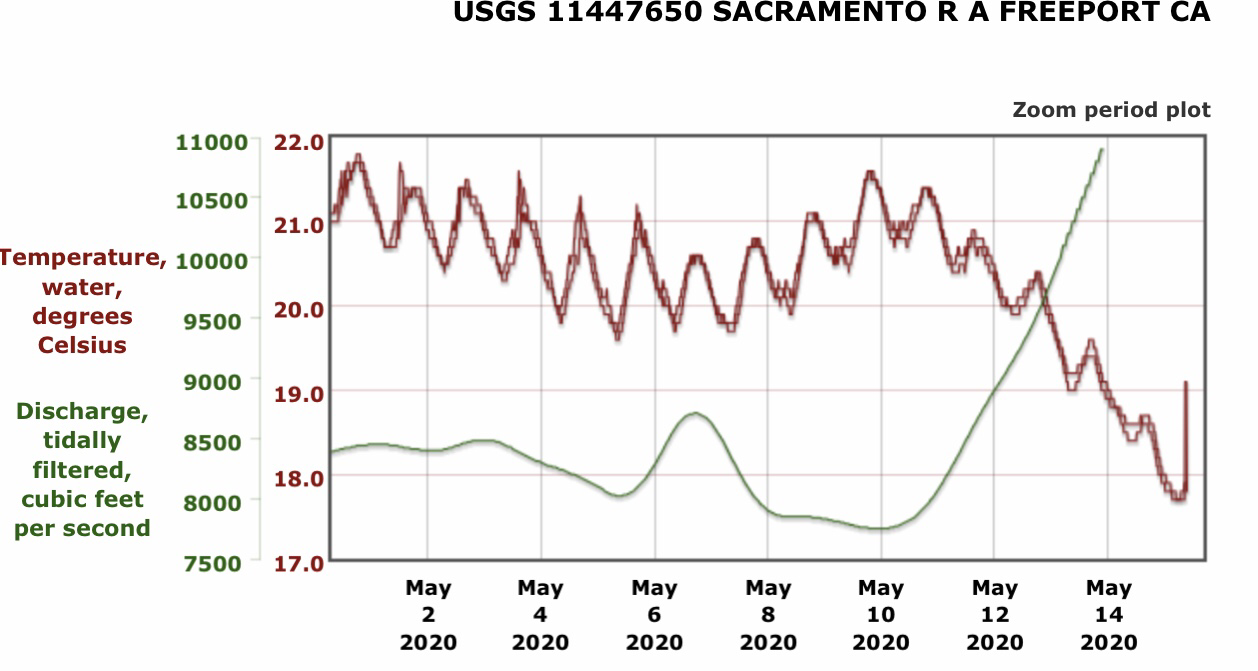
Figure 3. Freeport gage water temperature and daily average flow (tidally filtered) May 1-15, 2020. Figure 4 for gage location.
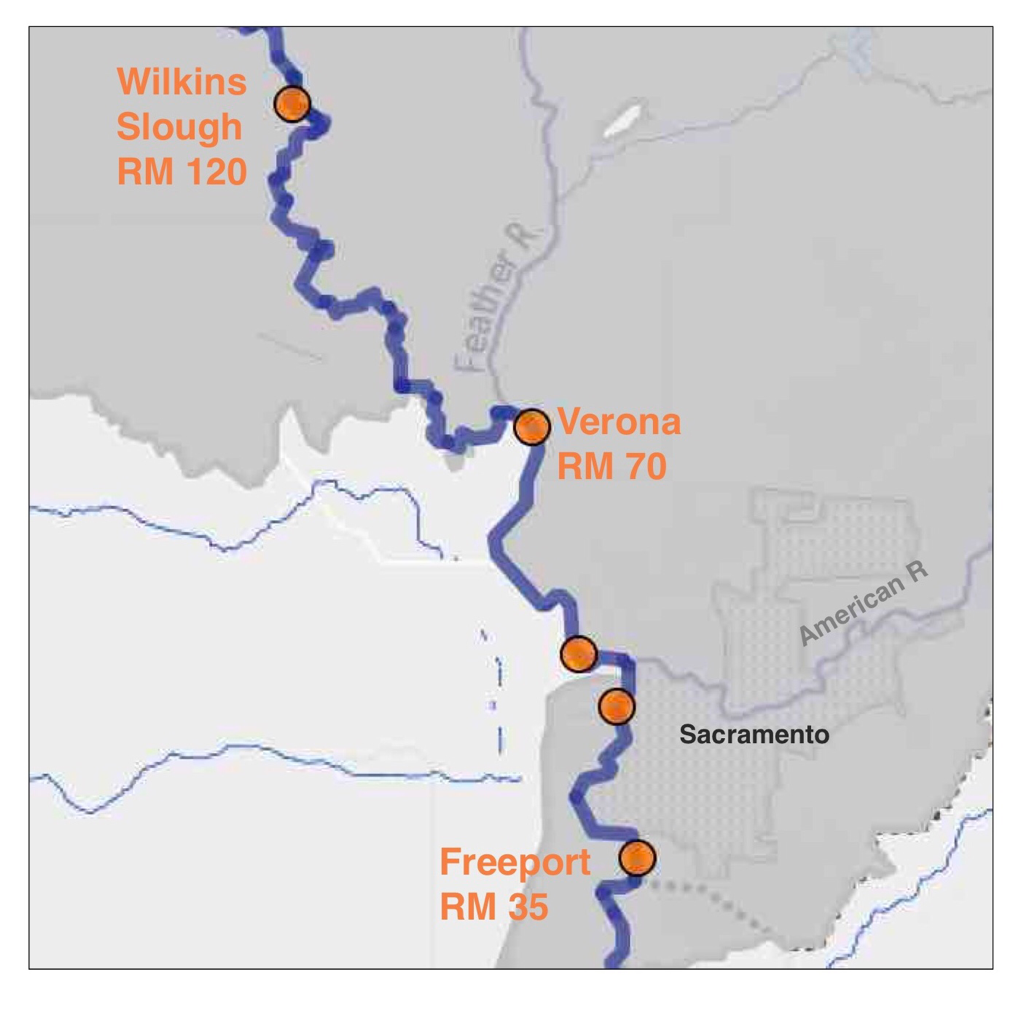
Figure 4. Gage stations in lower Sacramento River
- A link to the draft study plan: https://1drv.ms/b/s!ArkjAKW4WdKRwCWsW3cnyJdS5Zac ↩