
A mid-May storm in the northern Central Valley brought approximately 250,000 acre-ft of new water to the Sacramento River watershed. A rough conservative estimate indicates approximately 150,000 acre-ft of the storm’s water was put into storage in northern Valley reservoirs, while roughly 100,000 acre-ft of the storm’s water reached the Delta and Bay. No noticeable effect from the storm was observable in the southern Valley or San Joaquin River.
Shasta Reservoir storage at the northern end of the Valley increased 80,000-100,000 acre-ft from the storm (Figure 1). About 50,000 acre-ft of runoff was stored directly in Shasta Reservoir. Another 50,000 acre-ft was added to Shasta storage by reducing downstream releases because downstream irrigation demands were being met by tributary inputs from the storm (Figure 2).
Local runoff and tributary inputs from the storm in the Redding and Red Bluff area increased streamflow in the lower Sacramento River. Sacramento River flow in the area as measured at the Bend Bridge Gage (BND) increased 3000-4000 cfs (about 30%) on May 18-19 (Figure 3). The lower river flow pulse passed downstream by Colusa (RM 144) and Wilkins Slough (RM 120) on May 20-22, and Verona (RM 70) and Freeport (RM 35) on May 21-23 (Figure 3). Most of the storm’s runoff that did enter the lower Sacramento River, other than the 3000-5000 cfs diverted for irrigation, eventually reached the Bay, doubling Delta outflow to the Bay (Figure 4). This significant flow pulse helped young salmon and steelhead passing through the Delta to reach the Bay (Figure 5) and reduced the loss of the young salmon and steelhead at the Delta export pumps (Figure 6). The flow pulse helped keep water temperature down to safe limits (<68°F) (Figure 7). However, after the pulse passed and flows dropped, water temperatures reached 74-77°F, near or at the lethal level for salmon, prompting what appears to be an “emergency” increase in reservoir releases in late May to alleviate water quality and permit violations of water temperature standards.
Most of the lower river flow pulse reached the Bay because Delta exports were not increased as would have been allowed by the latest National Marine Fisheries Service’s (NMFS) 2019 Biological Opinion (BO) for the long-term operations of the Central Valley Project (CVP) and State Water Project (SWP). On May 11, 2020, Judge Dale A. Drozd of the U.S. District Court for Eastern California issued a preliminary injunction sought by the state of California and several environmental and fishing groups. The injunction prevented the Bureau of Reclamation from implementing the new BO until at least June 1, 2020. One immediate result of the injunction was that NMFS’s 2009 BO was put back into effect, with restrictions on May exports.
If there had been no 2009 BO restrictions on Delta exports (the 2009 BO limited exports to 100% of San Joaquin River inflow to the Delta), south Delta exports could have been 6000 cfs (under a State Water Board limit of 35% of total Delta inflow) instead of 1000-2000 cfs (Figure 8). Such higher exports would have greatly reduced the added beneficial Delta outflow from the storm and would have had a greater impact to emigrating salmon and steelhead smolts from the Sacramento River and the San Joaquin River. Less Delta outflow would also have limited benefits to endangered longfin and Delta smelt in the Bay.
In conclusion, the total amount of water from the northern California storm was near 75,000 acre-ft in the Redding-Shasta watershed, with about a third captured in Shasta Reservoir, a third going to irrigation deliveries instead in lieu of deliveries from Shasta storage, and a third passing downstream to the Delta and Bay. The judge’s decision to allow approximately 40% of the stormwater to reach the Bay, at least temporarily, has helped sustain salmon and smelt in this otherwise dry year. After the flow pulse, slow-to-react water managers allowed water temperatures to spike, threatening the listed salmon and smelt that remained in the rivers and the Delta.
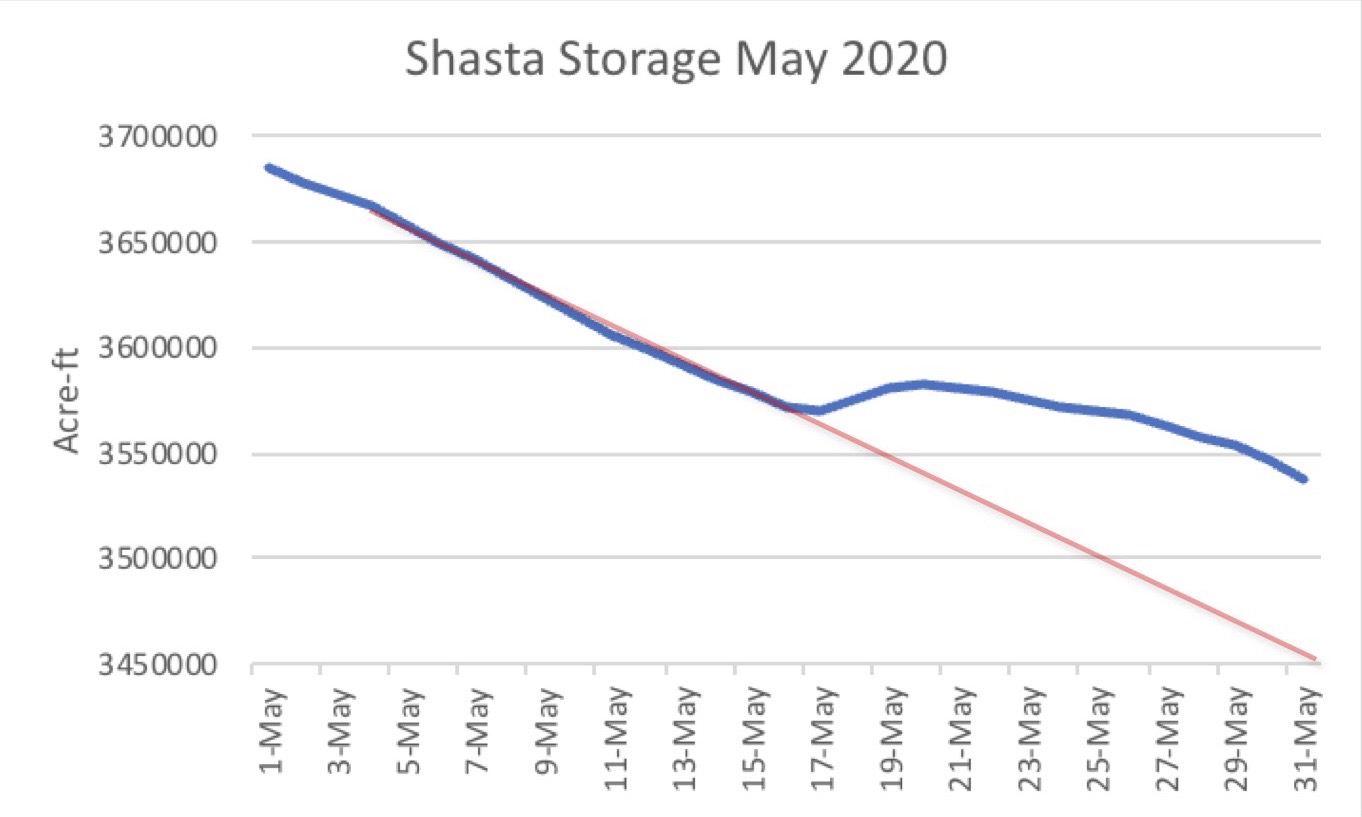
Figure 1. Shasta Reservoir storage May 2020. Red line indicates projected storage before the mid-May storm. The difference between the two lines is a rough estimate of added new storage.
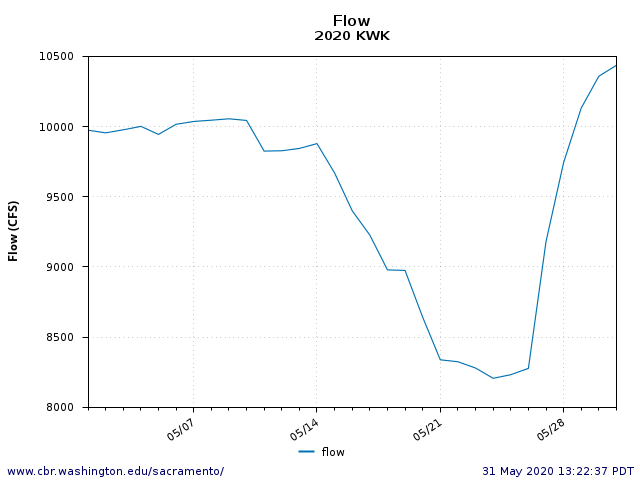
Figure 2. Shasta/Keswick dam releases in May 2020. The cuts in Shasta/Keswick releases in mid-May correspond to increase in downstream stormwater inputs that reduced demands on Shasta storage.
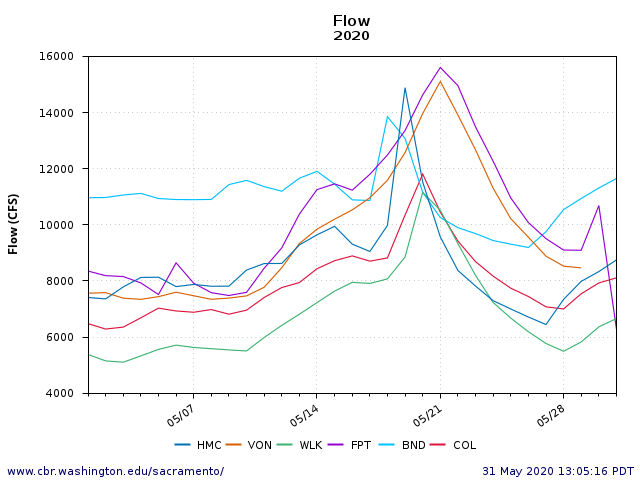
Figure 3. Sacramento River streamflow in May 2020 as measured at Bend (RM 259), Hamilton City (RM 200), Colusa (RM 144), Wilkins Slough (RM 120), Verona (RM 70), and Freeport (RM 35). The difference in flows at Bend and flows at Hamilton City, Colusa, and Wilkins Slough in early May is due to irrigation diversions downstream of Bend. Increased flows at Freeport and Verona compared to flows at Wilkins Slough are due to Feather River and American River inputs. Source: http://www.cbr.washington.edu/sacramento/data/ .
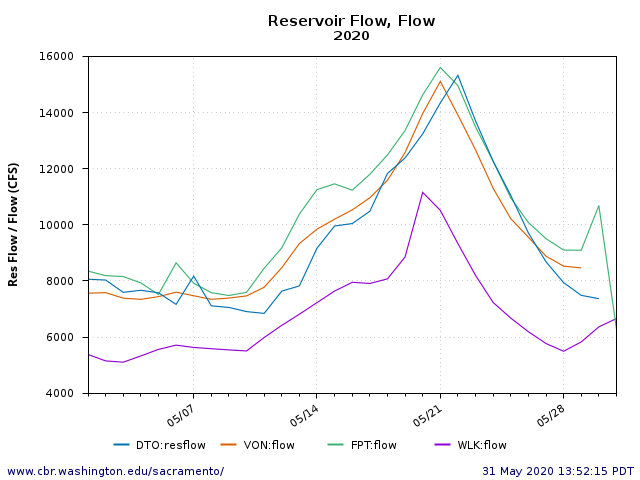
Figure 4. Delta outflow (DTO), and Sacramento River flow at Freeport (FPT, RM-35), Verona (VON, RM-70), and Wilkins Slough (WLK, RM-120) in May 2020.
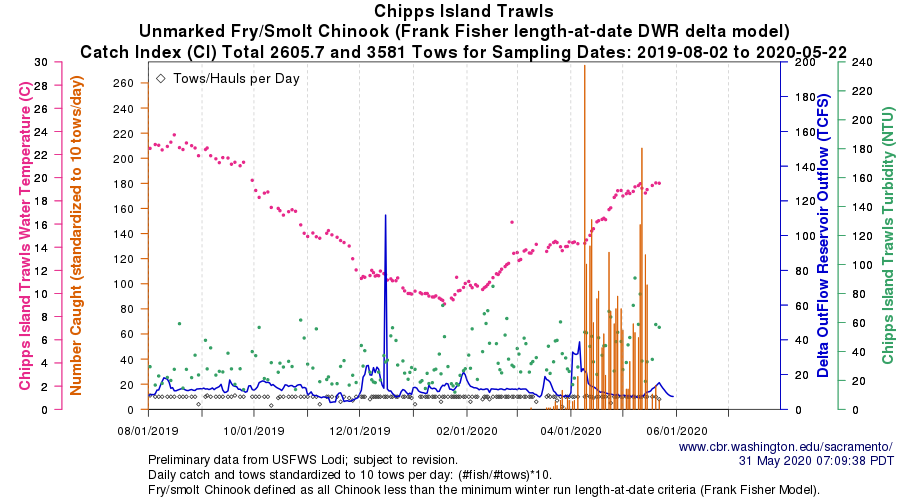
Figure 5. Unmarked salmon smolts captured in trawls leaving the Delta at Chipps Island in eastern San Francisco Bay, 8/1/2019 to 5/15/2020. Note increase in smolts escaping to the Bay after May 11.
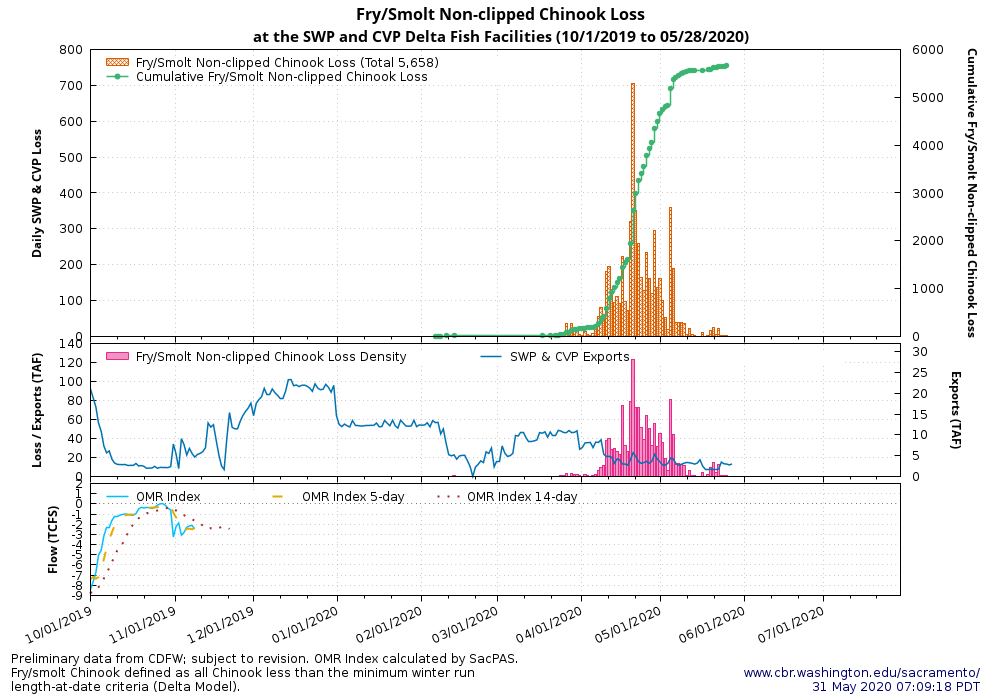
Figure 6. Unmarked juvenile salmon salvage at south Delta export facilities 10/1/2019-5/18/2020. Delta exports are shown in acre-ft in center panel. Note reduced salvage when exports were at minimum levels (about 3000 acre-ft per day, or about 1500 cfs) after mid-May.
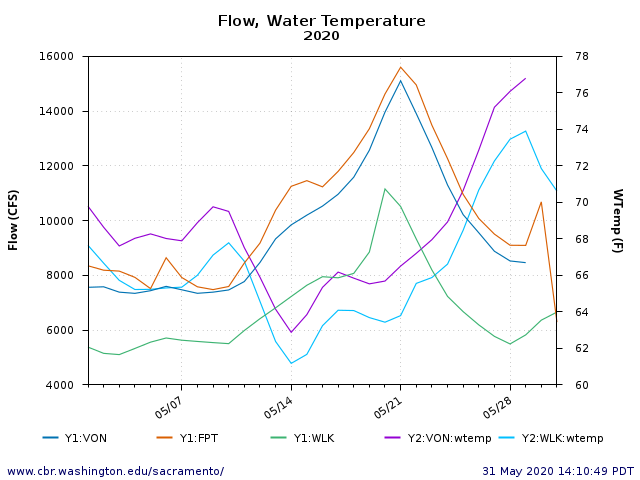
Figure 7. Sacramento River flow and water temperature at Freeport (FPT, RM-35), Verona (VON, RM-70), and Wilkins Slough (WLK, RM-120) in May 2020. Note the excessively high water temperatures (lethal for salmon at Verona, otherwise highly stressful) at Verona and Wilkins Slough in late May.
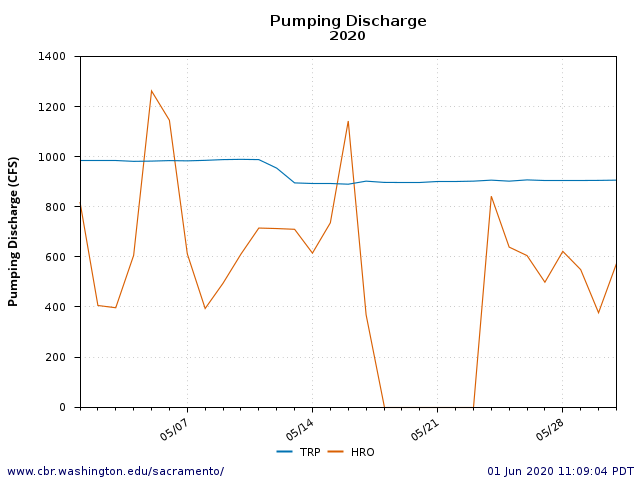
Figure 8. May 2020 Delta exports from federal Tracy Pumping Plant (TRP) and state Harvey Banks Plant (HRO).