The Sacramento Bee reported on August 31, 2016 that Dr. Ted Sommer at the California Department of Water Resources says that Delta smelt are starving. Dr. Sommer related recent success in stimulating the north Delta food web (Figure 1) by increasing flow through the Yolo Bypass in July as part of the state’s new strategy to help Delta smelt. I had reported earlier on the experiment and the strategy.
While Dr. Sommer was not implying that just adding some fertilizer to the north Delta would save the smelt, he was deflecting discussion and treatment away from the overriding cause of the collapse of Delta smelt: lack of spring-through-fall outflow to the Bay.
During August of this year, the normal heavy hand of Delta exports again reached out to degrade the critical habitat of what few smelt are left (Figure 2). In summer, Delta smelt concentrate near X2, the area of the estuary where brackish water of about 2 ppt salinity occurs. Food concentrates at X2, as shown in Figures 3 and 4. Chlorophyll levels at X2 are an order of magnitude higher than at Rio Vista (Figure 1), where Dr. Sommer observed the increase in chlorophyll from the recent experiment.
X2 also has cooler water temperatures and higher turbidities preferred by smelt (Figures 5 and 6). It is at X2 where smelt are meant to be so they do not starve, do not get eaten, and do not die from high water temperatures. The problem is that X2 habitat readily degrades when summer outflow is low (4000 cfs) and exports are high (11,200 cfs). Under these conditions, low-salinity habitat and food (plankton) are siphoned off with each tide into False River, into Dutch Slough, and further upstream into the San Joaquin River channel (also shown in Figure 2).
Smelt did fine in summer 2011, the year with the last decent fall smelt index. X2 was much further downstream, and Delta outflows were high (15,000 cfs). If X2 stays out of the Delta, and smelt can get to X2 and stay there, they and their food supply will be far better off. This requires about8,000-10,000 cfs outflow in July and 6,000-8,000 cfs outflow in August. The present 4,000 cfs outflow index (real outflow, as opposed to the index, is closer to zero – see Figure 2), while exports are11,200 cfs just does not meet their needs.

Figure 1. Chlorophyll concentrations at Rio Vista in the north Delta July 23 to August 31, 2016.
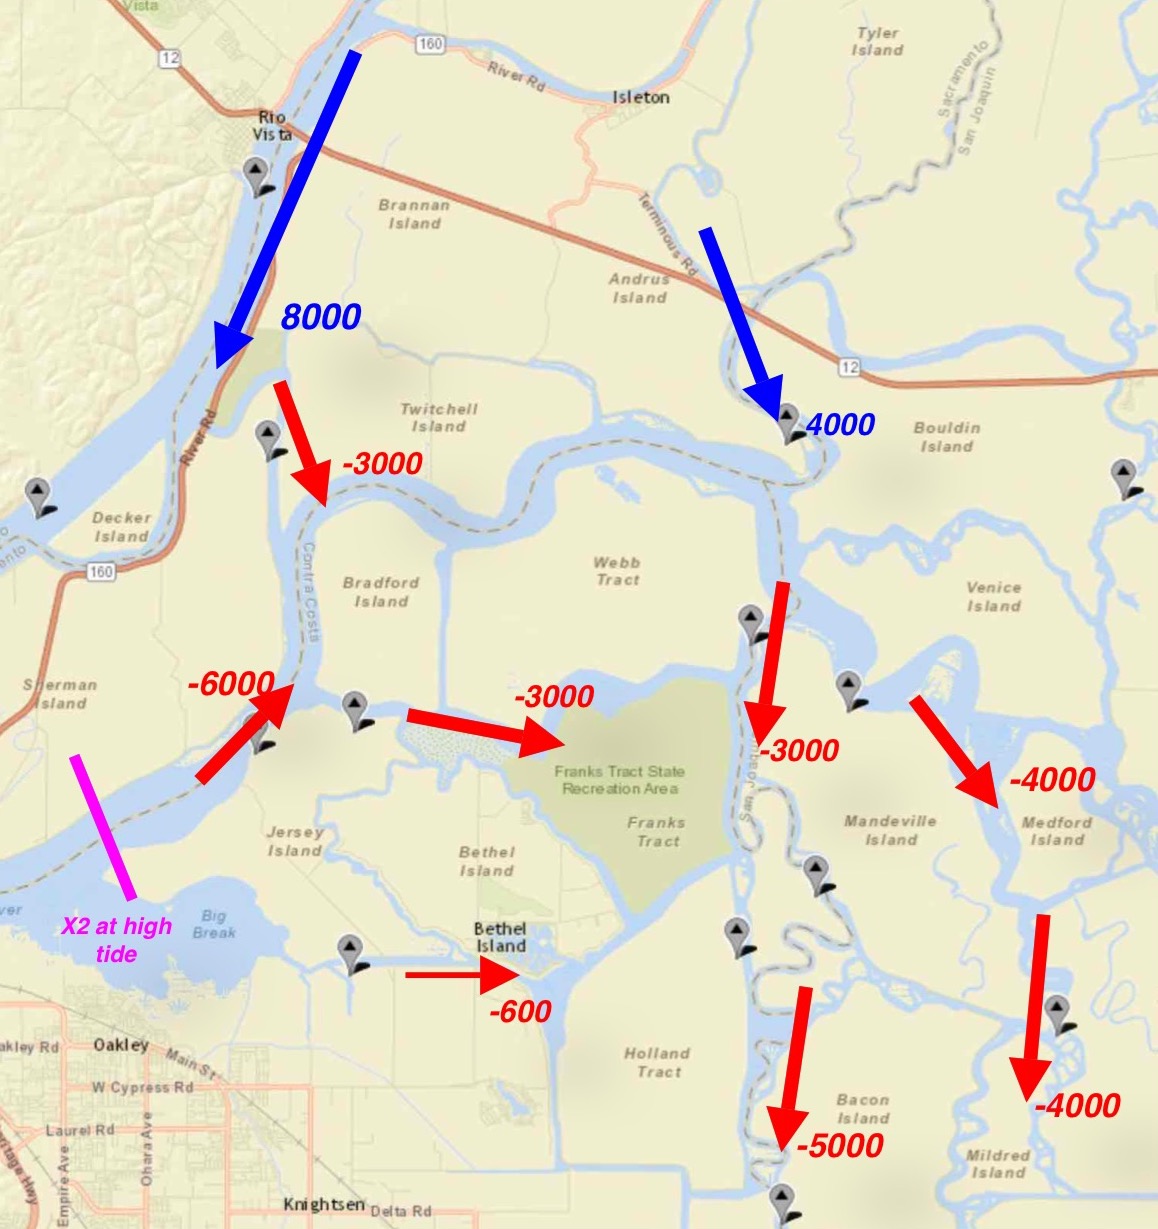
Figure 2. Net Delta hydrology (flow in cfs) on August 25/26 during a spring tide. Net Delta outflow is near zero with positive net flow in the Sacramento channel (north) and negative net flows in the San Joaquin channel (south). Exports were near maximum at 11,200 cfs. The location of X2 (2 ppt salt) at high tide is shown as magenta line.
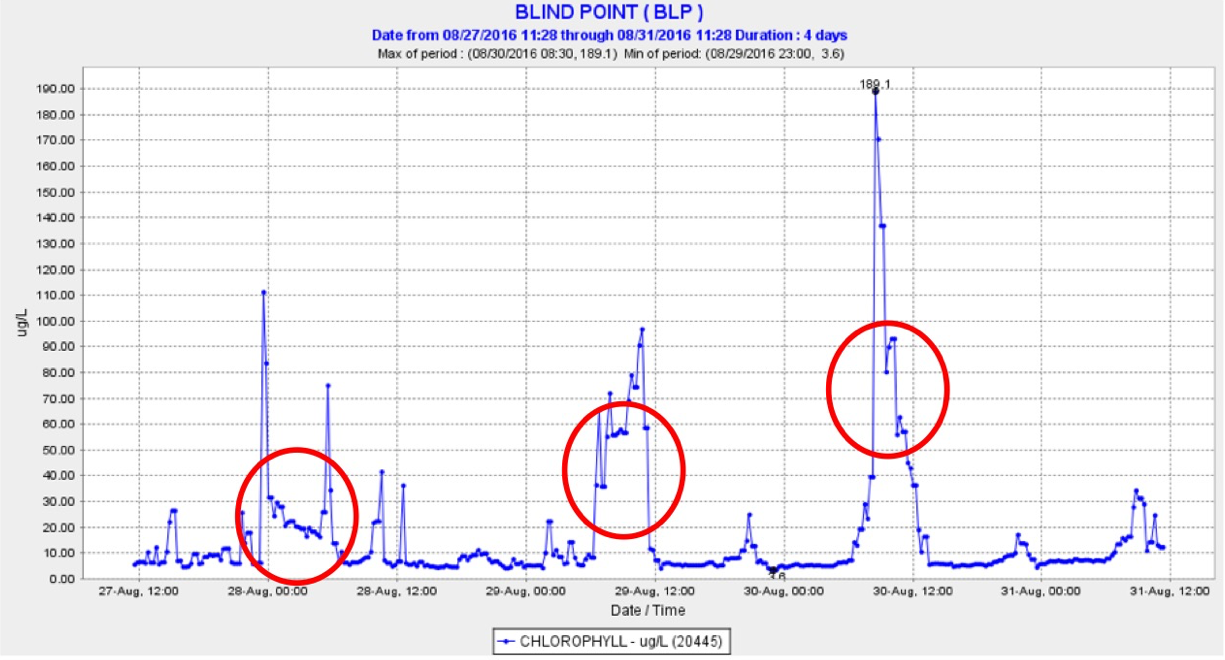
Figure 3. Chlorophyll concentrations in summer 2016 at Blind Point in the lower San Joaquin channel (magenta line in Figure 2). Red circles denote periods when X2 moved upstream to Blind Point.
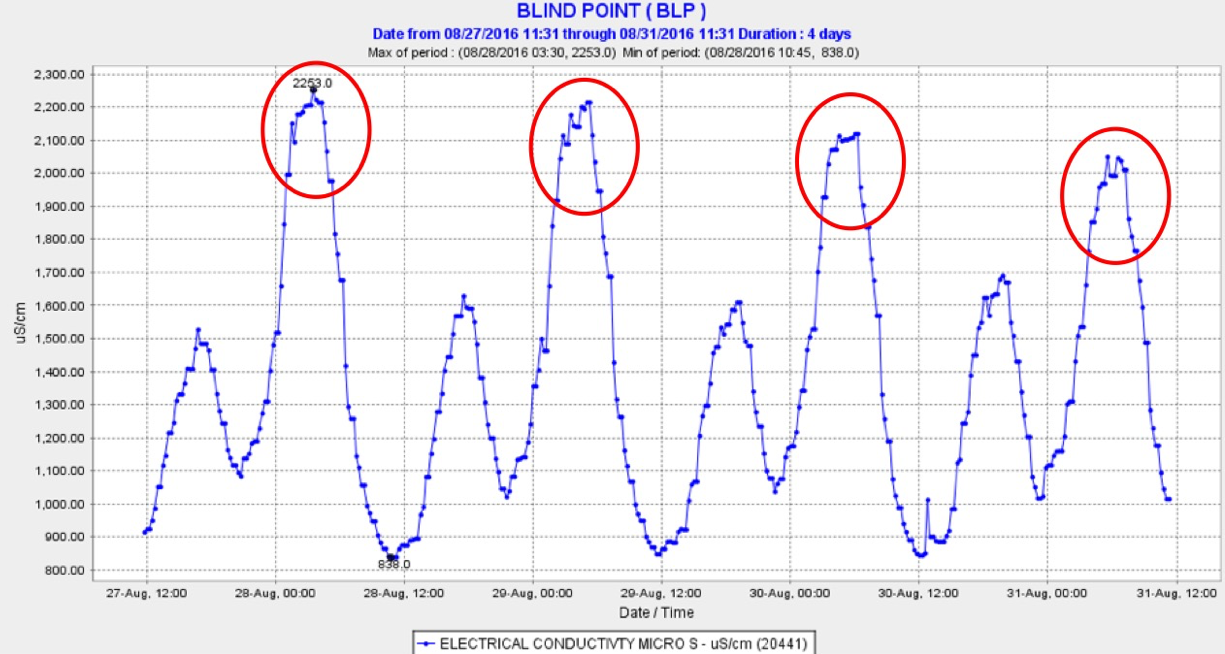
Figure 4. Salinity in summer 2016 at Blind Point in the lower San Joaquin channel (magenta line in Figure 2). Red circles denote periods when X2 approached Blind Point.
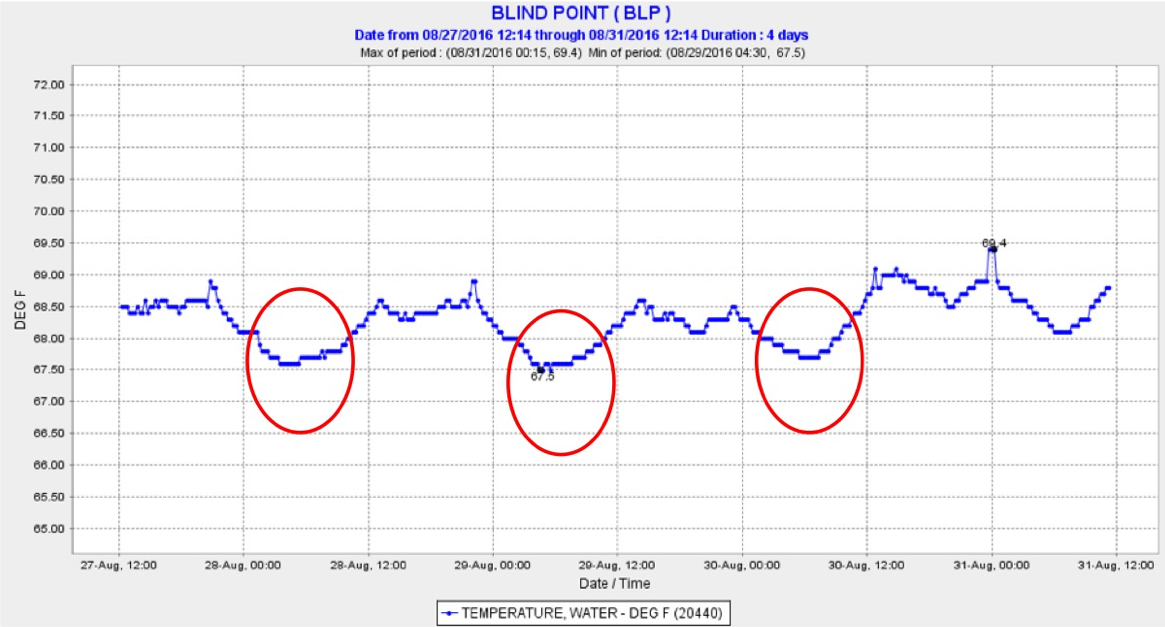
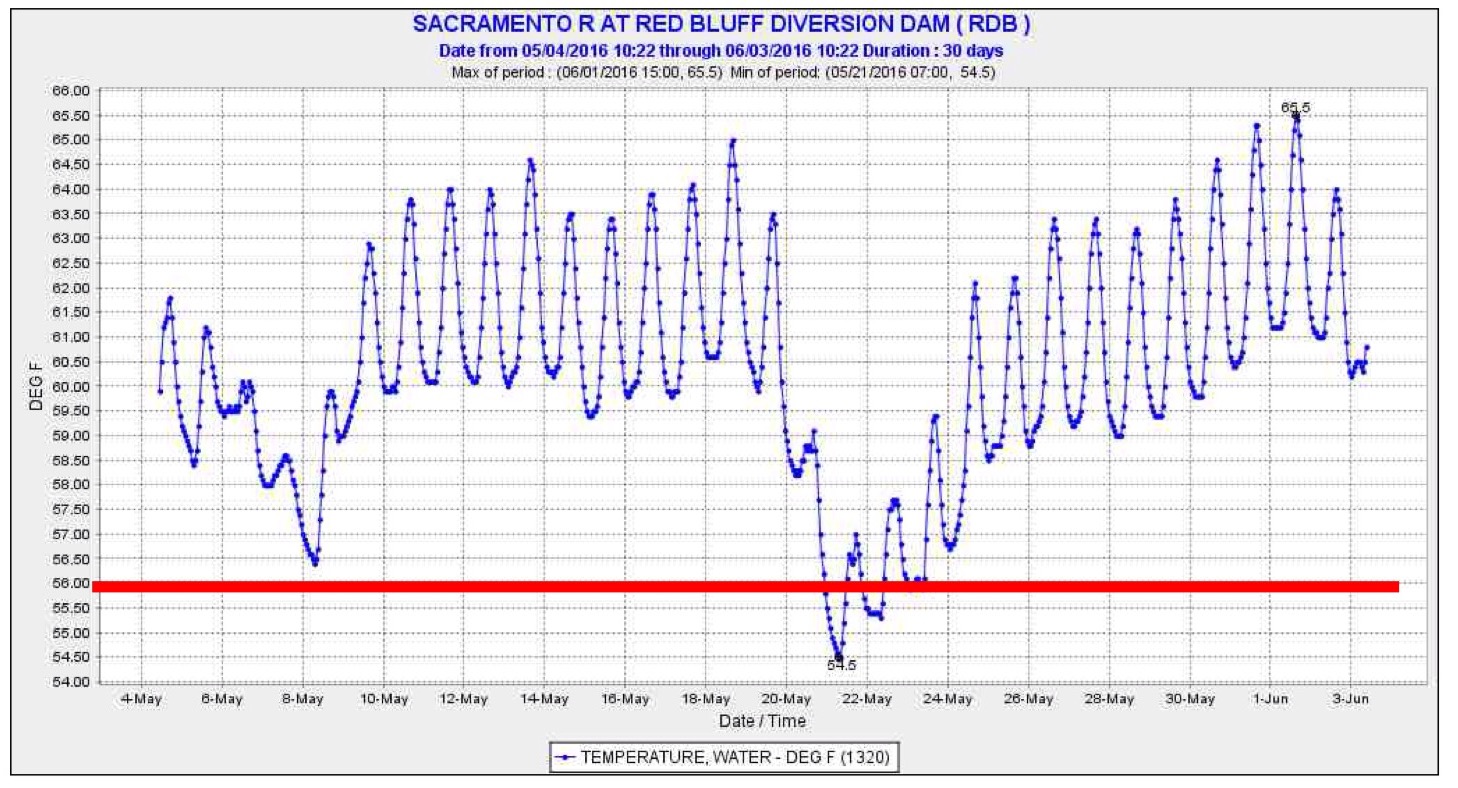
Figure 5. Water temperature in summer 2016 at Blind Point in the lower San Joaquin channel (magenta line in Figure 2). Red circles denote periods when X2 approached Blind Point.
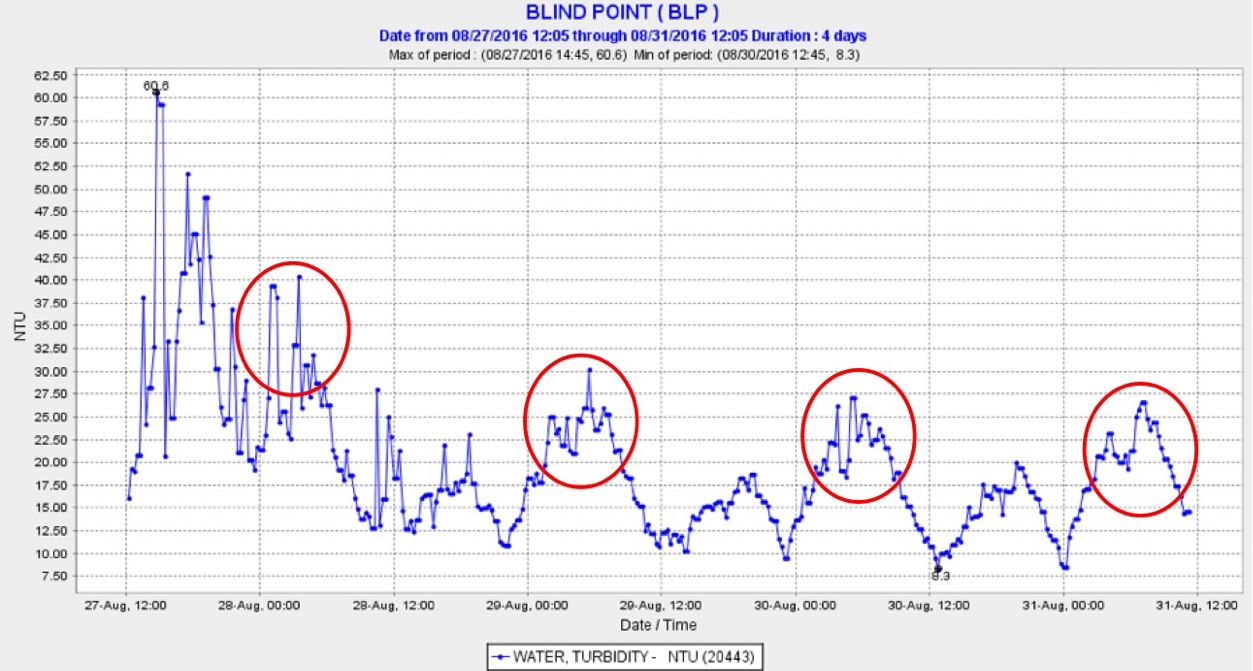
Figure 6. Turbidity at Blind Point in the lower San Joaquin channel (magenta line in Figure 2). Red circles denote periods when X2 approached Blind Point.
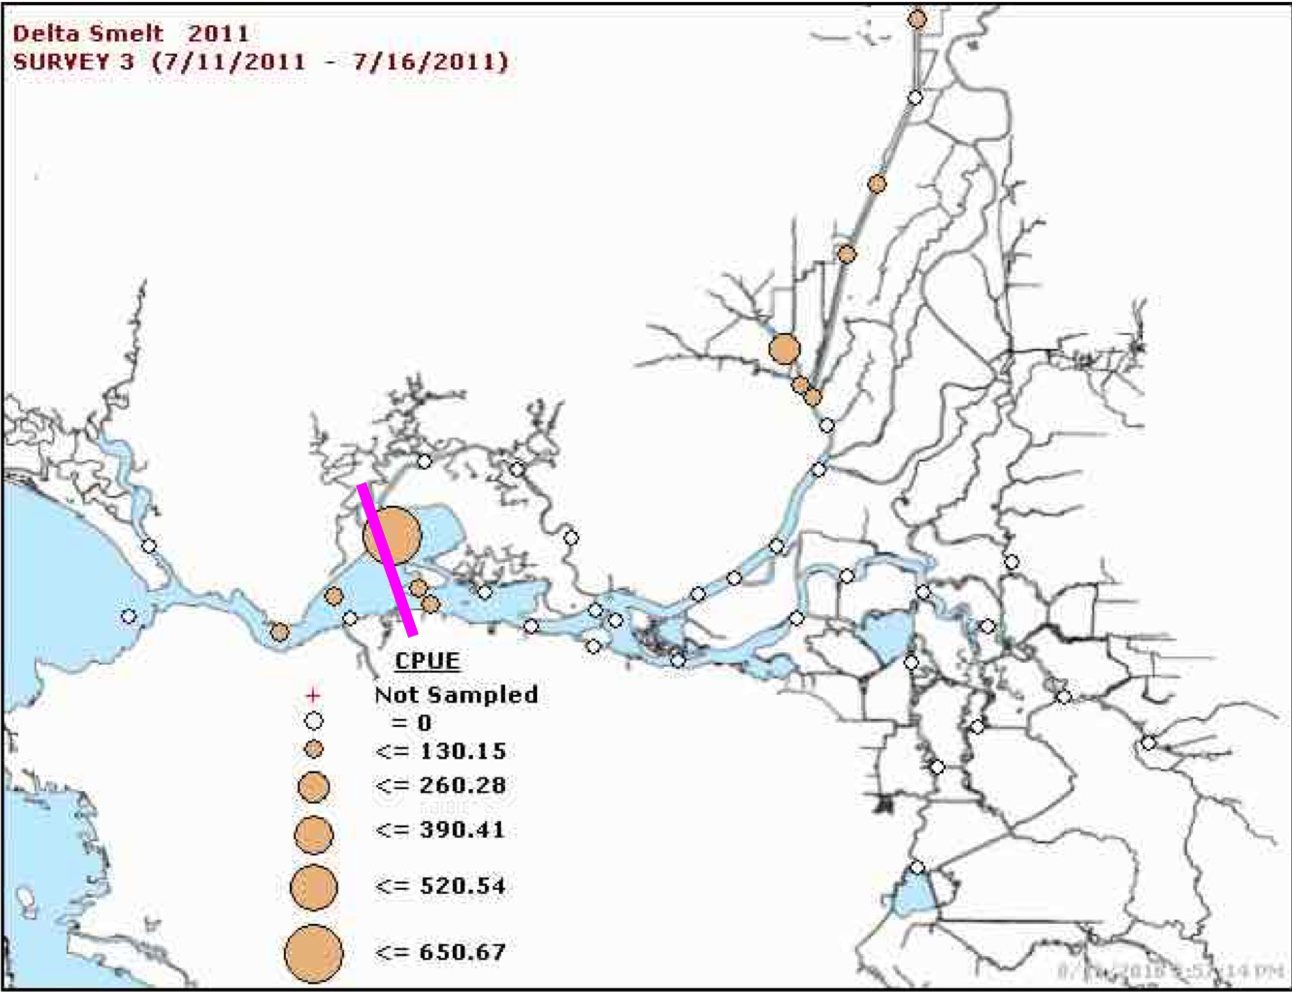
Figure 7. Concentrations of Delta smelt in the Summer Townet Survey July 2011. Magenta line is location of X2.