Sacramento River and Major Tributaries – Warm Spring Water Temperatures in 2024 Stress Salmon

The Need to Better Manage Water Temperatures (and Streamflows)

In this spring of Above-Normal Water Year 2024, with Central Valley storage reservoirs nearly full, warm water temperatures have again plagued salmon rivers.  Spring is important, especially for winter-run salmon that are beginning to spawn in the upper Sacramento River near Redding.  It is also important for spring-run salmon just finishing their runs up the Sacramento River to and into spawning tributaries to hold until the early-fall spawning season. 

Juvenile salmon (smolts) also head to the ocean in spring.  If the waters are too warm, salmon smolts suffer stress, stored nutrient depletion, poor growth, higher predation rates, and even direct heat-induced mortality.  Water temperatures above 75-77oF are generally lethal under extended exposure.  Waters above 70-72oF are highly stressful and generally avoided by salmon.  Best migrating temperatures are less than 65oF and should not exceed 68oF.  Best spawner-holding temperatures are less than 60oF.  Best spawning temperatures are <53.5oF.  River inputs to the Delta should be no higher than 65oF in April-May and 68oF in June (and summer). 

Salmon Spawning near Redding

Generally, water temperatures are not a problem in the upper Sacramento River below Shasta Dam near Redding except during salmon spawning.  Salmon spawn year-round in the upper river, and the target maximum spawning temperature in recent years has been a cold 53.5oF.  The source of this cold-water supply is Shasta Reservoir’s cold-water pool.  The water quality standard for the upper river of 56oF has been insufficient to sustain salmon eggs in the gravel; thus the new, lower target.

The new target could not be sustained in drought years 2021 and 2022 (Figure 1) because of insufficient Shasta Reservoir storage and cold-water-pool supply.  To conserve cold water for the prime June-August spawning and egg incubating season of the endangered winter-run salmon, Reclamation released warm surface Shasta water (not all from cold-water pool) in April-May of 2021 and 2022 to preserve the cold-water supply for summer spawning (at the expense of April-May winter-run spawning and fall-run salmon in their fall spawning season).  The poorly managed 2021 spawning season contributed to poor egg-stage survival and a record low smolt production to the ocean.  Warm fall spawning temperatures over the past three decades has contributed to the collapse of the fall-run salmon population of the upper river below Shasta Dam.

The obvious solution here is to better management of multi-year cold-water pool storage in Shasta Reservoir and of water deliveries from that storage in all year types.  Carryover storage is critical for ensuring an adequate supply of cold water for the next year.  Managing the cold-water pool in low-storage years is also important to ensure against its all-too-frequent late-summer depletion.

Figure 1.  Upper Sacramento River water temperature below Shasta/Keswick dams 2019-2024, with average for the wet decade 1996-2005.  Note in drought year 2021 the warm water releases to conserve cold-water pool for summer winter-run salmon spawning.  Also note lack of cold-water-pool supply for fall spawning salmon in drier years and the ability to sustain cold water in two recent wet years 2019 and 2023.

Salmon Spawning in Feather River near Oroville

Accommodating the Feather River salmon below Oroville Dam is a complex problem.  Spring-run salmon must reach the spawning reach (near Oroville) in the March-June migration season and then hold in the colder low-flow section near the hatchery until early fall spawning.  Fall-run migrate in late summer and early fall, and spawn when water temperatures cool in the fall. 

Migrating water temperatures are stressful (greater than 65oF) for adult salmon in the lower Feather River in the spring, summer, and fall (Figure 2).  Most of the water released from Oroville Reservoir passes through the large shallow afterbay complex before entering the high flow channel near Oroville. 

Only the hatchery and low-flow spawning channel reach receive the direct cold-water releases from Oroville Dam (Figure 3).  Holding water temperatures in spring and summer are stressful (greater than 60oF) for adult salmon in the low-flow section.  Spawning that would normally occur September-October is delayed in low-storage drier years until November.

Figure 2.  Water temperatures in recent years (2020-2024) in the lower Feather River at Gridley (in the high-flow channel below afterbay complex outlet). Note cooler water temperatures in wet year 2023 and spring 2024.

Figure 3.  Water temperatures in recent years (2019-2024) in the lower Feather River at Oroville (in the low-flow channel upstream of afterbay complex outlet). Note cooler water temperatures in wet years 2019 and 2023.  Also note summer 2023 short-term peak caused by Oroville Dam operations outage.  Summer water temperatures in this primary adult spring-run salmon holding reach are generally stressful (greater than 60oF).

Spring-Run Salmon in Sacramento Tributaris

Deer Creek and Mill Creek

While spring-run salmon migrate into Deer and Mill Creeks predominantly in March-April, some migrate as late as May and June.  Some later-emigrating smolts also leave the creeks in May and June. These later-immigrating emigrating smolts and adult pre-spawners are subject to warm stressful water temperatures on their journeys, especially in drier years lacking snowmelt.  In a wetter year like 2024, stressful water temperatures (>65oF) are not encountered until June (Figure 4).  In drought years like 2021, under lower streamflow, stressful water temperatures occur in May, with near lethal temperatures by early June (Figure 5).  Maintaining streamflow in wet years in late spring of wet years during heat waves can help to minimize stressful late-spring migration conditions.  Maintaining streamflow in April-May of dry years by limiting water diversions can help to minimize stressful water temperatures during the main migration season.  

Figure 4.  Streamflow and water temperature in lower Deer Creek near Vina (DCV) and lower Mill Creek near Los Molinos (MLM) in spring of above normal water year 2024.  Note stressful water temperatures for migrating salmon beginning in early June.  Note also slightly lower water temperatures and higher streamflow in Mill Creek compared to Deer Creek. 

Figure 5. Streamflow and water temperature in lower Deer Creek near Vina (DCV) and lower Mill Creek near Los Molinos (MLM) in spring of drought water year 2021.  Air temperature at Red Bluff also shown.  Note stressful water temperatures for migrating salmon beginning in early May.  Peak water temperatures occurred during late May heat wave.  Note also slightly lower water temperatures and higher streamflow in Mill Creek compared to Deer Creek. 

Butte Creek

Lower Butte Creek is home to the “Core” endangered spring-run salmon population in the Central Valley.  Lower Butte Creek’s spring-run salmon are supported by cold-water transfers from the West Branch of the Feather River.  Butte Creek spring-run adult immigrants and smolt emigrants suffer in their late spring (June) migrations from warm stressful water temperature (from higher air temperatures and lower streamflows) in wetter (Figure 6) and drier (Figure 7) years.  Summer water temperatures are also high (Figure 8), forcing pre-spawn spring-run salmon to hold near cold-water inputs near Centerville from the West Branch of the Feather River.

In drought year 2021 the summer cold-water source was inadequate and 90% of the estimated 20,000 holding adult spring run salmon died.  The 2021 summer die-off coupled with a poor spawning run in 2020, contributed to a record low spawning run in 2023.  Poor lower Sacramento River spring river conditions (see next section) also contributed.  Maintaining the summer cold-water source for the lower Butte Creek is essential in maintaining the Butte Creek spring-run salmon population.

Figure 6.  Streamflow and water temperature in lower Butte Creek near Chico in spring of above normal water year 2024.  Note stressful water temperatures for migrating salmon beginning in early June (greater than 18oC/65oF). 

Figure 7.  Streamflow and water temperature in lower Butte Creek near Chico in spring of drought water year 2021.  Air temperature at Red Bluff is shown in Figure 5.  Note stressful water temperatures for migrating salmon beginning in early June (>18oC/65oF).  Peak water temperatures occurred during late-May/early-June heat wave with falling streamflow.  Note the late-May early-June heat wave (see Figure 5 air temperatures) was likely a contributor to the 2021 die-off of holding adult spring-run salmon.

Figure 8.  Water temperature in lower Butte Creek near Chico, downstream of adult salmon holding reaches, 2013-2024.  Note peak summer water temperatures occurred in summer of critical drought years 2015 and 2021. 

Lower Sacramento River above Delta

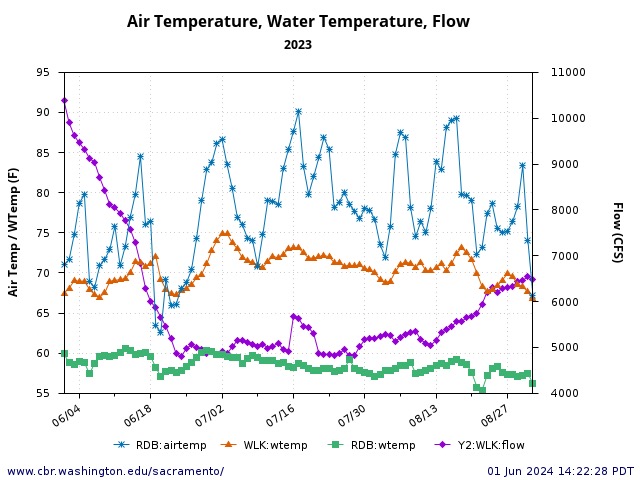
Low flows and high water temperatures in the Sacramento River above and below the confluence with the Feather River, as measured at Wilkins Slough (RM 120) and Verona (RM 90), respectively, contributed to poor spring migration conditions in spring 2024.  As Wilkins Slough flows dropped to near 5000 cfs, water temperatures in May rose above 20oC/68oF (Figure 9).  Good conditions occurred in spring of wet year 2023, but not in summer (Figure 9).  Higher streamflows of 6000-8000 cfs would likely maintain the 20oC/68oF water quality standard and minimize stress to migrating salmon.  Increased Shasta Reservoir releases in combination with reduced water diversions from the Sacramento River would remedy these stressful migration conditions.  In past years, water contractors deferred some spring irrigation to meet water quality objectives in the lower Sacramento River.  Summer conditions are also important because of late-season salmon migrants and for maintaining summer fall-run adult salmon runs in the lower Sacramento River and the Delta.

Figure 9.  Streamflow and water temperatures at Wilkins Slough (RM 120) in the lower Sacramento River in 2023 and 2024.

Delta

Sacramento River flows entering the Delta at Freeport in spring 2024 were maintained at 65oF or less.  Inflows averaged about 20,000 cfs (Figure 10), with two-thirds of the flow coming from the cooler Feather and American Rivers. 

On the San Joaquin River side of the Delta, San Joaquin River flows from 2000 to 5000 cfs are necessary to maintain temperatures below 18oC (65oF) in April-May and below 20oC (68oF) in June (Figure 11).  Flows of less than 5000 cfs in June 2024 led to extreme water temperatures (70-75oF).  Depending on air temperatures, it takes flows of 2000 cfs or higher to maintain these minimum water temperatures in drier years (Figure 12).  Maintaining temperatures below 65oF in April-May and below 68oF in June has only been possible in wetter years (Figure 13). 

Figure 10.  Sacramento River streamflow and water temperature at Freeport in north Delta in 2023 and 2024.  Streamflow is darker blue.  Note large tidal effects on streamflow at average daily streamflows below 20,000 cfs. 

Figure 11.  San Joaquin River streamflow and water temperature at Vernalis in south Delta in spring 2024.  Note rise in water temperature in June 2024 as streamflow dropped from 5000 cfs to 2000 cfs.

Figure 12.  Streamflow and water temperature in San Joaquin River at Vernalis in dry years 2020 and 2021. Note streamflows less than 1000 cfs in May 2021 generally led to water temperatures more than 70oF.  Note also streamflows from May-July 2021 near 1500 cfs led to water temperatures less than 70oF.

Figure 13.  Water temperatures (F) in the lower San Joaquin River at Mossdale in the south Delta from 2019-2024.  Also shown is average daily water temperatures for period 1996-2005.

Managing Heat Waves

Over the past two decades, there has been an increase in the number of heat waves each summer in the Sacramento River Valley.  The frequency of events with extreme heat with average air temperatures over 90oF has roughly doubled in the last decade compared to the previous decade (Figures 14 and 15)Stressful and lethal water temperatures for salmon are more frequent during heat waves, especially under lower streamflows.  The only way to manage the periodic heat stress on salmon is to manage streamflows and water diversions with extraordinary actions in heat waves.  This takes coordination between water users and water managers, as well as salmon scientists and regulators.

Heat wave forecasting and water-temperature-related flow actions allow for coordination and potential minimization of heat stress on salmon populations.  Combinations of reservoir releases and water diversion rates are possible on regulated rivers like the lower Sacramento, Feather, and American rivers.  On unregulated rivers (no storage reservoirs) like Deer and Mill creeks, only limiting water diversions may be actionable.

Figure 14. Average daily air temperatures in summers 2019-2023 in Central Valley at Redding Airport.

Figure 15.  Average daily air temperatures in summers 2009-2013 in Central Valley at Redding Airport.

Restoring American River Spring-Run Chinook Salmon

For decades, the possibility of restoring spring-run Chinook salmon in the American River has been ignored.  With recent changes to the Nimbus Hatchery fish ladder and federal and state mandates to focus more on the recovery of Central Valley spring-run Chinook, it is time to recover the American River’s spring-run salmon.

The American River spring-run were never really lost.  The river has always had modest numbers of these iconic salmon that attracted fishermen and even guides each spring to the lower river below Nimbus Dam.  It wasn’t much of a secret.  It was more common knowledge and a nice complement to spring shad and steelhead fishing.  These spring-run salmon were generally believed to be strays from other Sacramento River spring-run streams and the Feather River Fish Hatchery.

The spring-run hung around all summer waiting to spawn.  They concentrated at the outlet of Nimbus Dam.  In late summer, CDFW would install the hatchery rack to force returning fall-run salmon into the old Nimbus Hatchery ladder.  A mixture of spring-run and early returning fall-run were usually trapped above the rack immediately below Nimbus Dam.  Most of these salmon died by the end of the fall spawning season without spawning.  In some years, thousands of carcasses would pile up on the upper side of the rack, a hundred yards below the dam outlet.  There was even a special carcass survey and tag return site designated for the rack site where “fall-backs” were counted and recorded in tag databases.

The “waste” of these salmon was a concern that played a part in the decade-long design and construction of the new hatchery fish ladder and retirement of the hatchery rack in 2022.

The end of the rack problem created a new problem: what to do with the early-arriving stray spring-run that collect below Nimbus Dam near the entrance to the new fish ladder.  These spring-run salmon must now either wait for the November opening of the new hatchery ladder or spawn in the river after it cools in November.

The new norm is to allowing them into the ladder in November and count and spawn them as fall-run.  The problem with this approach is that it creates a problem not unlike that which occurs at the Feather River Fish Hatchery – interbreeding of fall-run and spring-run.

I suggest CDFW and Reclamation change this strategy: operate the new ladder in spring to capture the stray spring-run to restore the once-prolific American River spring-run salmon population.  Adult spring run could be collected and sorted in the Nimbus Hatchery and then trucked up I-80 to the Middle Fork of the American River upstream of Folsom Reservoir, as the first stage of a trap-and-haul recovery project.  The second stage would be collecting-trapping juvenile salmon in the Middle Fork and bringing them back to the lower river for release.  Hopefully those released would begin to contribute to a new more genetically pure race of American River spring-run salmon.

A poor second choice would be for CDFW to separate the two American River runs like they now do at the Feather River Fish Hatchery.

Salmon Expectations from Wet Year 2023 and Above Normal Year 2024

After five critical drought years and only two wet years in the decade from 2013 through 2022, there is hope that Wet year 2023 and Above Normal year 2024 will help recover California salmon populations.  However, some salmon survival factors that were not improved and some that were made worse in these two years compared to previous wet years will limit salmon recovery from the 2020-2022 drought.

The 2020-2022 drought caused poor runs of adult salmon returning to spawn in 2022 and 2023 (and likely also in 2024).  Low spawner numbers contributed to low production of juvenile outmigrants to the ocean in 2023 and 2024, despite good in-river habitat conditions.

The poor production of juvenile salmon in brood years 2022-2024 will limit fisheries from 2024 to 2027.  Whether good river flows in the winter and spring of 2023 and 2024 lead to some recovery remains to be seen.

Negative Factors

There are a several factors that seriously limit salmon recovery in Wet and Above Normal years in California’s Central Valley.  If not addressed, these factors will result in an uncertain future with continuing poor salmon runs and fishery closures.

  1. Low Adults Returns from Poor Drought-Year Smolt Production

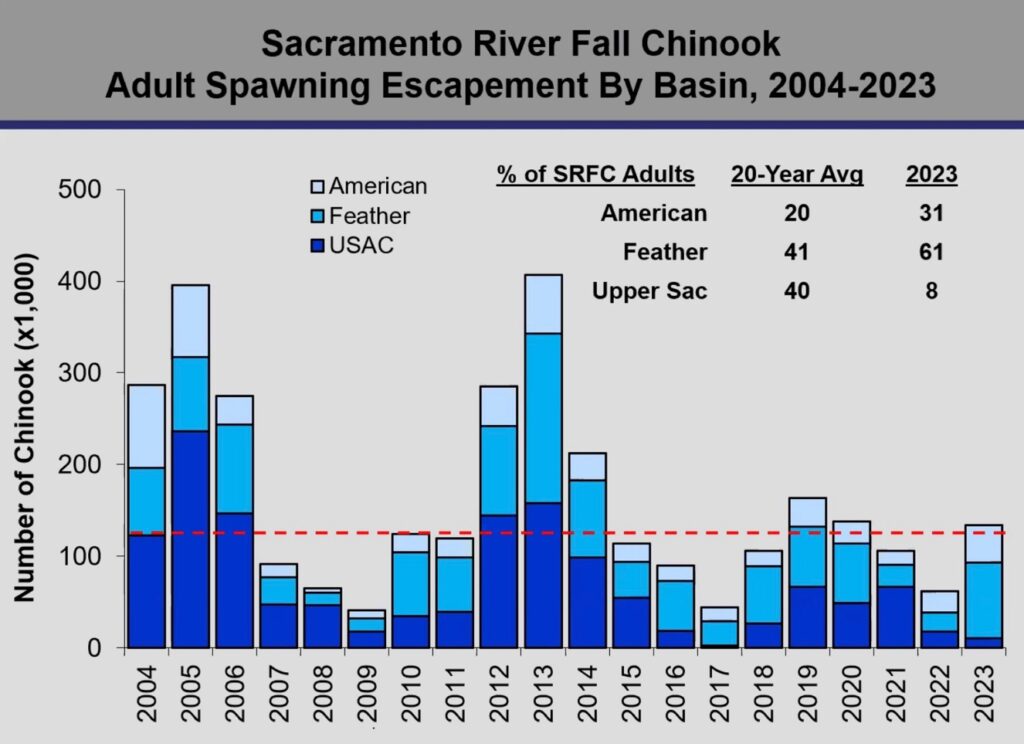
Brood years 2020 and 2021 smolt production to the ocean in drought years 2021 and 2022 was poor.  This poor production led to the lower-than-expected adult returns in 2023 and probably in 2024.  Despite a complete fishery closure in 2023 (fisheries generally harvest 50-70% of salmon brood year production), the 2023 salmon escapement to the rivers was poor (Figures 1 and 2).  The same patterns are likely to repeat in 2024.  In other words, two years of fishery closures may not be sufficient to mitigate the poor smolt production in drought years 2021 and 2022. The poor adult returns will compromise brood year 2023 and 2024 smolt production from low numbers of eggs spawned.  There were limited actions taken to increase smolt production in these drought-plagued brood years.  As a result, adult returns (escapement) are likely to remain depressed through 2027.

  1. Lower Sacramento River Flow and Water Temperatures

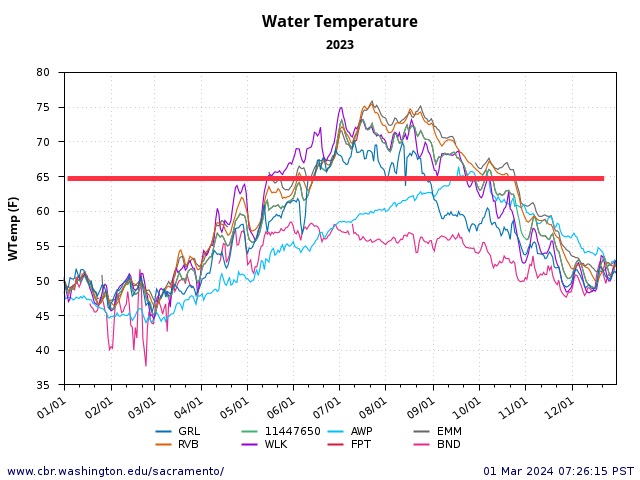
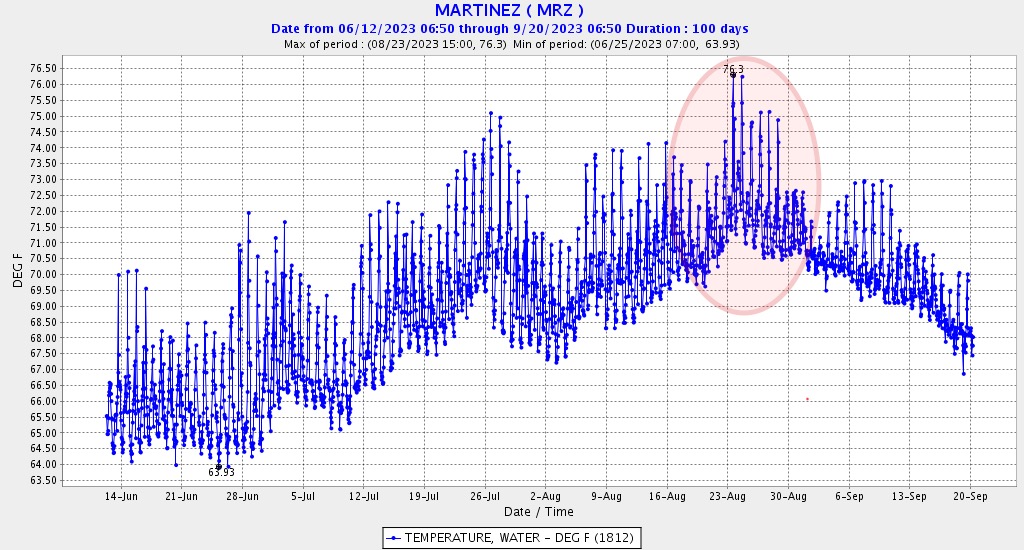
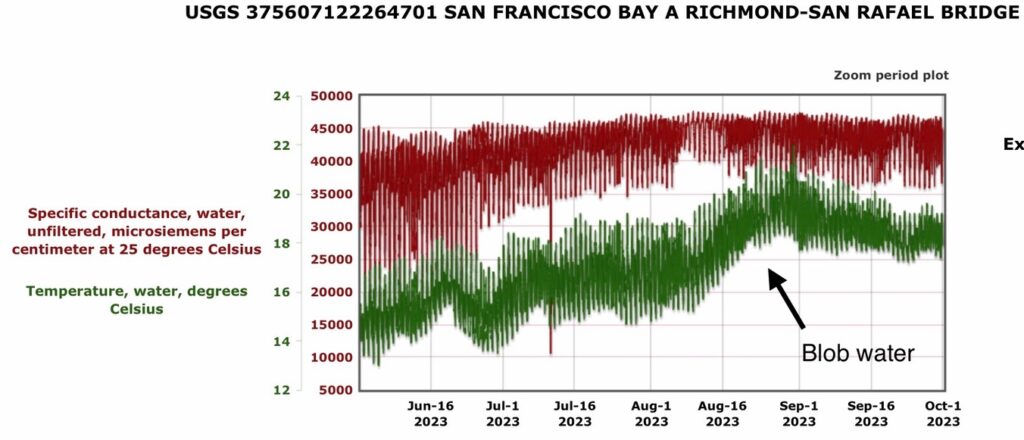
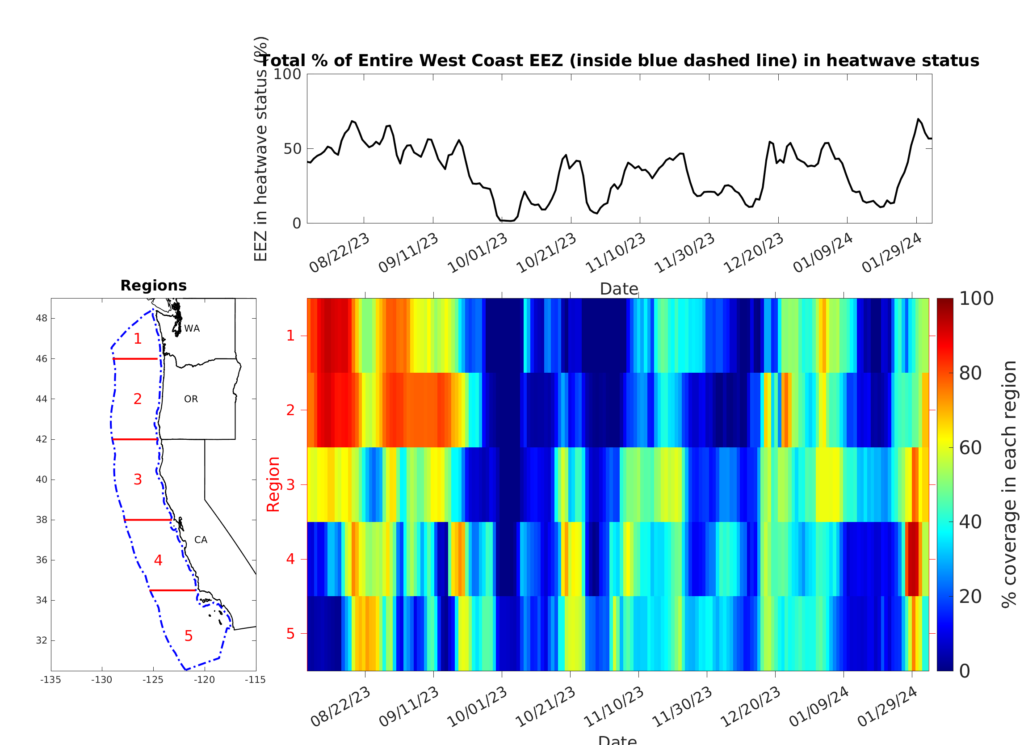
Another factor in the poor adult run up the Sacramento River in Wet year 2023 was unusually low flows (Figure 2) and higher water temperatures (Figure 3) in the lower Sacramento River and Bay-Delta during the summer-to-early-fall immigration period.  Adult salmon migrate into San Francisco Bay in summer and up the Sacramento River to spawning grounds in late summer for fall spawning.  Delta outflow to the Bay in summer-fall 2023 was lower than the most recent wet years (Figure 3).  Water temperatures of the summer outflow in the Sacramento River channel entering the Bay near Rio Vista were 70-75oF (Figure 4).  Such temperatures are highly stressful to the adult salmon, and adult salmon generally avoid them.  Water temperatures in San Pablo Bay (North Bay) and Suisun Bay (East Bay) reached 70oF or higher (Figure 5 and 6), especially during that portion of the monthly tidal cycle when the Delta drained into the Bay (during the full moon spring tides).  Ocean coastal water temperatures were also elevated (a condition termed the Blob) (Figures 6 and 7).

Water temperatures were also elevated through the summer in the lower Sacramento River upstream of the Delta (Wilkins Slough near Grimes, Figure 4), frequently exceeding 70oF from June through August.  The water quality standard for the lower Sacramento River in summer is water temperatures no higher than 68oF.  That standard was met in Wet water year 2011 (as required under the 2009 federal salmon biological opinion) but not in Wet years 2017, 2019, or 2023.

Lower-than-normal Wet-year river flows (Figure 8) and associated higher water temperatures (Figure 9) in spring of Wet year 2023 also stressed spring immigrating adult winter-run and spring-run salmon.  Such conditions also compromised salmon smolt production of brood year 2022 salmon by reducing late emigrating smolt (June) survival.  The standard of 20ºC/68ºF for the lower river above and below the mouth of the Feather River is designed to protect late migrating adult and smolt salmon.

  1. High Delta Exports

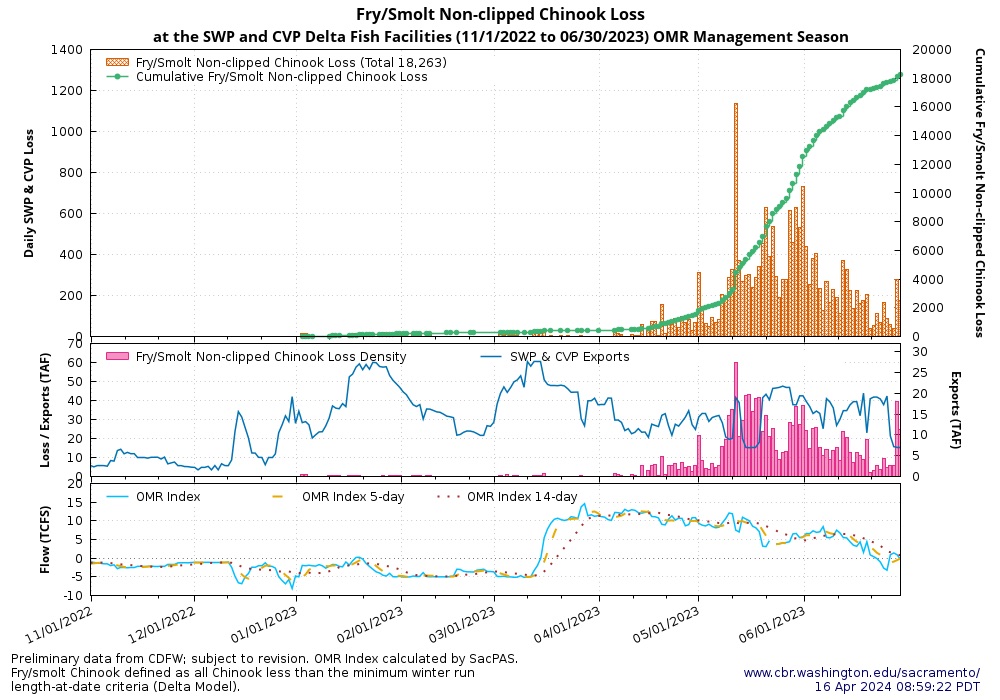
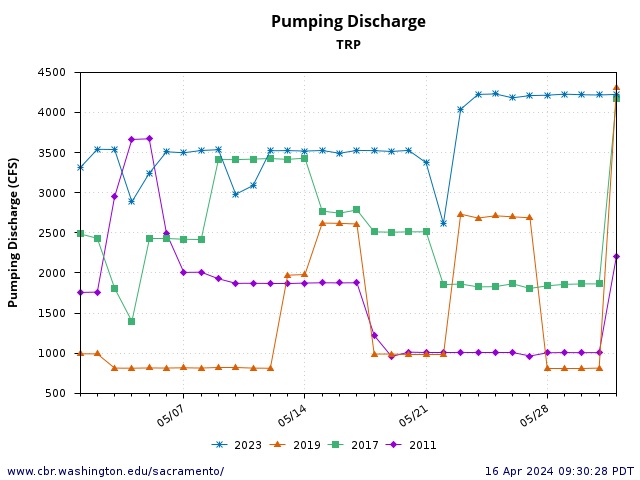
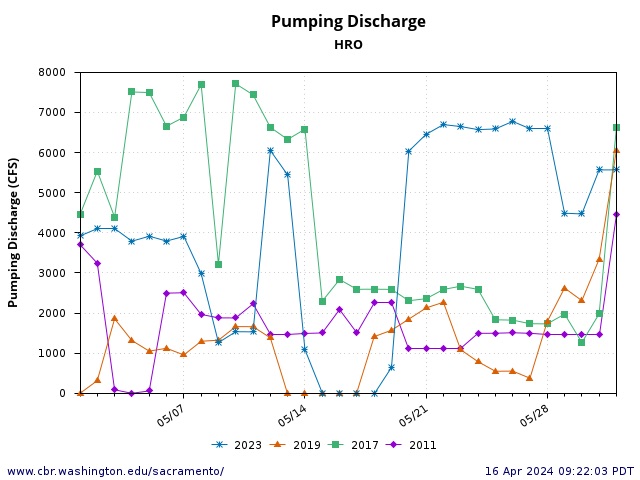
Salvage of juvenile salmon at Delta export pumps generally peaks from mid-May to mid-June, during peak smolt emigration of spring-run and fall-run Chinook salmon (Figure 10).  Often salvage numbers are higher in Wet years because of high production (survival of fry) in Wet years.  Export rates in water year 2023 were abnormally high for a Wet year (often near the 11,000 cfs maximum) during May (Figure 11).  In contrast, Wet year 2011 rates were only 2000-4000 cfs.  Historically allowed rates under D-1485 standards (pre-1995) were a maximum of 6,000 cfs in May and June.  Under the CVPIA and VAMP programs (1990s and 2000s), spring exports were also restricted to protect emigrating juvenile salmon.   That is no longer the case with weakened restrictions in the federal 2019 biological opinions governing recent Delta export operations.

Salmon salvage at export pumping facilities is generally considered an indicator of juvenile salmon being drawn into the central and southern Delta from the main channels of the Sacramento and San Joaquin rivers.  If salvage rates are high, then salmon losses throughout the Delta are likely high.  The risk of juvenile salmon being drawn into the south Delta (and lost) is highest at high export levels when south Delta exports dominate interior Delta hydrodynamics.

  1. Loss of Salmon in the Flood Bypasses in Wet Years

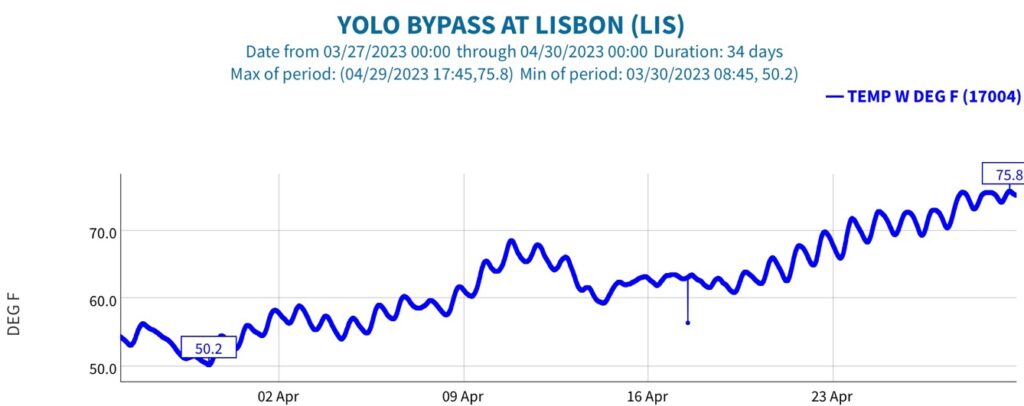
In winter-spring of wet years like 2023 and 2024, high flows in the Sacramento River channel spill into the Sutter and Yolo bypasses via five flood control overflow weirs (Moulton, Colusa, Tisdale, Fremont, and Sacramento weirs).1  Wet-year spills combined can account for over half the total river flow in the middle and lower Sacramento Valley.  In 2023 and 2024, flood spills to bypasses peaked from January to March (Fremont Weir and Yolo Bypass flows shown in Figure 13), during peak emigration of juvenile salmon of brood years 2022 and 2023 (Figure 14 and 15).  While the flooded bypasses are generally believed to be good juvenile salmon rearing habitat, the bypasses are often only flooded for a week or two and then drain quickly, as flood weir spills generally end abruptly.  The sudden draining strands millions of juvenile salmon in borrow pits, rice fields, duck ponds, and ditch networks – over 100,000 acres of flooded bypass habitat – habitats that warm significantly in April as the bypasses drain (Figure 16).

Adult spring-run and winter-run salmon also become stranded in winter-spring of Wet years if they are attracted to the bypass routes in their upstream migration toward the upper Sacramento River and tributary spawning grounds.  Upon reaching the weirs, the adult salmon are blocked by the concrete weirs from re-entering the river and continuing their journey upstream.  Of note is the recently constructed fish-passage notch in the Fremont Weir that continues flows to the Yolo Bypass from the Sacramento River after the weir spill ends (see March-April 2024 flows over 1000 cfs in Yolo Bypass in Figure 13).  The notch allows the adult salmon to pass through the Fremont Weir at lower (descending) river flows.  Such notches are planned in the other weirs but have not yet been built.

Positive Factors

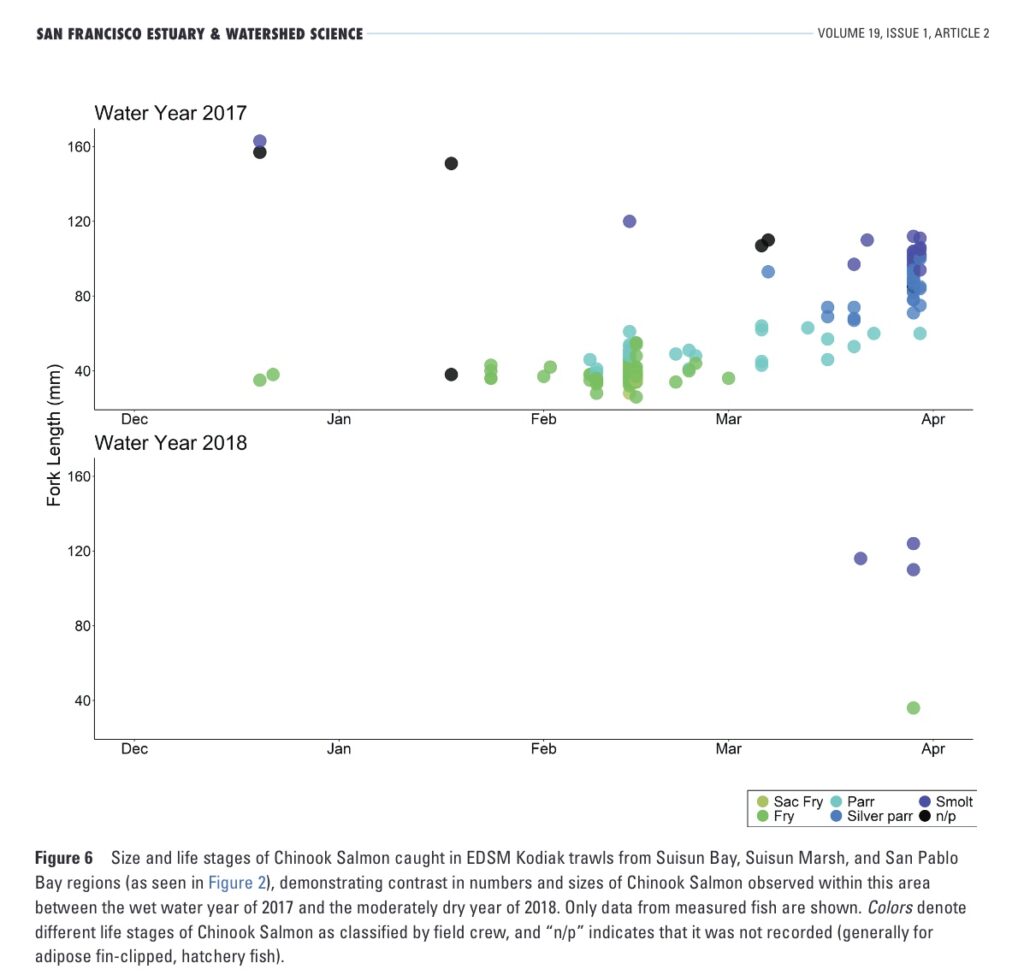
There are some positive factors for salmon production in Wet year 2023 and Above Normal year 2024.  The higher river and Delta flows support the emigration of the juvenile salmon and keep the water temperatures down (Figure 14 and 15) before the river, bypasses, and Delta get too warm (Figure 16).  As a result, hatchery and wild smolt survival rates are higher in Wet years.  Wild and hatchery juvenile salmon need sufficient Delta outflows to reach the Bay in spring to finish off their development before heading into the ocean (Figure 17).

Summary and Conclusions

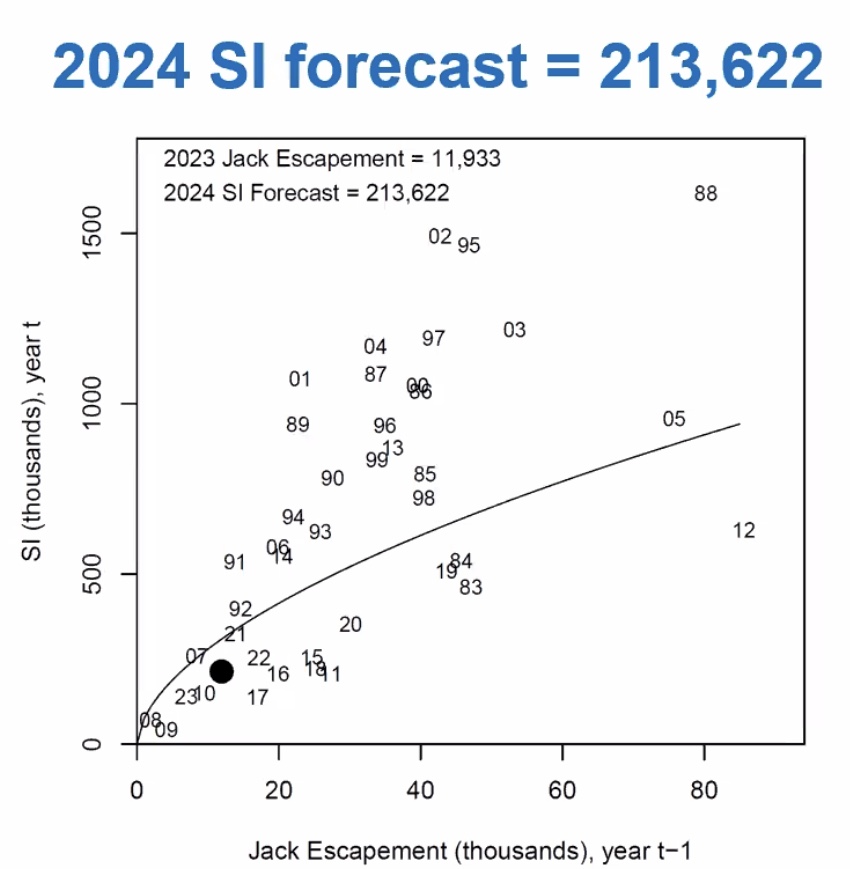
The past two winter-springs (2023 and 2024) ought to be major recovery years for Central Valley salmon.  However, ongoing problems continue to plague salmon recovery.  Production indices that guide fishery management options remain low (see 2024 Sacramento River ocean-salmon-index forecast in Figure 18).  It is going to take forecasts into the 500,000 to 1,000,000 range to bring back historic fisheries.  The only way to do that is rebuilding the stocks in Wet and Above Normal years when the production potential is higher.  That may be difficult in the years ahead, because we cannot control marine heat waves, ocean-derived Thiamine deficiencies, ocean foodwebs, and Sierra snowpacks.

For more on the future of California salmon fisheries see the following perspectives from NOAA Fisheries:

https://www.fisheries.noaa.gov/feature-story/looking-back-blob-chapter-2-marine-heat-wave-intensifies-completely-chart

https://www.fisheries.noaa.gov/news/oceans-influence-salmon-plays-out-varied-returns-different-rivers-and-regions

https://www.fisheries.noaa.gov/feature-story/survivor-salmon-withstand-drought-and-ocean-warming-provide-lifeline-california

Figure 1. Fall Chinook escapement from 2004 to 2023. Major components of the fall Chinook population are upper Sacramento River including the mainstem and tributaries as well as the Battle Creek Hatchery, the Feather River and the Feather River Hatchery, and the American River and the Nimbus Hatchery. The red dashed line is the target escapement number to sustain a maximum sustained yield for ocean and river fisheries. Note the near record low run in the upper Sacramento River in 2023, generally attributed to poor smolt production in drought years 2021 and 2022. Higher Feather and American River escapement in 2023 is attributed to releases of hatchery smolts to the Bay and ocean during drought years 2021 and 2022 (practices not employed by the Upper Sacramento River’s Battle Creek Hatchery until 2024 on a large scale), as well as the fishery closure in 2023.

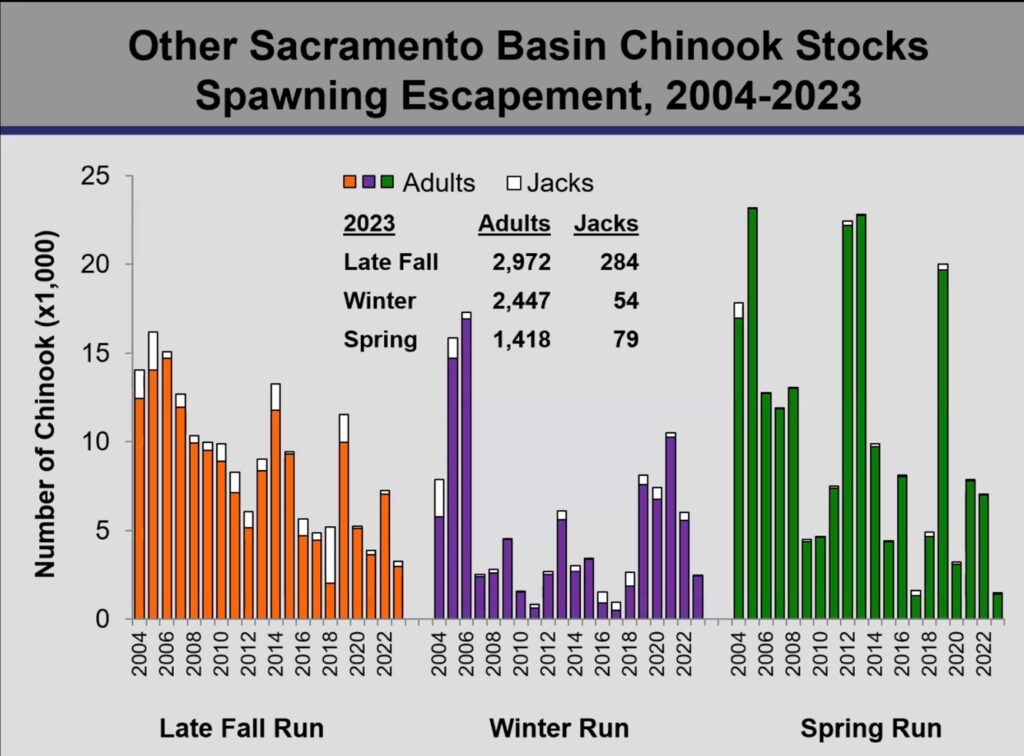
Figure 2. Escapement of other salmon runs to the Sacramento River Basin 2004-2023. Note near record low numbers except for winter run. Also, low numbers of jacks indicate 2024 adult runs are expected to be low for winter and spring run.

Figure 3. Delta outflow in summer of Wet year 2023 compared to three most recent Wet years.

Figure 4. Water temperatures in the Sacramento River system in 2023: BND is upper river and Bend Bridge near Red Bluff; WLK is middle river near Grimes; FPT (and 11447650) is north Delta near Freeport; EMM and RVB are Emmaton and Rio Vista Bridge in the western Delta; GRL is lower Feather River near Gridley; and AWP is lower American River at William Pond. Red line denotes stressful water temperature boundary – above 65ºF water temperatures are stressful to migrating adult salmon – adult salmon avoid water temperatures exceeding 72ºF.

Figure 5. Water temperature in north Bay near Martinez in summer 2023. Red circle depicts unusually high water temperature event attributable to high Bay air temperatures, high Delta outflow temperatures, and high coastal ocean temperatures.

Figure 6. Salinity and water temperature in central San Francisco Bay in summer 2023. The effect of the ocean “Blob” on the Bay is noted.

Figure 7. Coastal zone heat wave in summer 2023 (commonly referred to as the Blob). Source: NOAA.

Figure 8. May through July daily average flow of the Sacramento River at Freeport in the four most recent Wet years. Note trend toward lower flows in early summer. Lower Delta inflows and higher Delta exports in late spring and early summer hinder salmon recovery in Wet years.

Figure 9. May through July daily average water temperatures of the Sacramento River at Freeport in three recent Wet years. Note the lower water temperatures in 2011, corresponding to higher Delta inflows in 2011 shown in Figure 8.

Figure 10. Salvage of juvenile Chinook salmon at south Delta export facilities in spring 2023. Also shown are export rates and net flows in Old and Middle Rivers (OMR) that represent pull toward the export pumps. Note juvenile salmon are present through June under high exports of near 10,000 cfs (20,000 acre-ft per day).

Figure 11. Export rates in May in four most recent Wet years at federal Tracy Pumping Plant in south Delta. Note high May 2023 rates that reached 4250 cfs – the maximum allowed rate.

Figure 12. Export rates in May in four most recent Wet years at state Harvey Banks Pumping Plant in south Delta. Note May 2023 reached 6800 cfs – near the maximum allowed rate.

Figure 13. Flow rate (cfs) in Yolo Bypass canal below Fremont Weir in 2023 and 2024. Flow above 1000 cfs are generally associated with Fremont Weir spills from the Sacramento River. Note March-April 2024 flows provided in part by the new weir notch.

Figure 14. Lower Sacramento River juvenile salmon catch in screw traps at Knights Landing in winter-spring 2023. Note upper river emigration ceased about mid-May, indicating most of the juvenile salmon were in the Bay-Delta by mid-spring.

Figure 15. Lower Sacramento River juvenile salmon catch in screw traps at Knights Landing in winter-spring 2024.

Figure 16. Water temperature in mid Yolo Bypass in April 2023. Lethal water temperatures (70-75ºF) were reached by late April.

Figure 17. Juvenile salmon present in Bay trawl collections in wet year 2017 and below normal year 2018. Note low catch in 2018 is representative of low transport and survival of juvenile salmon to the Bay in drier years.

Figure 18. Sacramento River fall-run salmon ocean-abundance-index forecast (2024 is large black dot). Source: NOAA and PFMC.

  1. In high flow years the upper river also spills over natural streambanks into the Sutter/Butte Basin via Angel Slough.

Why is the Delta so Warm in Summer?

72-75oF is too warm for native fishes in the Delta.  In drought years, we are not surprised when the Delta is too warm in summer, particularly when the State issues emergency drought orders that allow low Delta inflows and outflows.  But we do not expect the Delta to be warm in summer of wet years like the three latest 2017, 2019, and 2023 (Figures 1 and 2).  Water temperatures were not that warm back in wet year 2011 or in recent decades 1995-2004 (Emmaton) or 2001-2010 (Rio Vista) (Figures 1 and 2).

What is causing the high summer Delta water temperatures?  Part of the cause is low Sacramento River flows and associated high water temperatures coming into the Delta.  Available streamflow and temperature data in the Sacramento River just above and at the entrance to the Delta for Wilkins Slough, Verona, and Freeport (Figure 3) clearly show this pattern.  Summer flows in the lower Sacramento River at Wilkin Slough were particularly low in 2017 and 2023 (Figure 4), which led to higher Delta water temperatures (see Figures 1 and 2).  Summer 2011 was the only year after 2010 that met the water quality standard of 68oF water temperature (Figures 5 and 6).  Water temperatures at Wilkins Slough, Verona, and Freeport where the Sacramento River enters the Delta have the same consistent pattern (Figures 7 and 8) – water temperatures are too warm (>68oF) in summer.

It seems that the resource and water management agencies have simply written off the problem as purely a function of climate change/global warming.  They should not.

When Valley air temperatures are high (near average daily 80oF), it takes flows up to 8,000-10,000 cfs in the lower Sacramento River to keep water temperatures down near 68oF (Figures 9-11).  If lower Sacramento River flows at Wilkins Slough can be maintained at an average of about 8,000 cfs (range of 6,000-10,000 depending on air temperatures), the water temperature standard of 68oF (20oC) can more frequently be met (see Figure 4).  Also, Delta water temperatures can more frequently be maintained below 72oF.

If this had been accomplished in the years after 2011, then smelt and fall-run salmon population crashes may have been less severe.

Figure 1. Water temperatures (average daily) at Rio Vista in north Delta from June through August of wet years 2011, 2017, 2019, and 2023 along with average for decade of 2001-2010.

Figure 2. Water temperatures (average daily) at Emmaton in west Delta in June through August of wet years 2011, 2017, 2019, and 2023 along with average for decade of 1995-2004.

Figure 3. Three water temperature gage locations (in bold type) on the lower Sacramento River above and at the entrance to the Delta near Sacramento. Other gages also noted.

Figure 4. Stream flow (average daily) at Wilkins Slough in the lower Sacramento River upstream of the Delta in wet years 2011, 2017, 2019, and 2023 along with average for decade of 1995-2004. Note midsummer flows in 2023 and 2017 were only half the average of 1995-2004. Flows were higher in late summer in the four recent wet years to meet the Fall X2 requirement for wet years.

Figure 5. Water temperatures at Wilkins Slough in the lower Sacramento River in years 2008 to 2023 along with water quality standard (red line). The four warmest summers were critical drought years when water quality standards were relaxed because of limited available water supply.

Figure 6. Water temperature (hourly) at Wilkins Slough in the lower Sacramento River in summer 2011 with average daily for previous 14 years. The water quality standard is 68oF average daily temperature. The standard was met in 2011 and in many of the years before that.

Figure 7. Available water temperature data at Verona in the lower Sacramento River in years 2008 to 2016. Water year 2011 was the only wet year in the sequence of available data from the Verona gage.

Figure 8. Water temperature and river flow (average daily) in Sacramento River at Freeport in north Delta 2008-present.

Figure 8. Water temperature and river flow (average daily) in Sacramento River at Freeport in north Delta 2008-present.

Figure 9. Red Bluff air and water temperatures (average daily) with Wilkins Slough streamflow and water temperatures (average daily) in summer of wet year 2017. The 68ºF water temperature standard could not be met under the midsummer <6000 cfs level of flow. It took flows of nearly 8000 cfs in the mid-June heat wave to maintain 68ºF. Late August flows near 7000 cfs were able to bring water temperatures again near 68ºF.

Figure 10. Red Bluff air and water temperatures (average daily) with Wilkins Slough streamflow and water temperatures average daily) in summer of Below Normal water year 2018. There were concerted efforts on the part of Reclamation and its partners to maintain the water temperature standard in summer 2018 after wet year 2017. First, the early summer pulse of 6000 cfs followed by sustained flows near 7000 cfs. The early August 7500 cfs pulse and cooler air brought water temperatures down to 65ºF. Subsequent flow reductions to 6000 cfs were able to maintain the 68ºF standard with the cooler air temperatures.

Figure 11. Red Bluff air and water temperatures (average daily) with Wilkins Slough streamflow and water temperatures (average daily) in summer 2023. Midsummer streamflows <6000 cfs were unable to sustain water temperatures below 70ºF. Cooler air and 5200 cfs briefly brought water temperatures below 70ºF at the beginning of August. Cooler air and sustained flows near 6000 cfs maintained water temperatures below 70ºF in late August.