Salmon in the Sacramento, Klamath, and Trinity rivers depend on maintaining cold water releases from Shasta and Trinity reservoirs through the summer and early fall. Major die-offs of salmon on the lower Klamath and lower Sacramento below Shasta have occurred under conditions of low flows and high water temperatures. In summer and fall of dry years, flows and water temperature cannot be maintained if there is too little reservoir storage, especially the cold-water portion in the bottom of the reservoirs.
The biggest overall threat is that one of the reservoirs will run out of cold water in September and October when salmon eggs and embryos are in the gravel spawning beds in the rivers. For Winter Run salmon in the Sacramento, eggs are in the gravel from June through August. For Klamath-Trinity and Sacramento Spring Run salmon, eggs are in the gravel beginning in September or October; Fall Run eggs in each river are in the gravel beginning in November. In addition to the high water temperatures that can kill any of the eggs, flow reductions in the Sacramento in September and October can also dewater spawning beds after initial spawning in higher flows has occurred.
Government agencies have typically blamed large scale mortality events on the more than a decade-long series of droughts and competition between irrigation demands and water for salmon. But better water management of the Shasta and Trinity divisions of the Central Valley Project by the Bureau of Reclamation and other federal and state agencies can reduce mortality. Massive salmon die-offs in the Klamath, such as the one that occurred in 2002, have been avoided by targeted late summer and early fall cold-water releases from Trinity Reservoir during the past two multiyear droughts. However, failures of the 2014 and 2015 Winter Run broods below Shasta on the Sacramento River were not avoided.
Salmon runs continue to decline during droughts, with hatcheries making up a greater proportion of the runs in both river systems. On the Trinity, wild Spring and Fall Run salmon are at only 32% and 17%, respectively, of restoration program goals.1 All the Sacramento runs are down, especially the Winter Run, and prognosis for future years is poor based on broodyear failure the past two years. Ocean stocks of Klamath-Trinity and Central Valley salmon are also down this year, which will likely lead to severe sport and commercial fishery restrictions.2
So what measures are in the works for 2016 for protecting salmon? Depending on what precipitation falls in the remainder of winter and this spring, there has been speculation of further restrictions on irrigation deliveries and water supplies, and the allocation of more colder water below the dams for salmon.
In addition to the many actions I identified in previous posts,3 there are several further options that should be considered for 2016 to benefit salmon:
- The Klamath-Trinity system should get more emphasis because of potential risks to its salmon, and because it has not fared as well as the Sacramento system in the latest multiyear drought. Shasta Reservoir has reached 60% of capacity as of 1 March (Figure 1). Trinity Reservoir has reached only 40% (Figure 2). This summer, less water could be delivered to the Sacramento River from Trinity Reservoir via Whiskeytown Reservoir to the Sacramento River below Shasta Reservoir than last summer (Figure 3). Water delivered through Whiskeytown is warmer than water delivered from Shasta; reducing deliveries through Whiskeytown would thus save Trinity storage and the cold-water pool supplies in both Trinity and Shasta reservoirs.
- Increasing the relative contribution of Trinity Reservoir to the Sacramento River in April and May (and reducing the summer contribution) would save the cold-water pool supplies in both Trinity and Shasta reservoirs. April-May releases from Whiskeytown Reservoir to the Sacramento River below Shasta are colder (<53°F) than the summer releases (58-59°F) (Figure 4) that threaten Winter Run salmon.
- Reducing hydropeaking power production during summer would reduce the demands on the cold-water pools. Much of the water released from Shasta, Trinity, and Whiskeytown reservoirs in summer is released in the hot afternoon hours for hydropower production peak demands, leading to warmer waters in Keswick and Lewiston reservoirs. To ensure water that released from these two reservoirs is not too warm for salmon in the rivers below, Bureau of Reclamation operators should optimize daily water deliveries through powerhouses for water temperatures rather than for the value of power.
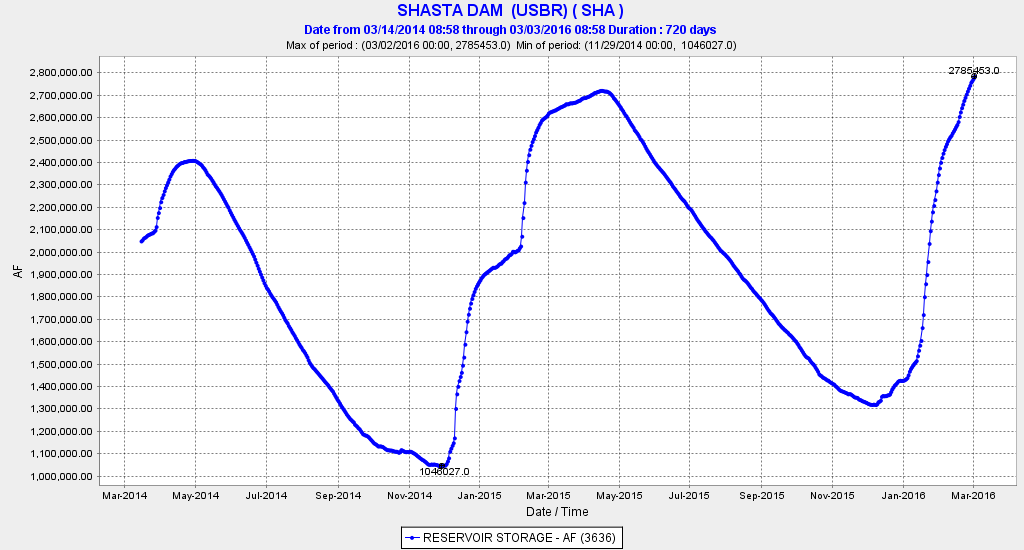
Figure 1. Shasta Reservoir storage March 2014 to March 2016. (Capacity is 4,552,000 AF.)
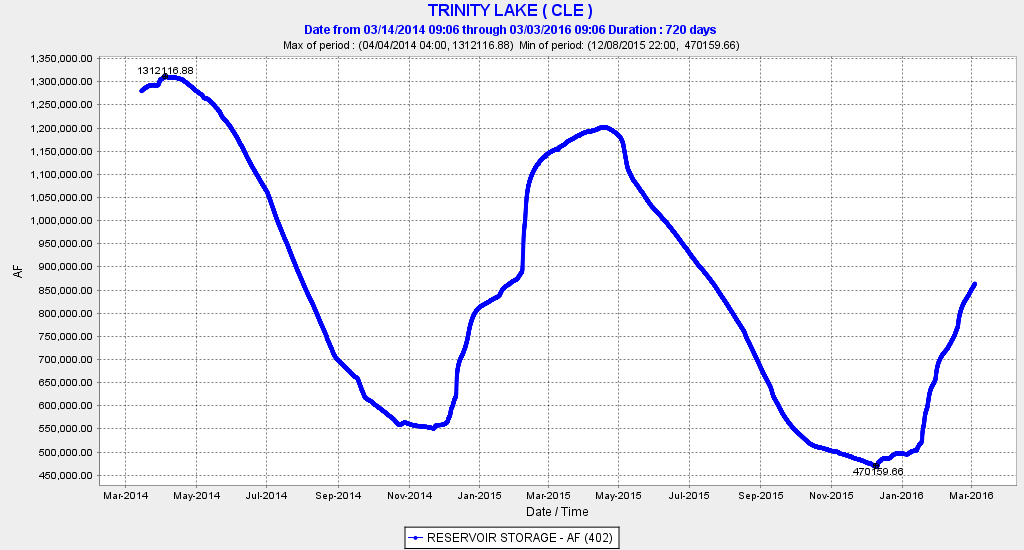
Figure 2. Trinity Reservoir storage March 2014 to March 2016. (Capacity is 2,447,650 AF.)
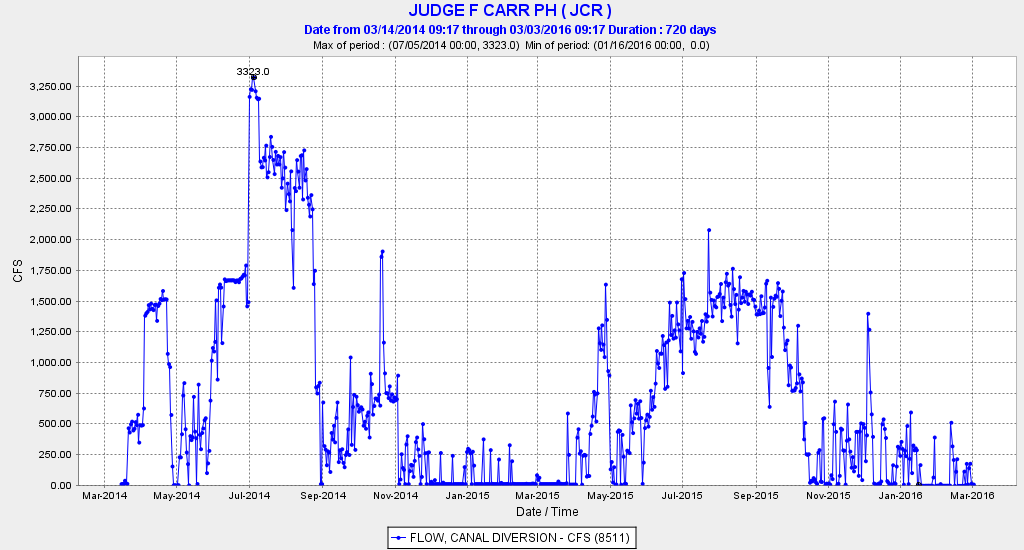
Figure 3. Water deliveries to Whiskeytown Reservoir from Trinity Reservoir via Lewiston Reservoir outlet to Carr powerhouse March 2014 to March 2016. Water then proceeds to Keswick Reservoir immediately below Shasta Reservoir on the Sacramento River. Approximately 100-200 cfs of these flows is also released to Clear Creek, which flows into the Sacramento River below Redding.
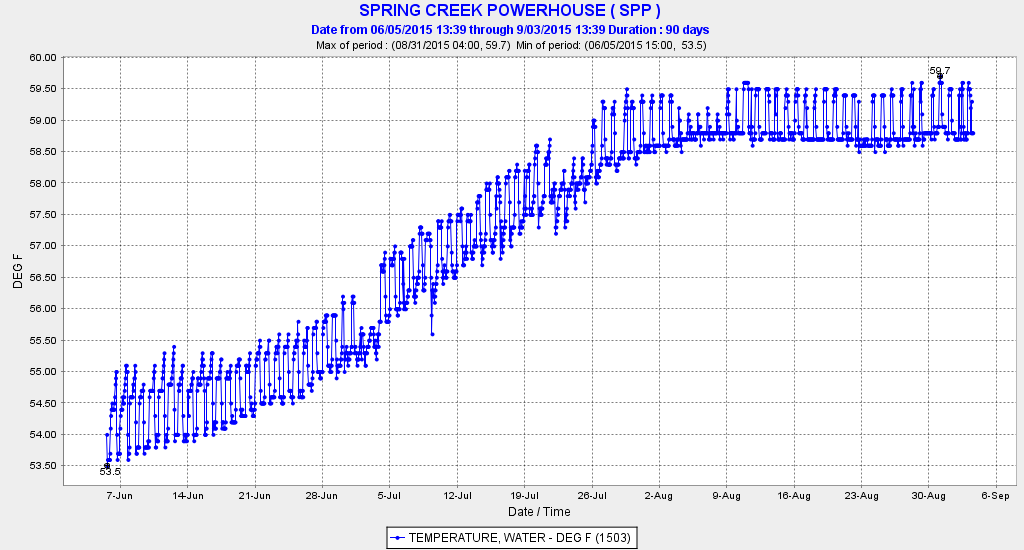
Figure 4. Water temperature in Spring Creek Powerhouse June to September 2015.
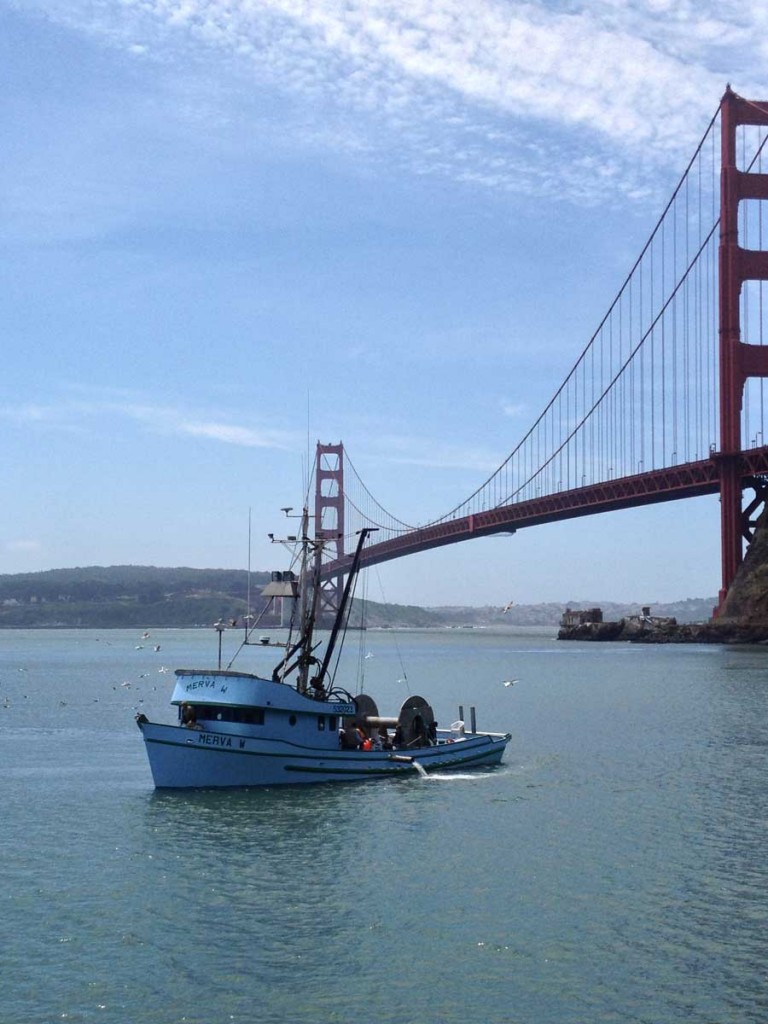
 Figure 1. Record low indices for Jan-Feb 2016 in Kodiak Trawl Survey