
In an April 10, 2017 post, I described a sharp decline in the Klamath River salmon runs after the 2012-2015 drought. In that post, I also noted the high relative contribution of the Shasta River run to the overall Klamath run, especially in the past six years. The recent upturn in the Shasta River run and its greater contribution to the overall Klamath run is likely a consequence of efforts by the Nature Conservancy and others to restore the Big Springs Complex of the upper river near Weed, Ca.
The Shasta run has increased measurably since 2010 (Figure 1). Cattle were excluded from Big Springs Creek in 2009, and flows, water temperature and juvenile Chinook densities were markedly improved in and below Big Springs Creek.1 The improved juvenile salmon production likely contributed to greater runs from 2011-2015 and to a higher than expected 2016 run given the 2013-2014 drought (Figure 2). The improvement in the Shasta run bodes well for the Shasta and Klamath runs (Figures 3 and 4). The Shasta run recovery is key to sustaining and restoring the Klamath run and coastal Oregon and California fisheries that depend on the Klamath’s contribution. The Shasta River’s spring-fed water supply comes from the Mt. Shasta volcanic complex. This water supply is resilient to drought and climate-change. The reliability of the Shasta River’s water supply makes the Shasta River’s contribution to Klamath salmon runs particularly important.
Restoration of the Shasta River and recovery of its salmon and steelhead populations has only just begun. Further improvements to the Big Springs Complex, especially to its spring-fed water supply (Figure 5) and to its spawning and rearing habitat, are planned. There is also much potential to improve habitat above the outlet of Big Springs Creek, both in the Shasta River and Parks Creek. There is further potential for habitat restoration in downstream tributaries (e.g., Yreka Creek and Little Shasta River). Reconnection of the upper Shasta River above Dwinnell Reservoir to the lower river would restore many miles of historic salmon and steelhead producing habitat.2 These improvements could make it is possible for the Shasta River to once again produce over half the “wild” (non-hatchery) salmon of the Klamath River.
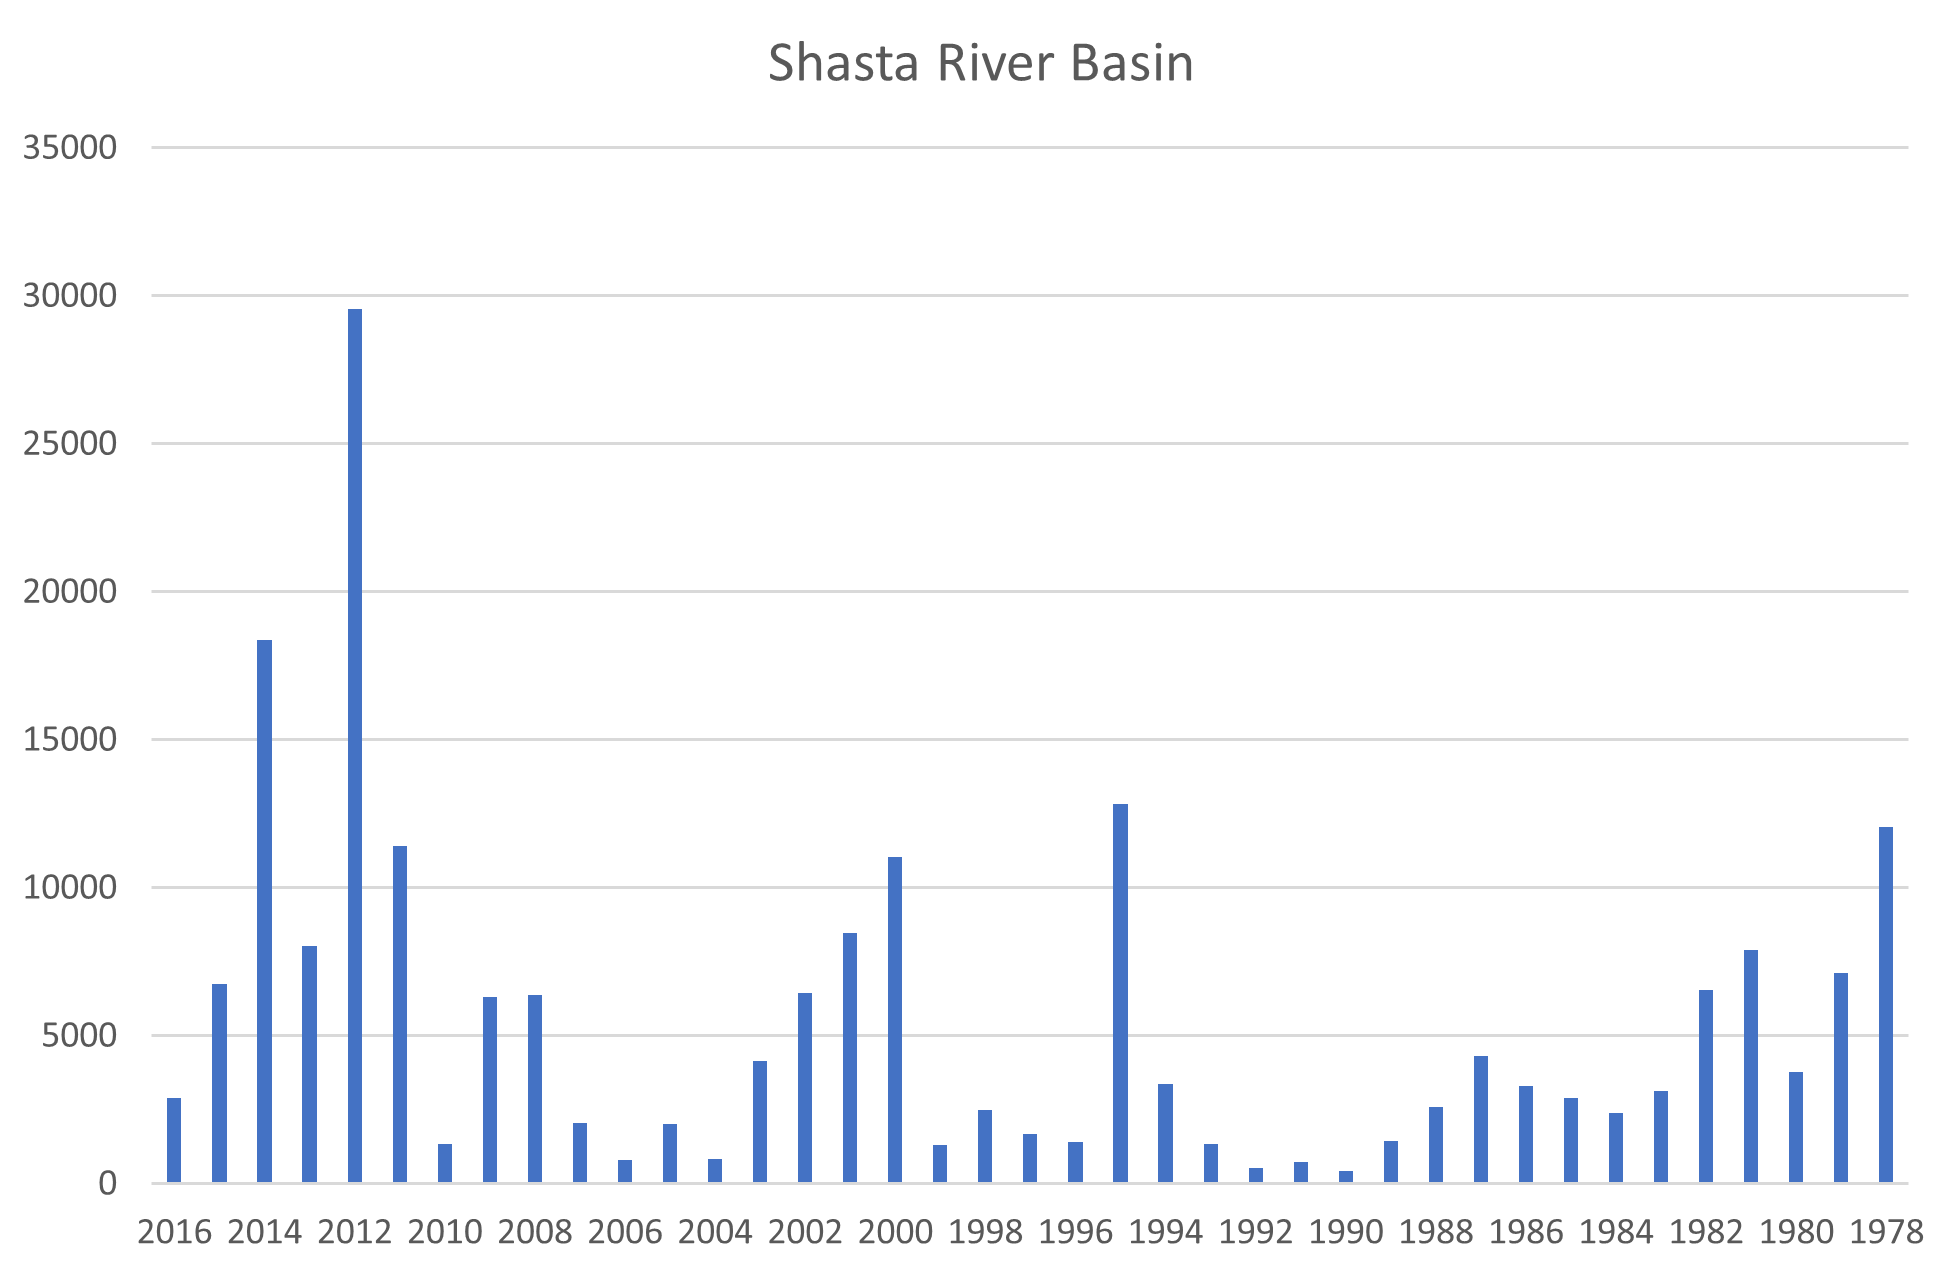
Figure 1. Fall-run Chinook salmon escapement (spawning run) estimates for the Shasta River from 1978 to 2016. Data Source: CDFW GrandTab.

Figure 2. Mean annual Shasta River streamflow (cfs) as measured at Yreka, CA. Source: USGS. Designated water-year types in this figure are the author’s estimates.
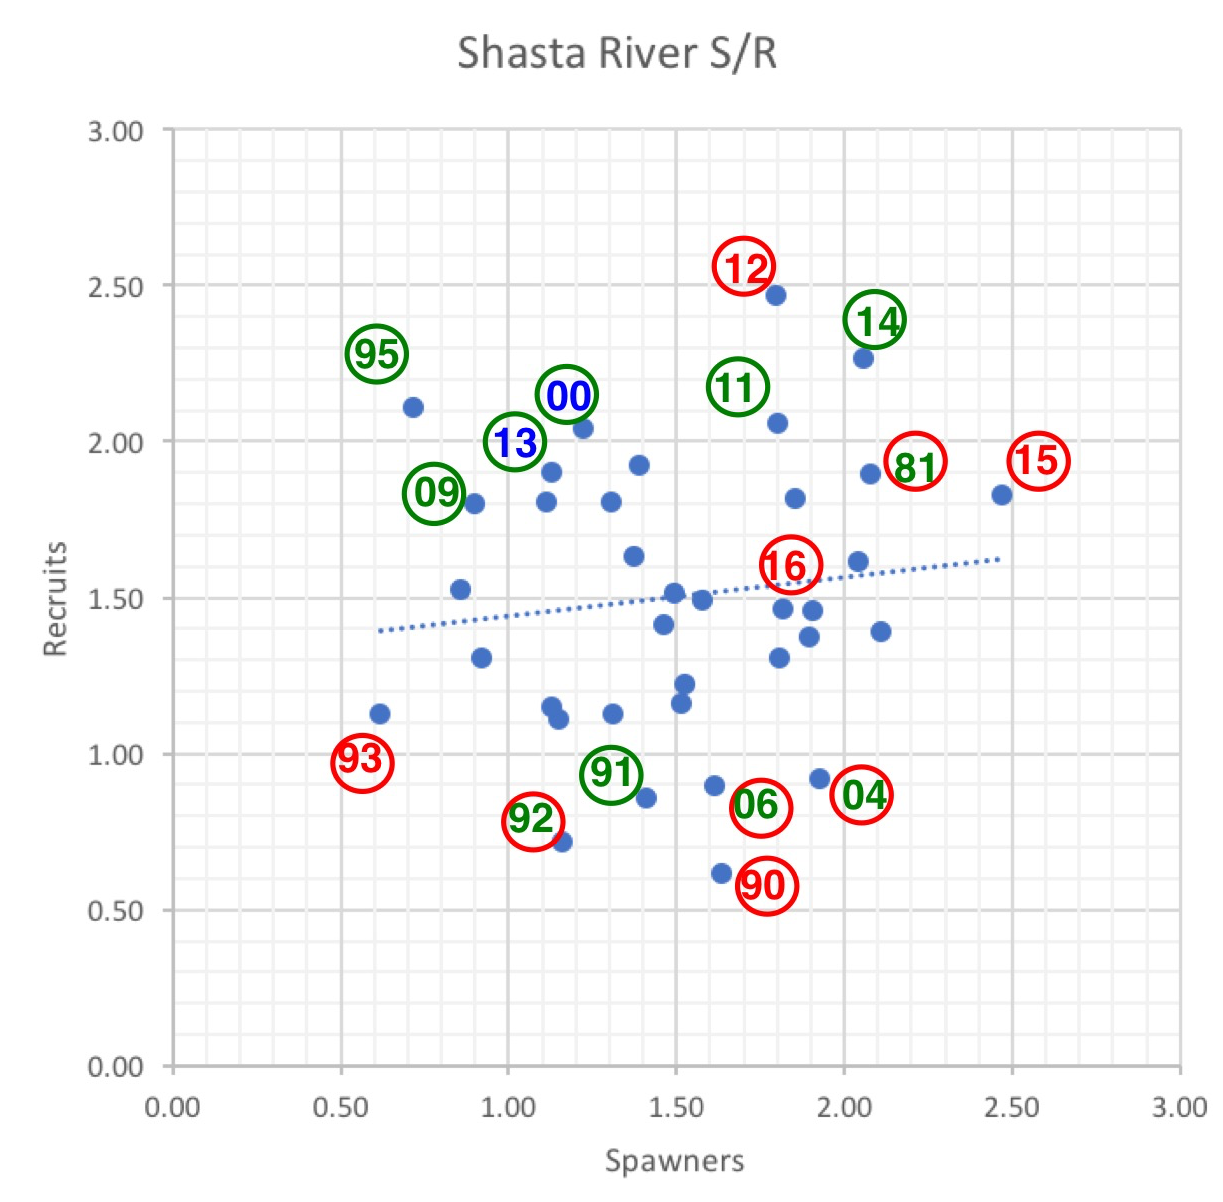
Figure 3. Spawner-recruit relationship for Shasta River. Escapement estimates (log10X – 2 transformed) are plotted for recruits by escapement (spawners) three years earlier. Year shown is recruit (escapement) year. The number is the year that fish returned to the Shasta River to spawn. The color of the number depicts the water-year type in the Shasta River during the year the recruits reared. The color of the circle depicts the water-year type in the Klamath River during the year the recruits reared. Blue is for Wet water-year types. Green is for Normal water-year types. Red is for Dry water-year types. Example: 90 depicts fish that returned to the Shasta River as adult spawners in 1990. These fish were spawned in 1987 and reared in winter-spring 1988. The red number shows that the 1988 rearing year was a Dry water year in the Shasta River; the red circle shows that the 1988 rearing year was a Dry water year in the Klamath River. Note very poor recruits per spawner in 1990-1993 drought period, compared with relatively high recruits per spawner from 2011-2016, even though the latter period included the 2012-2015 drought.

Figure 4. Estimates of fall-run Chinook salmon escapement for the Klamath River, 1978-2016. Data Source: CDFW GrandTab.
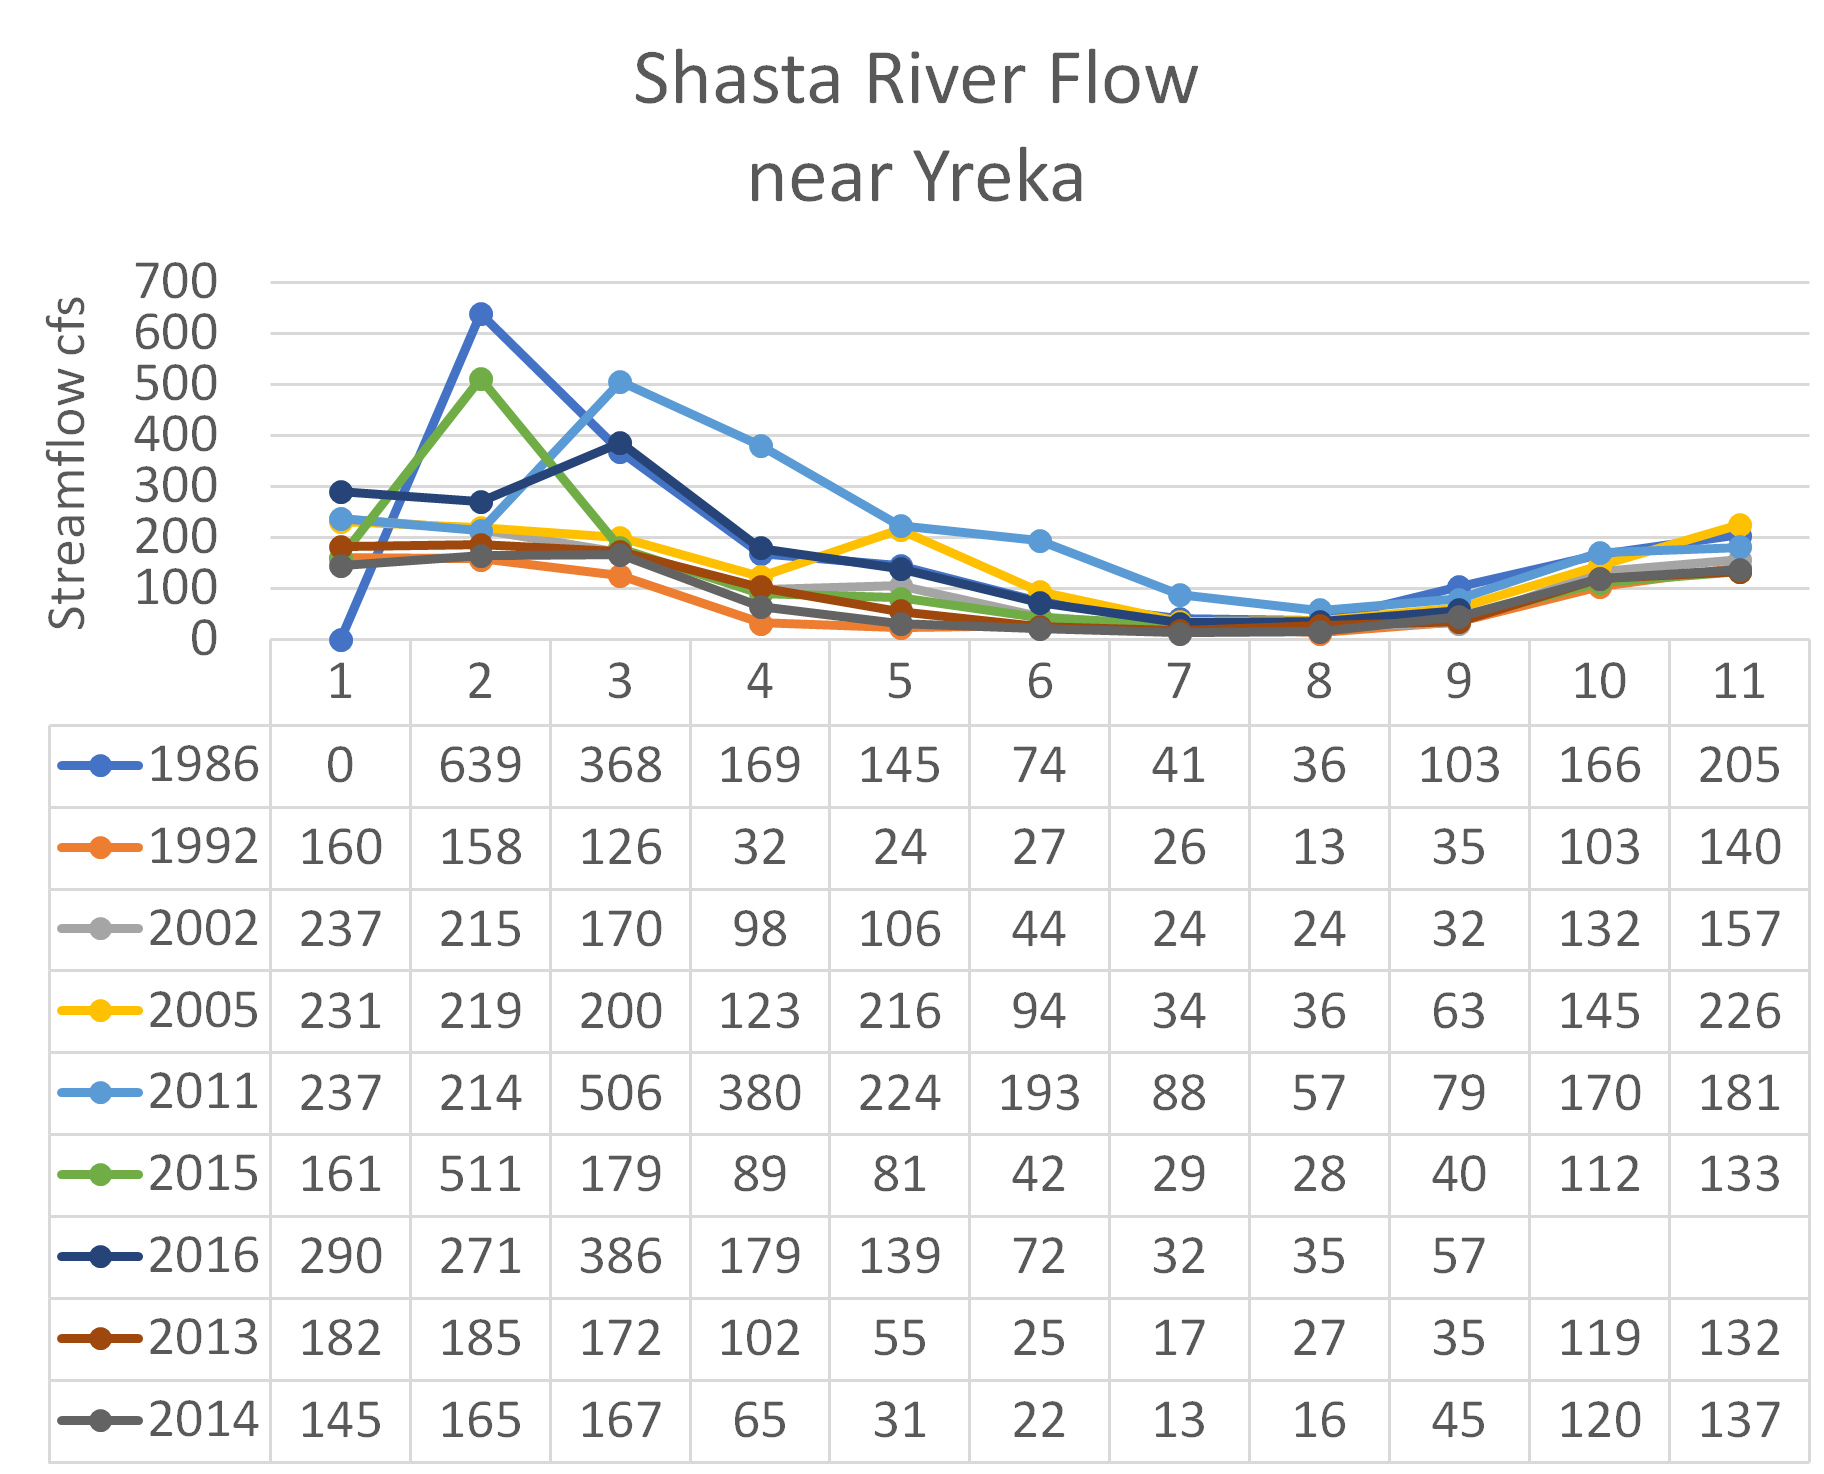
Figure 5. Examples of Shasta River monthly average flows as measured at the lower end of Shasta Valley. Streamflow is low from late spring through summer because of surface and groundwater irrigation demands. October flows are higher because the irrigation season (and season of diversion under some water rights) ends on September 30. Data source: USGS Yreka gage.