
72-75oF is too warm for native fishes in the Delta. In drought years, we are not surprised when the Delta is too warm in summer, particularly when the State issues emergency drought orders that allow low Delta inflows and outflows. But we do not expect the Delta to be warm in summer of wet years like the three latest 2017, 2019, and 2023 (Figures 1 and 2). Water temperatures were not that warm back in wet year 2011 or in recent decades 1995-2004 (Emmaton) or 2001-2010 (Rio Vista) (Figures 1 and 2).
What is causing the high summer Delta water temperatures? Part of the cause is low Sacramento River flows and associated high water temperatures coming into the Delta. Available streamflow and temperature data in the Sacramento River just above and at the entrance to the Delta for Wilkins Slough, Verona, and Freeport (Figure 3) clearly show this pattern. Summer flows in the lower Sacramento River at Wilkin Slough were particularly low in 2017 and 2023 (Figure 4), which led to higher Delta water temperatures (see Figures 1 and 2). Summer 2011 was the only year after 2010 that met the water quality standard of 68oF water temperature (Figures 5 and 6). Water temperatures at Wilkins Slough, Verona, and Freeport where the Sacramento River enters the Delta have the same consistent pattern (Figures 7 and 8) – water temperatures are too warm (>68oF) in summer.
It seems that the resource and water management agencies have simply written off the problem as purely a function of climate change/global warming. They should not.
When Valley air temperatures are high (near average daily 80oF), it takes flows up to 8,000-10,000 cfs in the lower Sacramento River to keep water temperatures down near 68oF (Figures 9-11). If lower Sacramento River flows at Wilkins Slough can be maintained at an average of about 8,000 cfs (range of 6,000-10,000 depending on air temperatures), the water temperature standard of 68oF (20oC) can more frequently be met (see Figure 4). Also, Delta water temperatures can more frequently be maintained below 72oF.
If this had been accomplished in the years after 2011, then smelt and fall-run salmon population crashes may have been less severe.
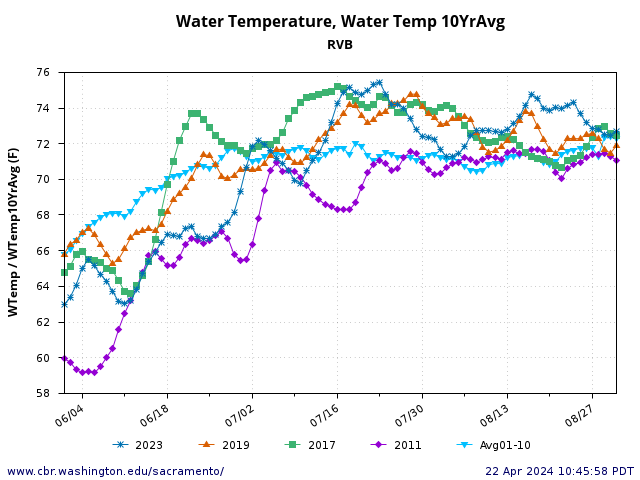
Figure 1. Water temperatures (average daily) at Rio Vista in north Delta from June through August of wet years 2011, 2017, 2019, and 2023 along with average for decade of 2001-2010.
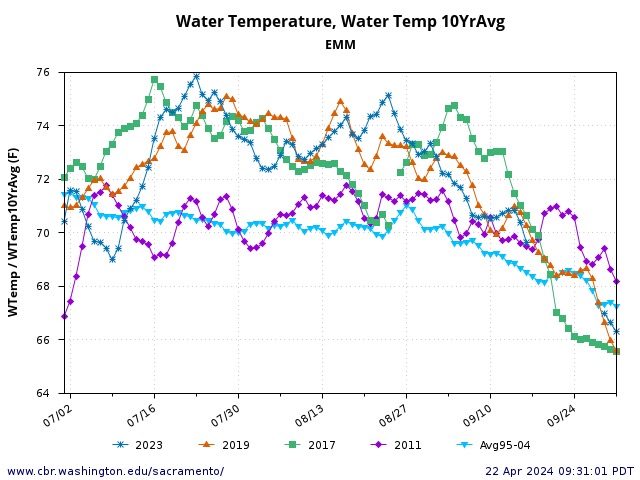
Figure 2. Water temperatures (average daily) at Emmaton in west Delta in June through August of wet years 2011, 2017, 2019, and 2023 along with average for decade of 1995-2004.
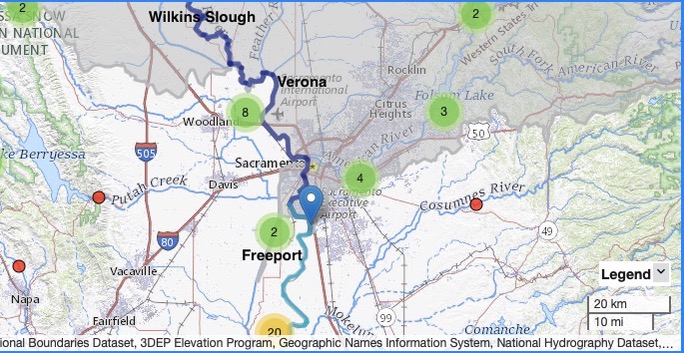
Figure 3. Three water temperature gage locations (in bold type) on the lower Sacramento River above and at the entrance to the Delta near Sacramento. Other gages also noted.
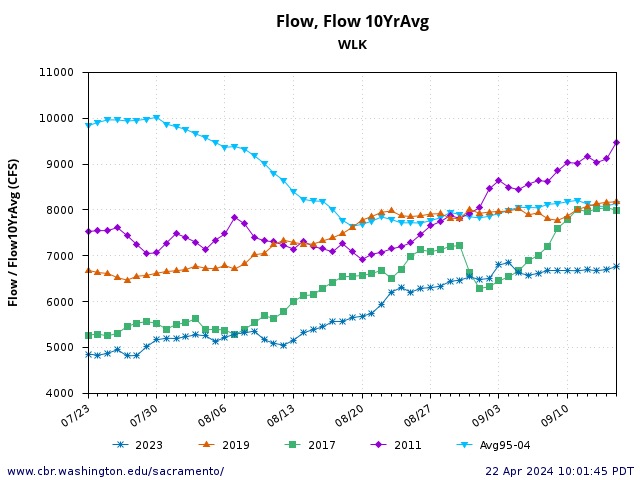
Figure 4. Stream flow (average daily) at Wilkins Slough in the lower Sacramento River upstream of the Delta in wet years 2011, 2017, 2019, and 2023 along with average for decade of 1995-2004. Note midsummer flows in 2023 and 2017 were only half the average of 1995-2004. Flows were higher in late summer in the four recent wet years to meet the Fall X2 requirement for wet years.
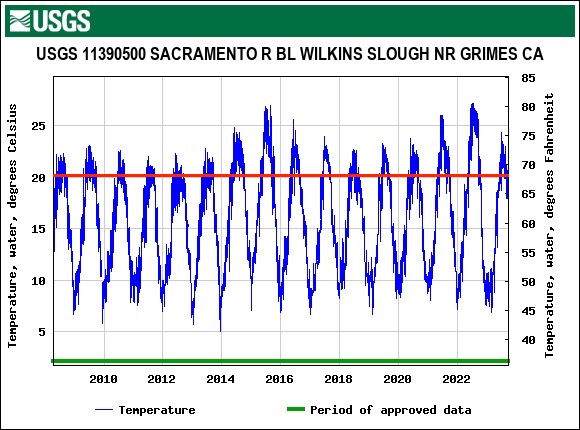
Figure 5. Water temperatures at Wilkins Slough in the lower Sacramento River in years 2008 to 2023 along with water quality standard (red line). The four warmest summers were critical drought years when water quality standards were relaxed because of limited available water supply.
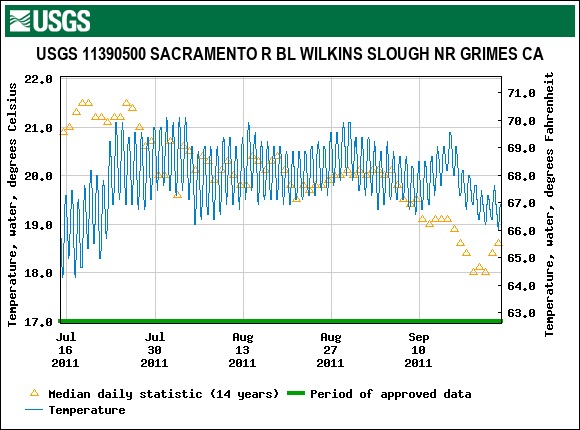
Figure 6. Water temperature (hourly) at Wilkins Slough in the lower Sacramento River in summer 2011 with average daily for previous 14 years. The water quality standard is 68oF average daily temperature. The standard was met in 2011 and in many of the years before that.
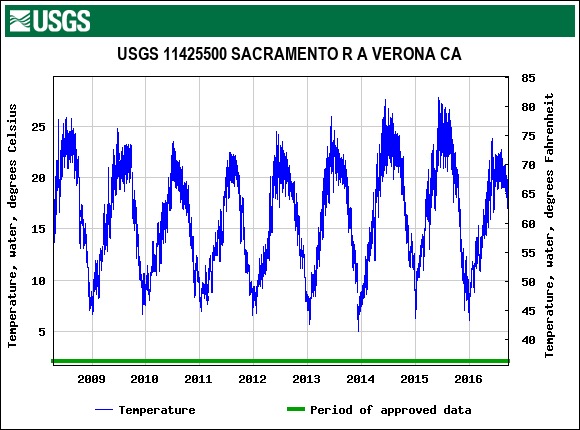
Figure 7. Available water temperature data at Verona in the lower Sacramento River in years 2008 to 2016. Water year 2011 was the only wet year in the sequence of available data from the Verona gage.
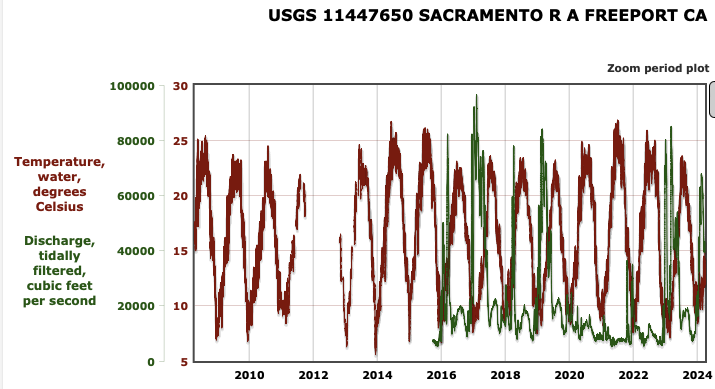
Figure 8. Water temperature and river flow (average daily) in Sacramento River at Freeport in north Delta 2008-present.
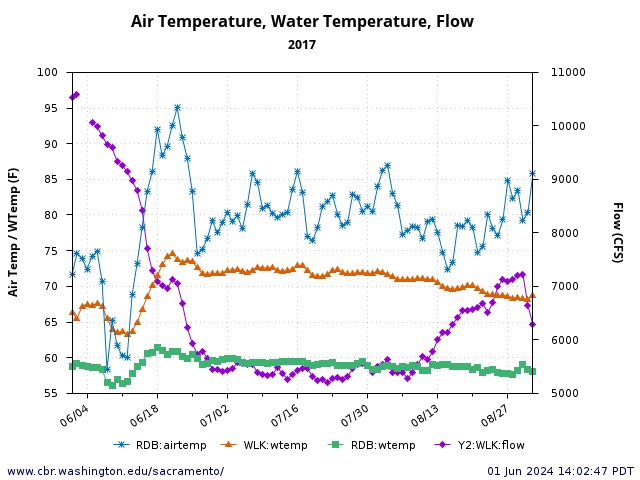
Figure 9. Red Bluff air and water temperatures (average daily) with Wilkins Slough streamflow and water temperatures (average daily) in summer of wet year 2017. The 68ºF water temperature standard could not be met under the midsummer <6000 cfs level of flow. It took flows of nearly 8000 cfs in the mid-June heat wave to maintain 68ºF. Late August flows near 7000 cfs were able to bring water temperatures again near 68ºF.
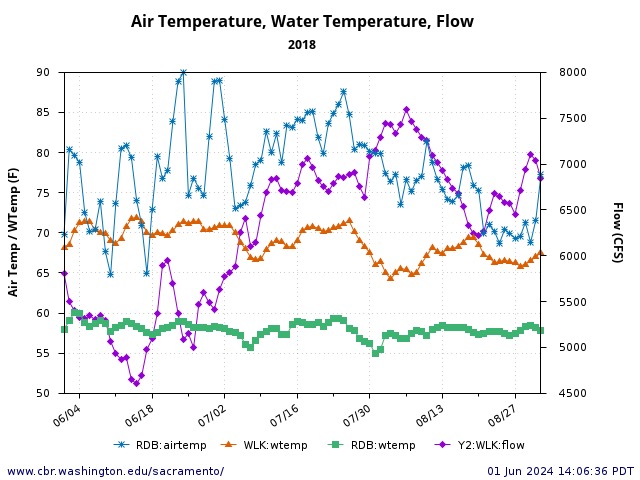
Figure 10. Red Bluff air and water temperatures (average daily) with Wilkins Slough streamflow and water temperatures average daily) in summer of Below Normal water year 2018. There were concerted efforts on the part of Reclamation and its partners to maintain the water temperature standard in summer 2018 after wet year 2017. First, the early summer pulse of 6000 cfs followed by sustained flows near 7000 cfs. The early August 7500 cfs pulse and cooler air brought water temperatures down to 65ºF. Subsequent flow reductions to 6000 cfs were able to maintain the 68ºF standard with the cooler air temperatures.
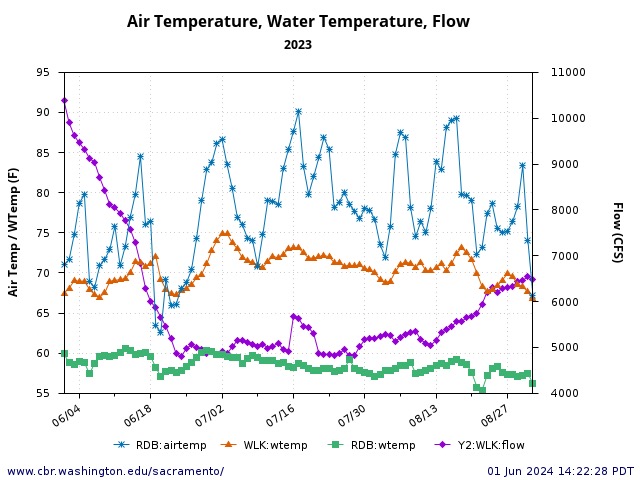
Figure 11. Red Bluff air and water temperatures (average daily) with Wilkins Slough streamflow and water temperatures (average daily) in summer 2023. Midsummer streamflows <6000 cfs were unable to sustain water temperatures below 70ºF. Cooler air and 5200 cfs briefly brought water temperatures below 70ºF at the beginning of August. Cooler air and sustained flows near 6000 cfs maintained water temperatures below 70ºF in late August.