In April 30, 2017 post on longfin smelt, I wrote that it appeared that longfin were making a comeback after the 2012-2015 drought. In this post I compare the 2017 comeback to those in the two previous wet years, 2006 and 2011.
First: The number of adult longfin smelt collected in the December 2017 trawl survey (Figure 1) was substantially less than the number collected in the December 2011 survey (Figure 2).
Second: The number (density) of larval longfin smelt collected in the late January 2018 larval fish survey (Figure 3) was substantially less than the number collected in the late January 2012 survey (Figure 4).
Third: The 2017 index, though higher than the dry years that immediately preceded 2017 and indicative of some recovery, remained below the recent wet years (06, 11) and continued a long-term trend of progressively lower indices (Figures 5 and 6).
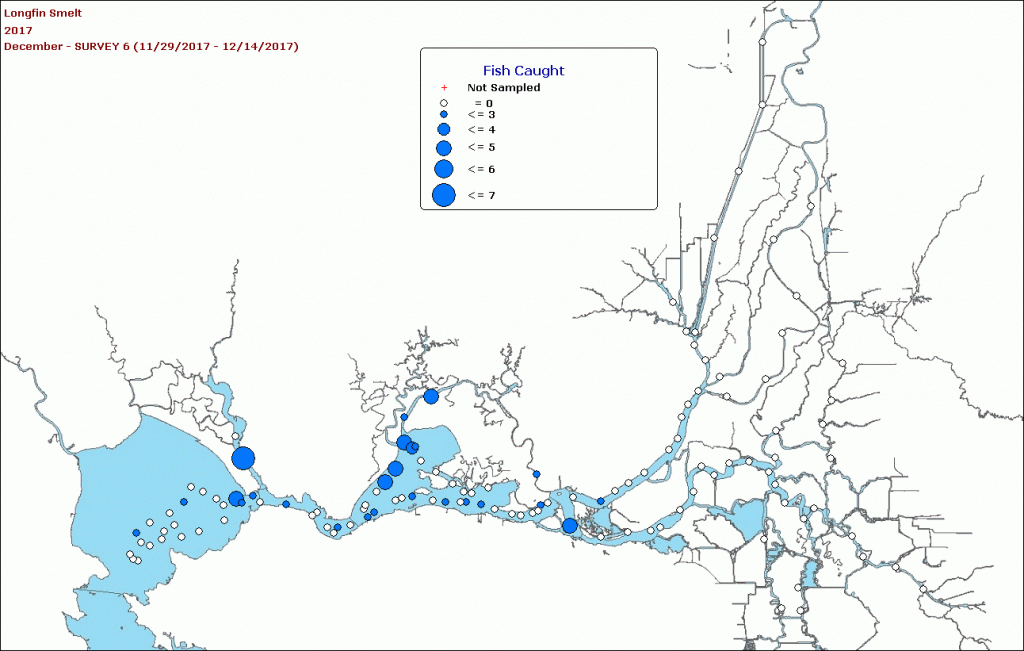
Figure 1. Catch distribution of adult longfin smelt in the December 2017 trawl survey. Source: CDFW survey online report.
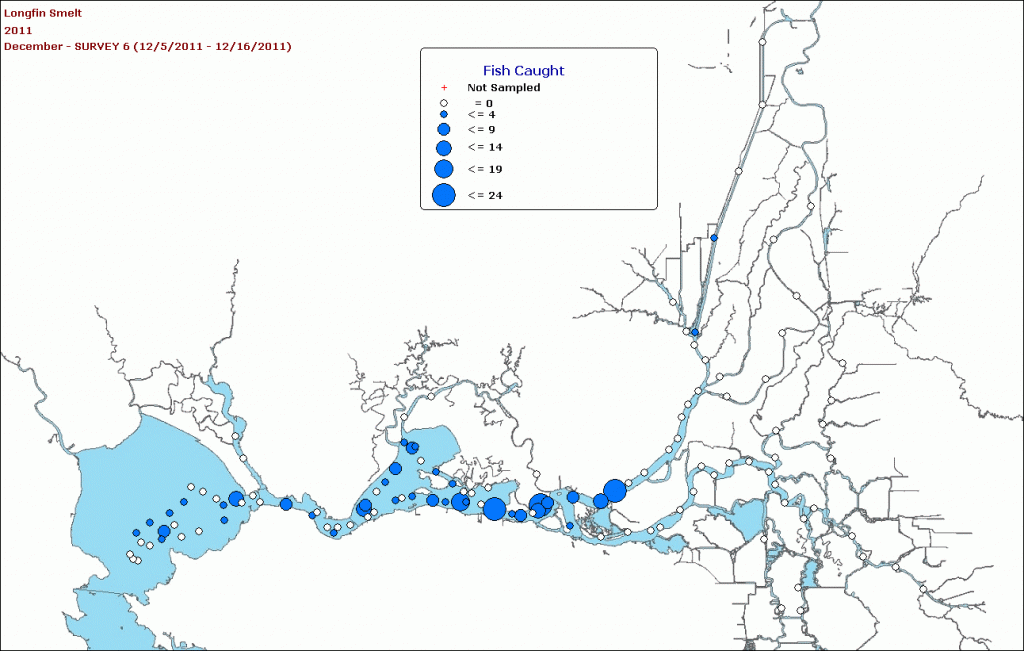
Figure 2. Catch distribution of adult longfin smelt in the December 2011 trawl survey. Source: CDFW survey online report.
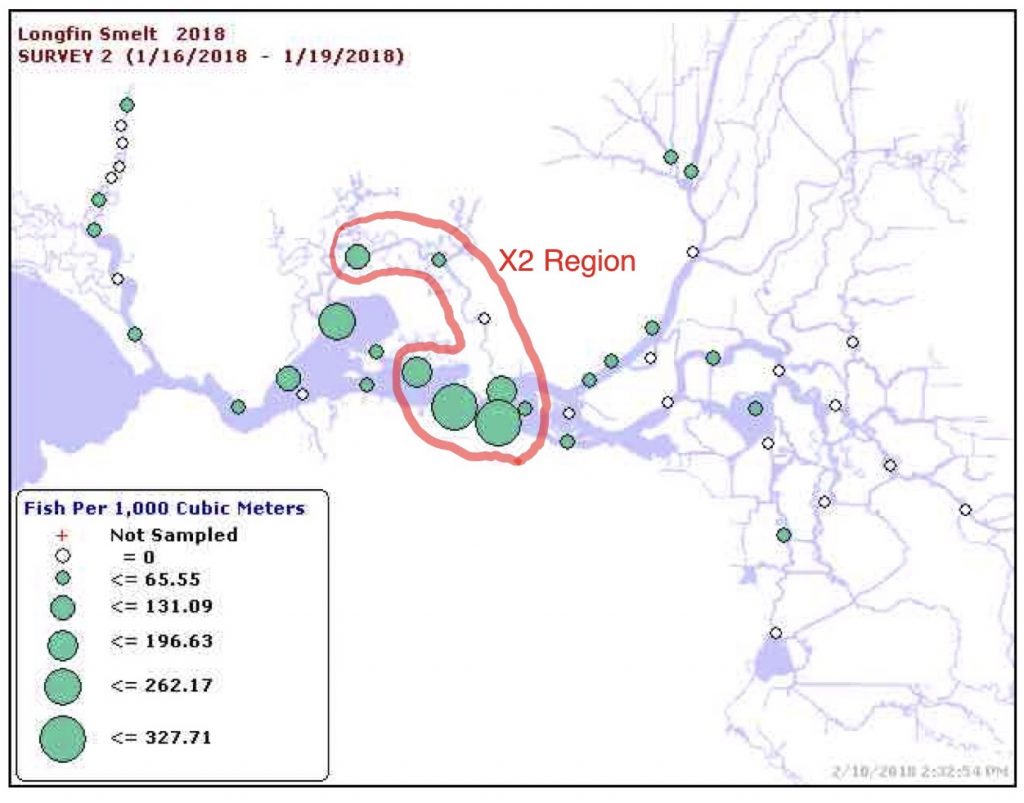
Figure 3. Catch distribution of larval longfin smelt in the late January 2018 larval fish survey. Source: CDFW survey online report.
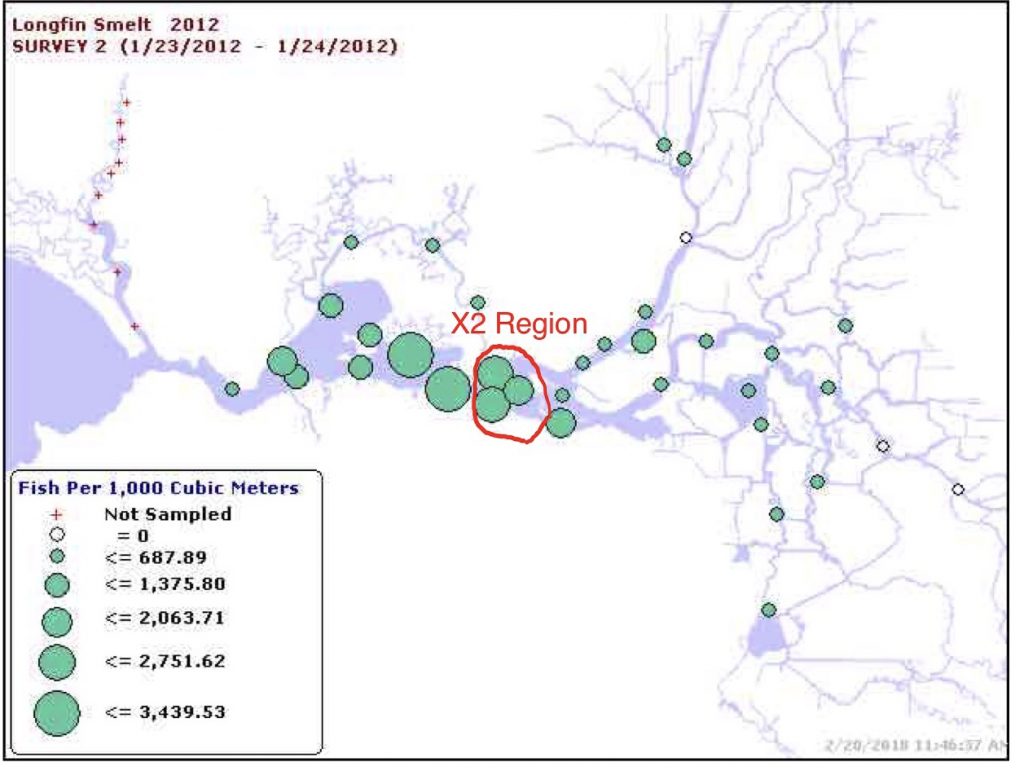
Figure 4. Catch distribution of larval longfin smelt in the late January 2012 larval fish survey. Source: CDFW survey online report.
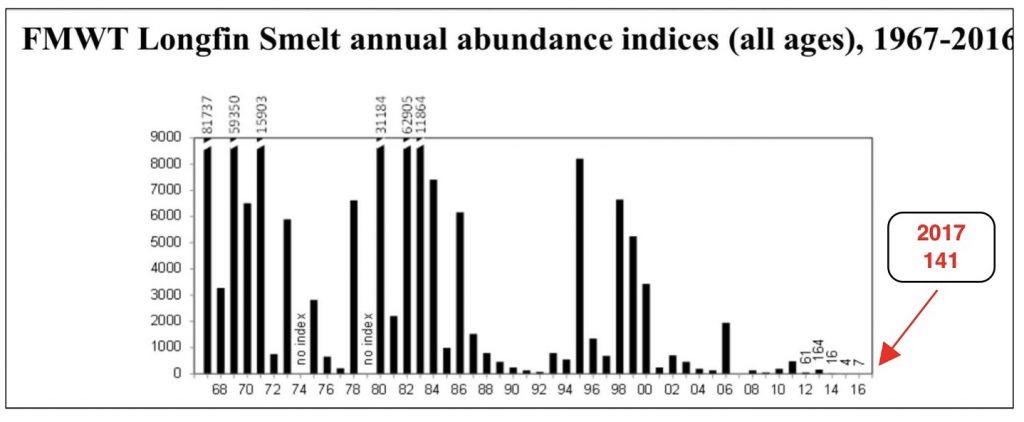
Figure 5. Fall Midwater Trawl Index for Longfin Smelt, 1967-2017. Source: CDFW FMWT Survey.
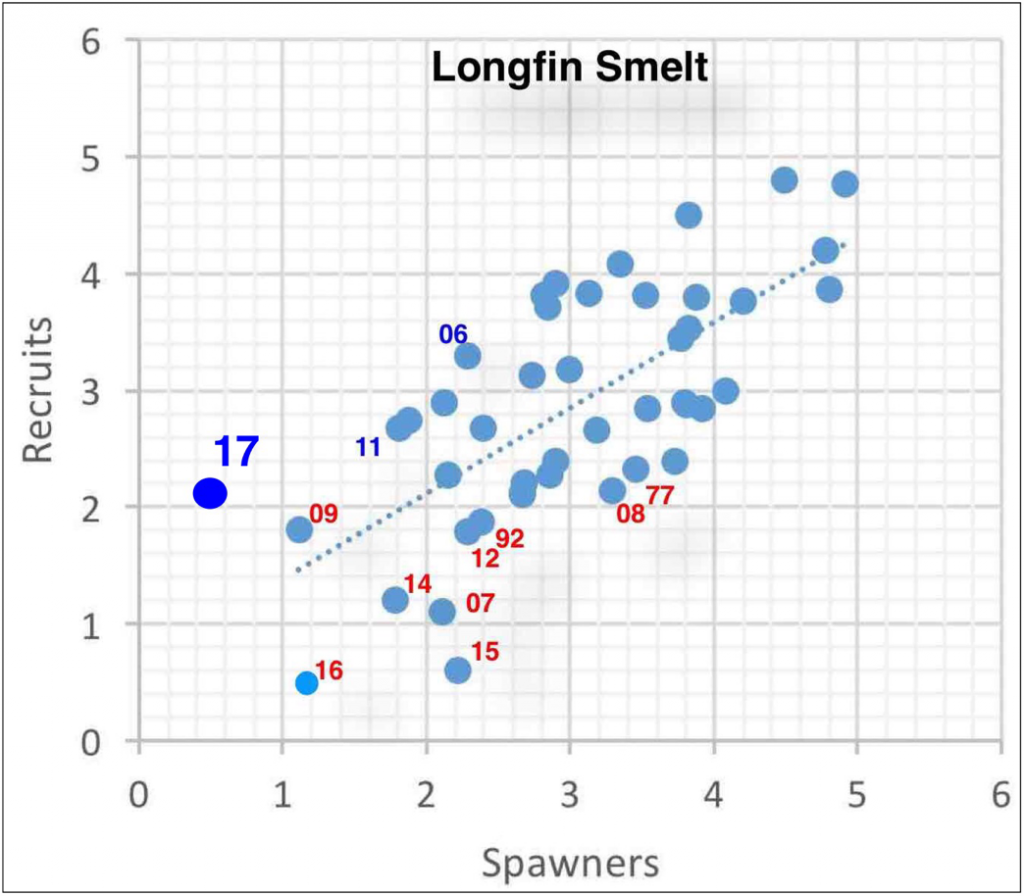
Figure 6. Longfin Recruits (Fall Midwater Trawl Index) vs Spawners (Index from two years prior) in Log10 scale. Note the progressive decline in recruits in the last three wet years (06, 11, 17). The relationship is very strong and highly statistically significant. Taking into account Delta outflow in winter-spring makes the relationship even stronger. Recruits per spawner are dramatically lower in drier, low-outflow years (red years). Source: http://calsport.org/fisheriesblog/?p=1360 .
