The winter-run Chinook salmon population crashed around 1980 and has not recovered (Figure 1). The population started coming back from 2001-2006 but fell to 827 in 2011. It remained in the 1500 to 6000 range from 2012-20161 with the help of the Livingston Stone federal hatchery near Redding. Hatchery fish make up an increasing proportion of the population each year.
In a 2011 review, NMFS attributed the general population decline to “blockage of access to historic habitat, other passage impediments, unscreened water diversions, heavy metal pollution from mine runoff, disposal of contaminated dredge sediments in San Francisco Bay, ocean harvest, predation, drought effects, juvenile losses at the CVP and SWP Delta pumping facilities; and elevated water temperatures in spawning grounds.” Droughts and the loss of cold water pool in Shasta are generally considered the primary cause of the decline over the past four decades starting with the 1976-1977 drought. The decline continues despite “reduced harvest impacts, Iron Mountain Mine clean up, screening of water diversions, altered CVP water operations that improve passage and reduce predation, and construction of a temperature control device on Shasta Dam”.
A range of actions is being implemented to help recover this NMFS-designated “Species in the Spotlight.” The problem is the actions do not include the one key factor that was a major cause of the original decline and the primary cause of the lack of recovery: high late-fall and early-winter Delta exports cause high juvenile salmon mortality in the Delta.
The problem starts from the fact that winter-run juveniles leave the upper Sacramento River rearing area for the Bay-Delta and eventually the ocean with the first fall or early winter rains that produce flow pulses from undammed Sacramento River tributaries. These same untamed flows are also a primary target of the state and federal export facilities in filling south-of-Delta storage depleted from the summer. Delta exports have few restrictions in fall. The allowed export-to-inflow ratio is 65% (compared to 35% in winter-spring). There are no OMR limits. Interior Delta flows caused by high exports reach -10,000 cfs, compared to -5000 cfs in winter-spring. The Delta Cross Channel is usually open through the fall and closed in winter, allowing salmon to move from the Sacramento River to the interior Delta more easily in fall. Higher fall exports are also a consequence of increasing winter-spring protections (in water quality control plans and endangered fish biological opinions) for fish that led to reduced exports in those seasons. Fundamentally, higher fall exports were a result of the state export facilities coming on line in the mid-1970s, which increased the export capacity from 4,400 cfs to 15,000 cfs.
One need only look at the increase in fall export rates and juvenile salmon salvage in the south Delta to see the association with the decline of winter-run. Figure 2 shows CVP exports in 1984-1985 compared with the historical average. Figures 3 and 4 show fall exports in the example years. Figure 5 shows fall 2016 exports and Delta inflow, which is compelling proof that the problem continues.2 Figure 6 shows high negative Old and Middle River (OMR) flows caused by high exports. Figure 7 shows December Chinook salmon salvage at south Delta fish facilities. Further evidence of the association between fall exports and the decline of winter-run is available in the long-term fish salvage data that dates back to the 1970s historical period depicted in Figure 1. Further discussion on the risk of high fall and early winter risks to salmon from exports is presented in http://calsport.org/fisheriesblog/?p=1949 .
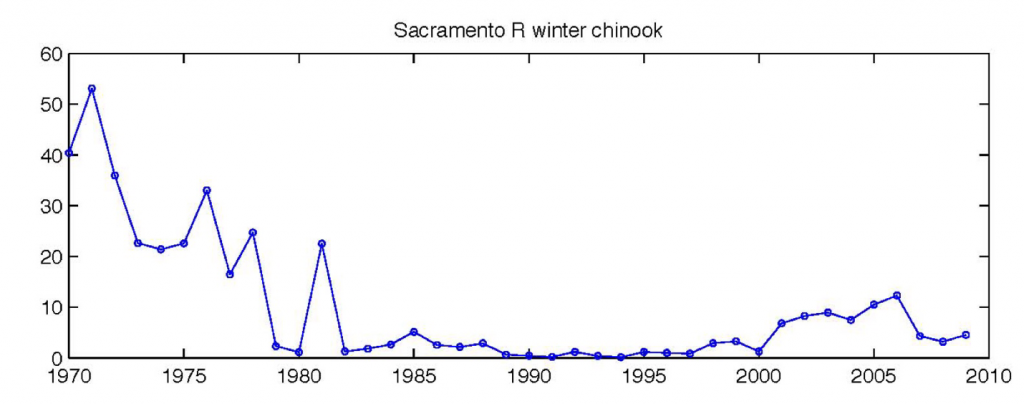
Figure 1. Trend in winter-run salmon escapement to the Sacramento River below Shasta Reservoir 1970-2009 in thousands of adult salmon. Source

Figure 2. Tracy (federal) export rate in 1984-1986, with mean daily export rate 58-year average. Note marked increase in Nov-Dec period over historical average.
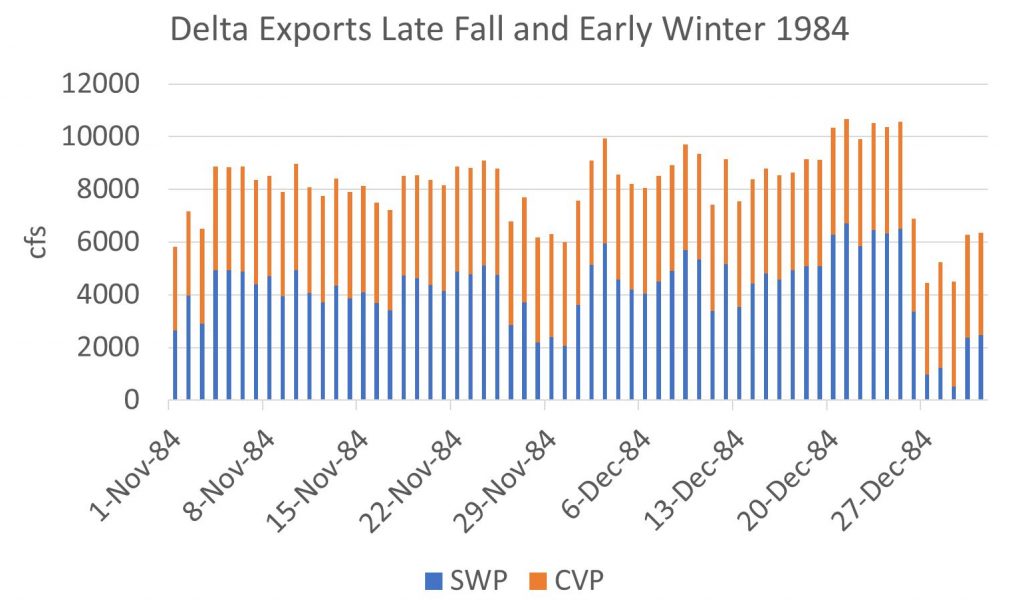
Figure 3. Federal and state export rates in fall 1984.
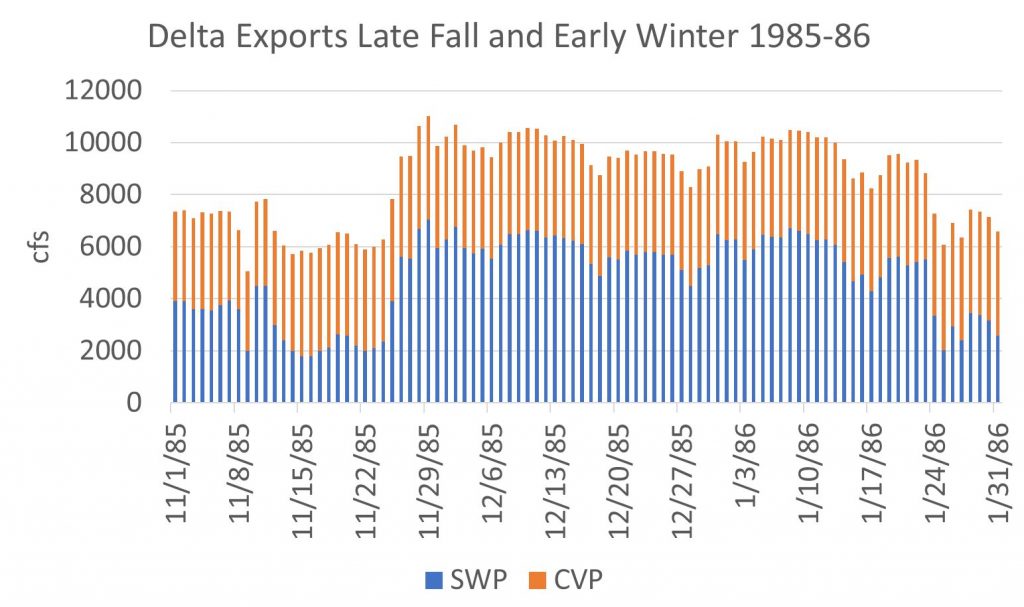
Figure 4. Federal and state export rates in fall 1985.
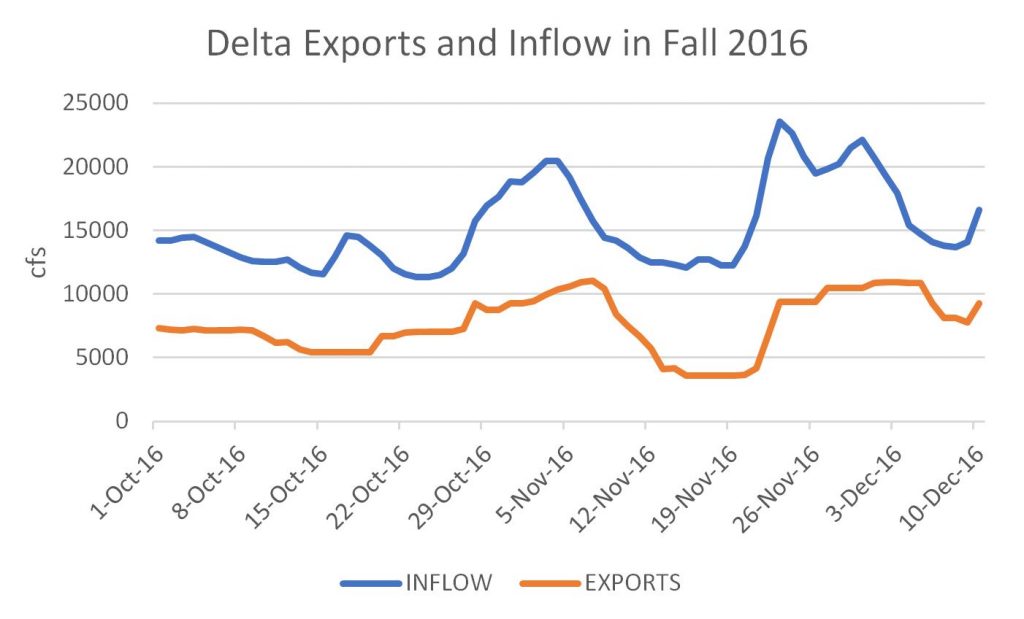
Figure 5. Delta export and inflow rates in fall 2016.
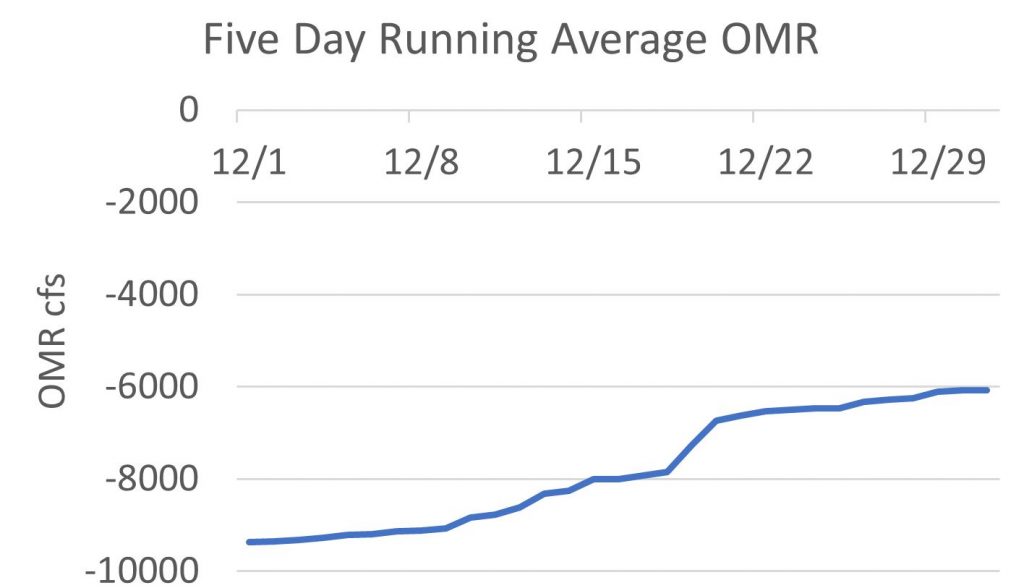
Figure 6. OMR December 2016.
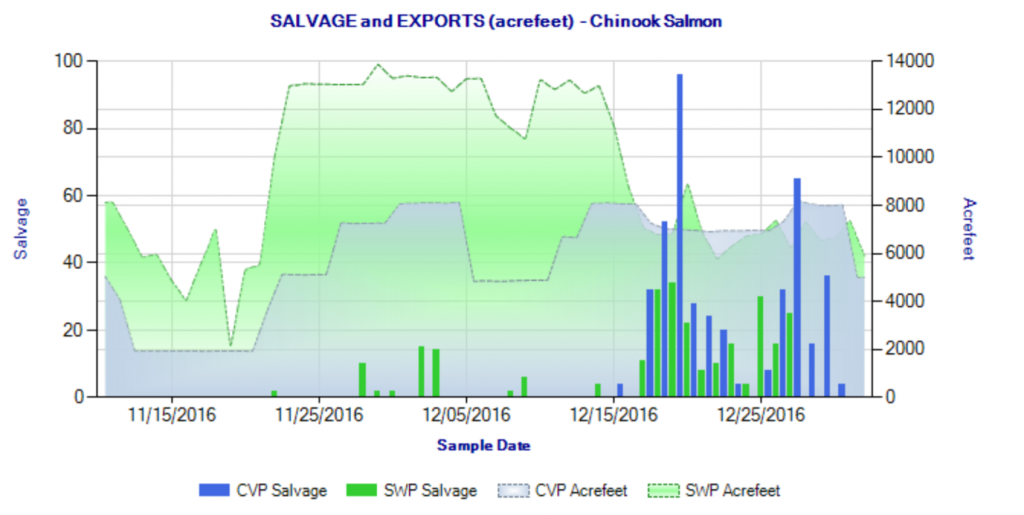
Figure 7. Chinook salvage fall 2016.
- https://nrm.dfg.ca.gov/FileHandler.ashx?DocumentID=84381 ↩
- Exports were greater than 10,000 cfs from 11/19/17 to 12/8/17. ↩
