
Based on early indicators, it appears that salmon populations in the Central Valley are in critical condition. First, there was poor smolt production from the 2014 and 2015 drought-year salmon runs in the Central Valley. That led to last fall’s (2017) runs being so poor that Coleman Hatchery had to get eggs from state hatcheries on the Feather and American rivers to meet its needs.1 CDFW believes poor ocean conditions have led to low adult salmon numbers for 2018 fisheries and runs. The weak runs may eliminate 2018 salmon fisheries. 2
The evidence based on initial surveys is that brood year 2017 salmon (born last summer and fall) fry-smolt production was extremely poor. First, lower Sacramento River screw trap catches are low in early 2018 compared to 2017 (Figures 1 and 2). Winter screw trap catch-per-trap-day (and Sacramento trawl catch not shown) in the lower Sacramento River in 2018 are only 2% of 2017. Note flows and turbidities were very low in 2018 compared to 2017. I warned that these conditions with warmer water would lead to slower migration rates, starvation, and high predation by stripers. Second, salmon salvage at the south Delta pumping plants has been extremely low in 2018 (Figure 3) compared to 2017 (Figure 4). Salvage is a strong indicator of relative abundance. Third, compared to historical levels (Figure 5), salvage numbers in 2018 are two orders of magnitude lower than in 1999 when salmon runs were last strong.
You can blame the problem on the 2012-2016 drought, poor ocean conditions, or poor river-Delta flow management as I do. Whatever the cause, strong measures are needed to recover the salmon populations. Without strong measures, future brood year production will be so low there will be few salmon and no salmon fishing.
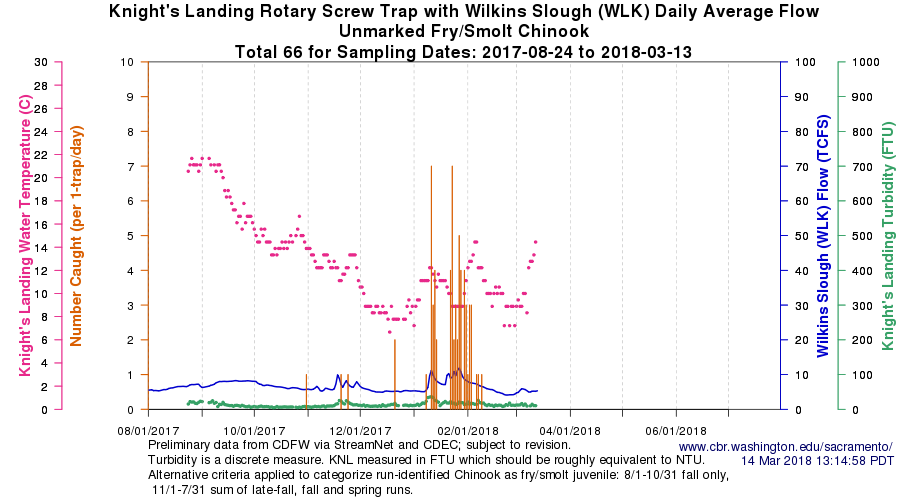
Figure 1. Knights Landing screw trap catch Aug 2017 to Mar 2018.
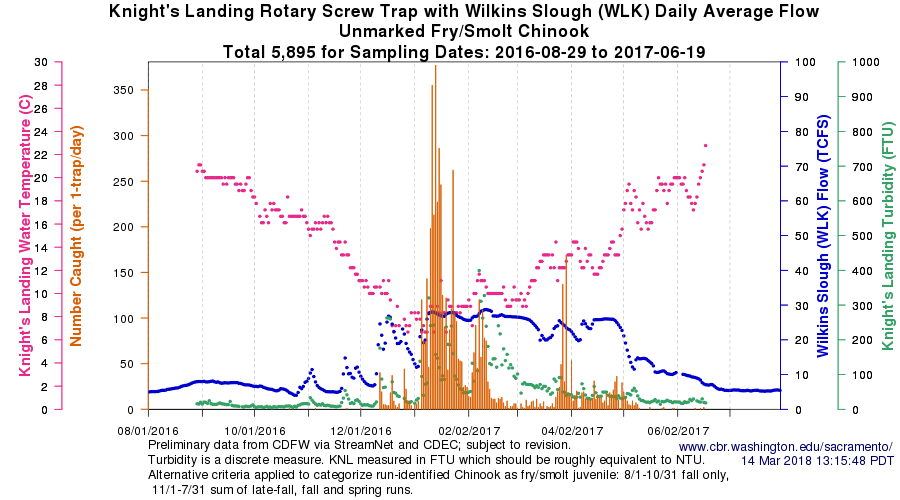
Figure 2. Knights Landing screw trap catch Aug 2016 to Aug 2017.
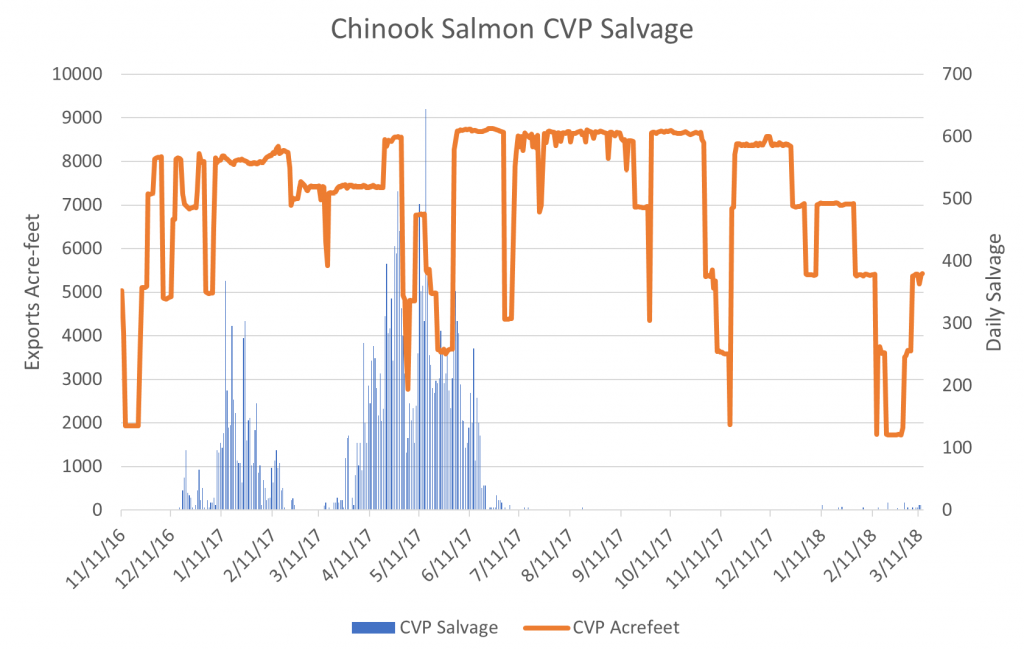
Figure 3. Chinook salmon salvage at CVP fish facilities in south Delta Nov 2016 to March 2018, along with export rate at Jones Plant. Note very small, nearly unperceivable numbers in winter 2018.
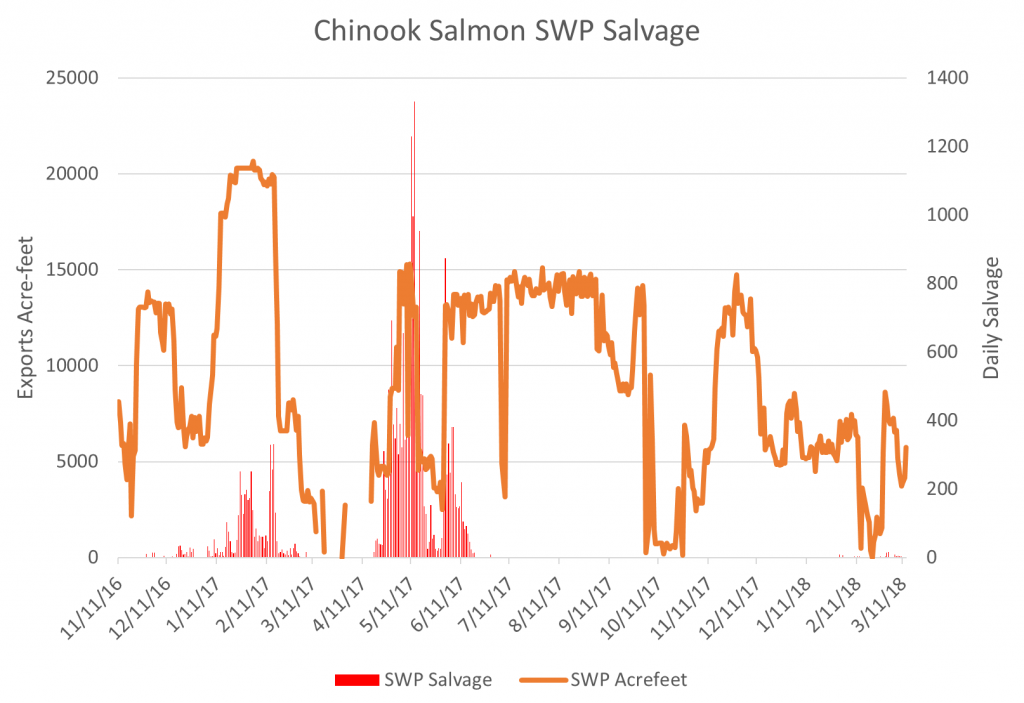
Figure 4. Chinook salmon salvage at SWP fish facilities in south Delta Nov 2016 to March 2018, along with export rate at Clifton Court. Note very small, nearly unperceivable numbers in winter 2018.
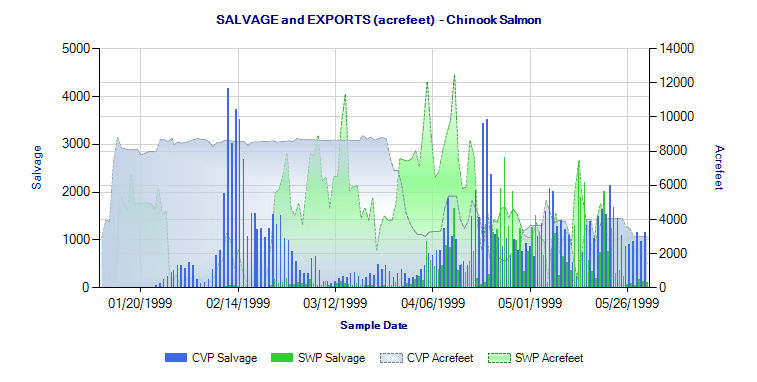
Figure 5. Chinook salmon salvage at CVP and SWP fish facilities in south Delta Jan 1999 to June 1999, along with export rate at south Delta pumping plants.
- http://calsport.org/fisheriesblog/?p=1958 Poor 2017 run http://www.usafishing.com/sac.html https://cdfgnews.wordpress.com/2018/03/01/californias-drought-poor-ocean-conditions-impact-salmon-forecast-for-2018/ ↩
- http://www.mailtribune.com/news/20180305/weak-sacramento-river-chinook-run-could-hurt-eliminate-ocean-salmon-seasons ↩