Federal and State hatcheries released 32 million juvenile salmon into the Central Valley, the Bay-Delta, and nearby coastal waters in 2019. The hatchery programs included spawning and rearing salmon from all four salmon races: fall-run, late–fall-run, winter-run, and spring-run. The hatchery programs have come a long way through decades of adaptive management, but some lessons were not learned. In this post I summarize and discuss the release strategies in 2019 of the seven hatchery programs. In most cases, release strategies were good for smolt survival. Some releases were made into poor flows and high water temperature conditions that would contribute to poor survival from slowed migration, heat stress, starvation, or high predation rates.
Federal Coleman National Fish Hatchery on Battle Creek (Sacramento River)
The Coleman Hatchery released 11 million salmon to the Sacramento River and its major upper river tributary Battle Creek in 2019 (Figure 1). All but the 176,128 released to the Sacramento River near Redding were released at the hatchery into lower Battle Creek. All the fall-run were from brood year 2018 (spawned in fall 2018). The total late-fall-run release for brood year 2018 was 830,000 including 73,952 released in January 2019, with the remainder released in Nov-Dec 2018.
The Coleman hatchery continues to struggle with problems/conflicts associated with making releases too early or too late in the season. Early release of younger smaller pre-smolts has led to poor survival and return rates. Late releases can be a problem because of low flows and high water temperature in the lower Sacramento River (Figure 2). The early 2019 releases could have been made later in April, and the early May release could have been supported by a flow pulse from a near-full Shasta Reservoir in this near-record-high storage year.
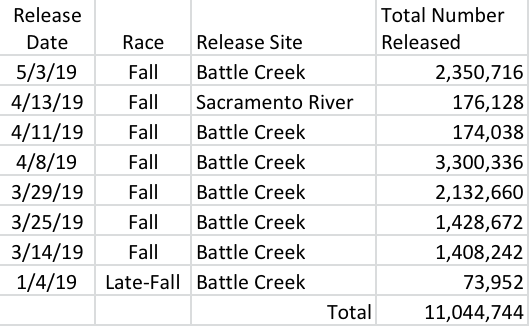
Figure 1. Summary of Coleman NFH releases in 2019. Note 755,416 late-fall-run smolts from brood year 2018 were also released into Battle Creek in Nov-Dec 2018.
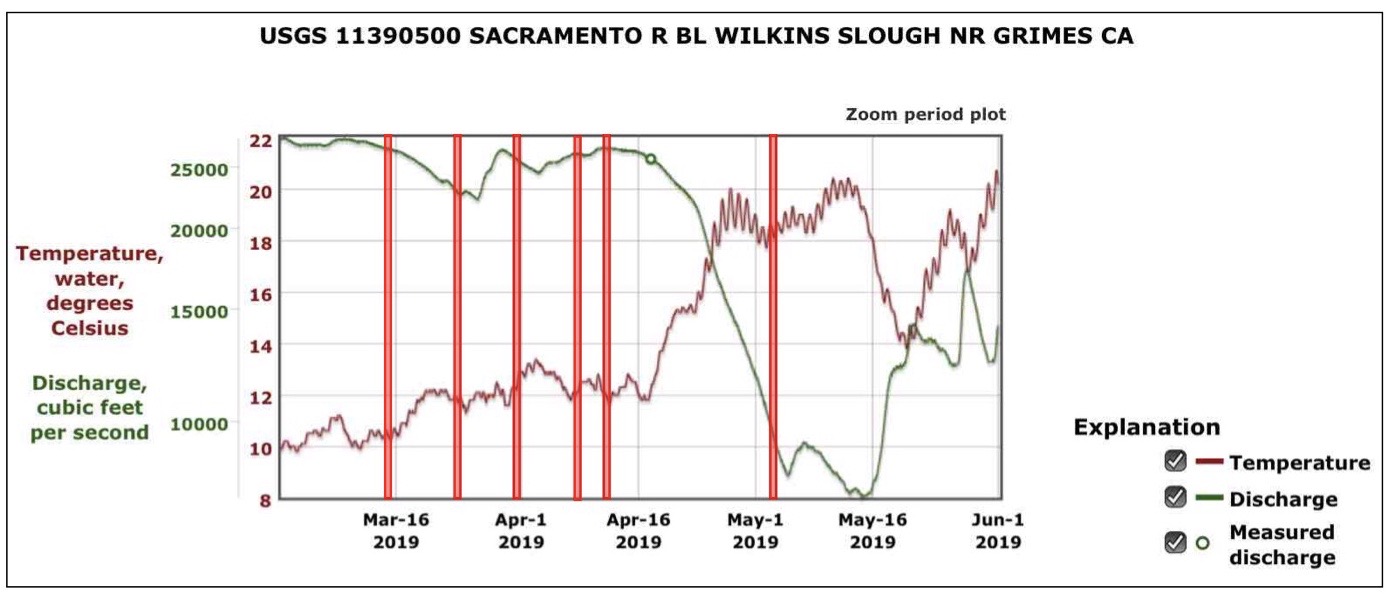
Figure 2. Spring 2019 river flow and water temperature in the lower Sacramento River at Wilkins Slough near Grimes. Red lines denote upstream releases of Coleman NFH fall-run smolts.
State Oroville Feather River Fish Hatchery
The Feather River Fish Hatchery released 9 million salmon smolts to the Feather River and the Bay in 2019 (Figure 3). All of the nearly 2 million spring-run were released into the lower Feather River in March and April. Six million fall-run smolts were released to the Bay. One million fall-run were released into the lower Feather.
Generally, all the smolts were released under favorable conditions. The release of fall-run into the lower Feather in early May occurred under marginal conditions (Figure 4). This late season fall-run smolt release into the Feather River was subject to potential high predation rates in the river and during their migration through the Delta.
The May releases of Feather River fall-run to east San Pablo Bay and the Napa River estuary (Mare Island) are problematic because that area is a major spawning and rearing area for longfin and Delta smelt during the period of releases, especially in wet years like 2019. Yearling or smolt-sized Chinook salmon are known to commonly feed on larval and juveniles fish in estuaries in winter and spring.
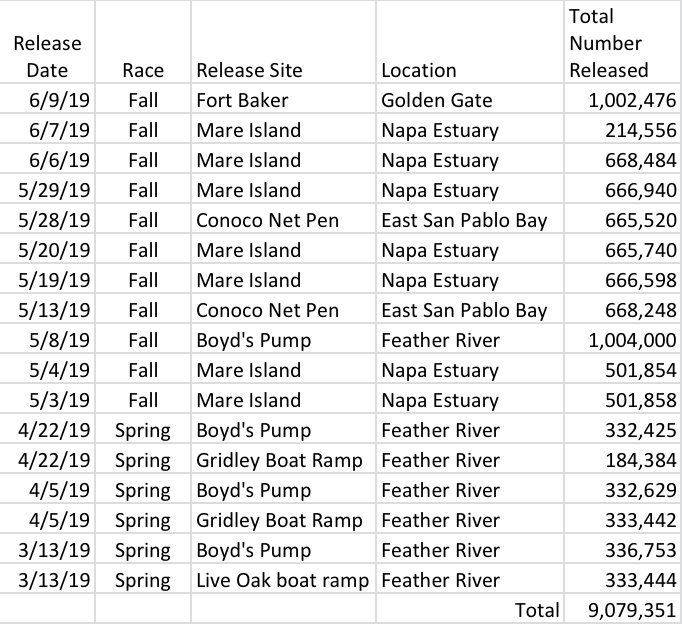
Figure 3. Summary of Feather River Hatchery releases in 2019.
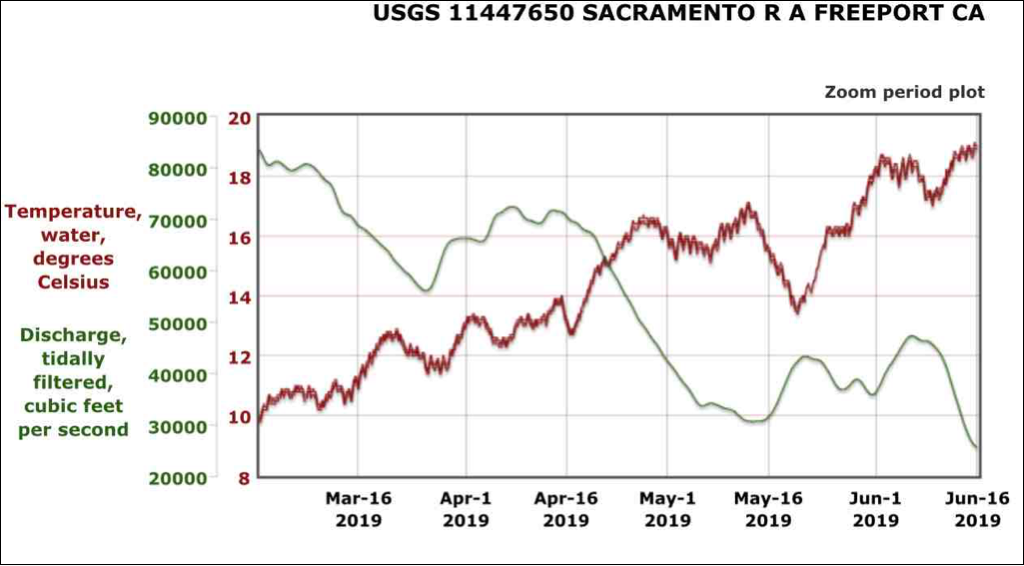
Figure 4. Spring 2019 river flow and water temperature in the north Delta in the Sacramento River at Freeport.
State American River Nimbus Hatchery
The Nimbus Hatchery released 3.6 million fall-run salmon smolts to the American River and the Bay in 2019 (Figure 5). Approximately 2.2 million fall-run smolts were released to the Bay. Approximately 1.6 million fall-run were released into the lower American River (at Sunrise Boat Ramp).
Generally, all the smolts were released under favorable conditions. The lower American fall-run release in mid-May occurred under marginal conditions (Figure 4). This late season release into the American River was subject to potential high predation rates in the river and during their migration through the Delta.
The May and June releases to east San Pablo Bay (Conoco) and the Napa River estuary (Mare Island) are problematic because that area is a major spawning and rearing area for longfin and Delta smelt during the period of releases, especially in wet years like 2019. Yearling or smolt-sized Chinook salmon are known to commonly feed on larval and juveniles fish in estuaries in winter and spring. The early June releases to the Bay occurred under marginal conditions – high water temperatures stressful to young salmon (Figure 6).
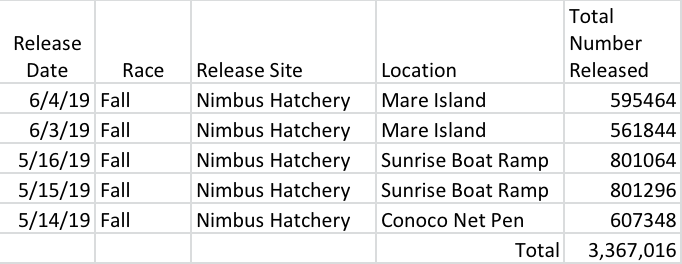
Figure 5. Summary of American River River Hatchery releases in 2019.
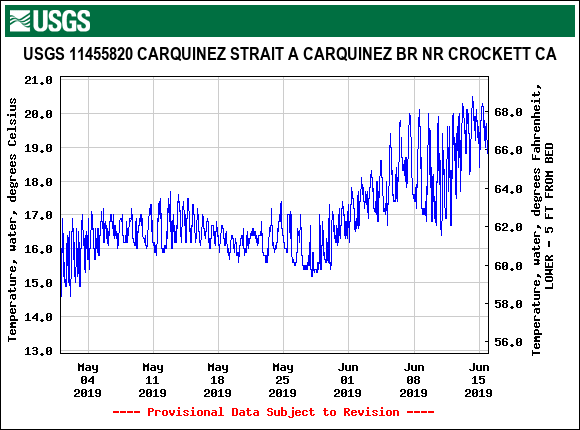
Figure 6. Water temperature in spring 2019 at east end of San Pablo Bay near Mare Island release site of Nimbus Hatchery trucked fall run smolts.
State Mokelumne River Hatchery
The Mokelumne Hatchery released 6.6 million fall-run salmon smolts to the Mokelumne River, the west Delta, the Golden Gate, and the coast in 2019 (Figure 7). Approximately 4.5 million fall-run smolts were released to the west Delta near Sherman Island. Approximately 1.7 million smolts were released on the coast and near the Golden Gate. The remainder (400,000) were released into the lower Mokelumne River.
Generally, most of the smolts were released under favorable conditions. One exception, the lower Mokelumne fall-run releases in mid–May, occurred under marginal conditions (Figure 4). This late-season release into the Mokelumne River was subject to potential high predation rates in the river and during their migration through the Delta. With the Delta Cross Channel closed, these lower river releases were further subject to potentially high risk conditions. In fact, no tagged smolts from the mid-May river releases were detected in south Delta salvage monitoring, an indication of poor survival within the Delta.
Another exception, the late-May releases to the west Delta, are problematic because they occurred under marginal survival conditions – subsequent high water temperatures stressful to young salmon in the west Delta and the Bay (Figures 6 and 8).
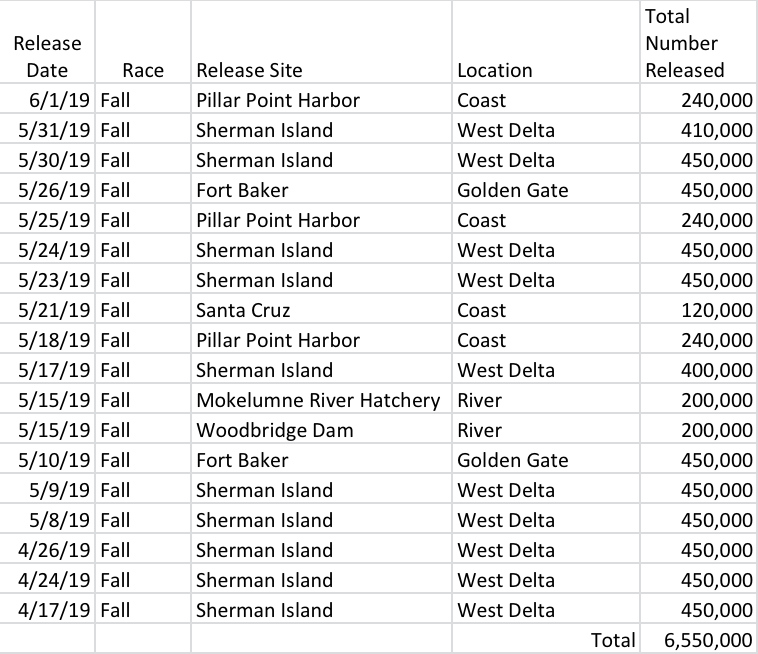
Figure 7. Summary of Mokelumne River Hatchery releases in 2019.
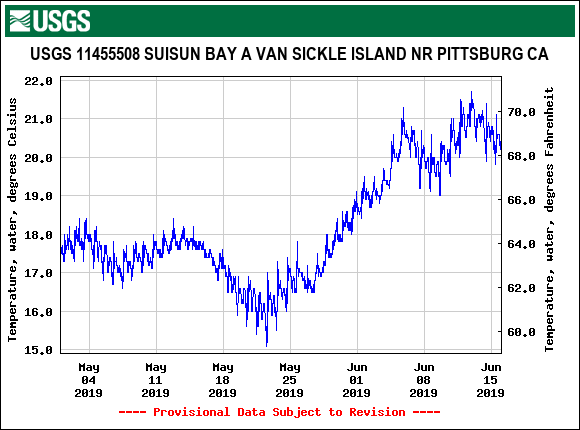
Figure 8. Water temperature in spring 2019 in Suisun Bay.
State Merced River Hatchery
The Merced Hatchery released 0.7 million fall-run salmon smolts to the west Delta near Sherman Island (Figure 9). Conditions were marginal in terms of water temperature for the May 1 releases (Figure 10).
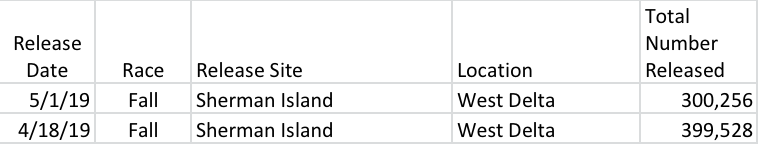
Figure 9. Summary of Merced River Hatchery releases in 2019.
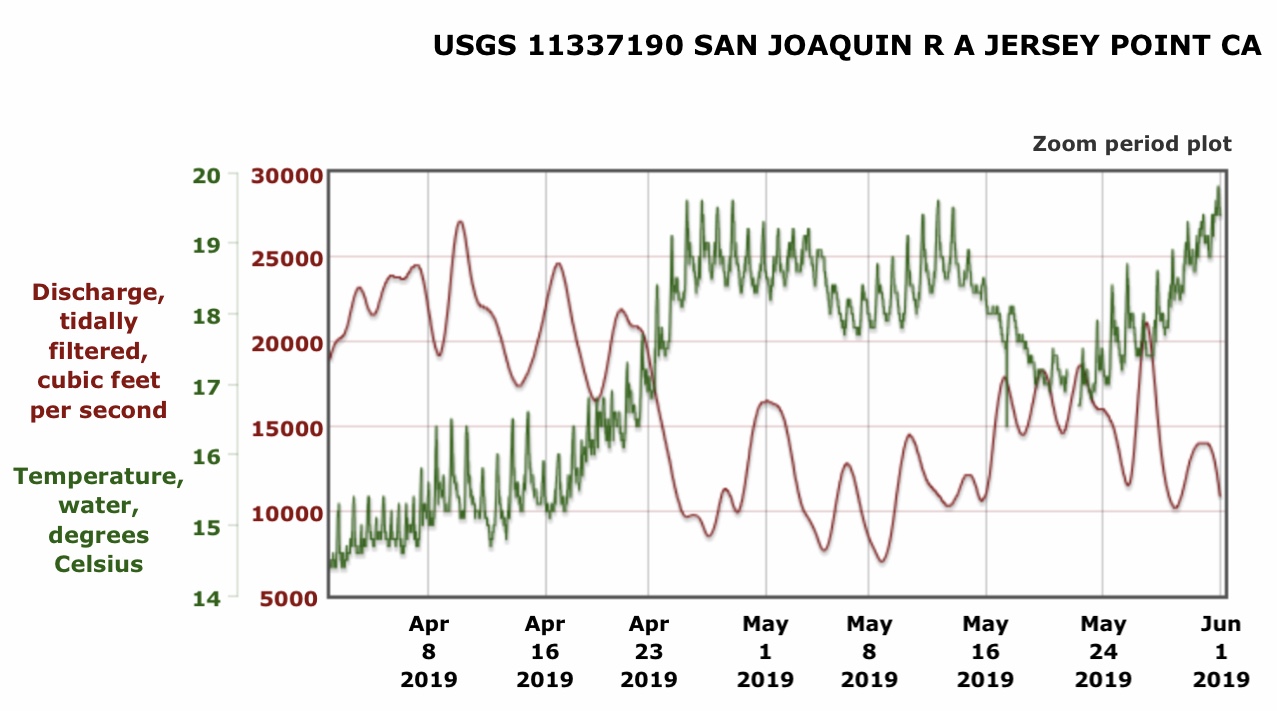
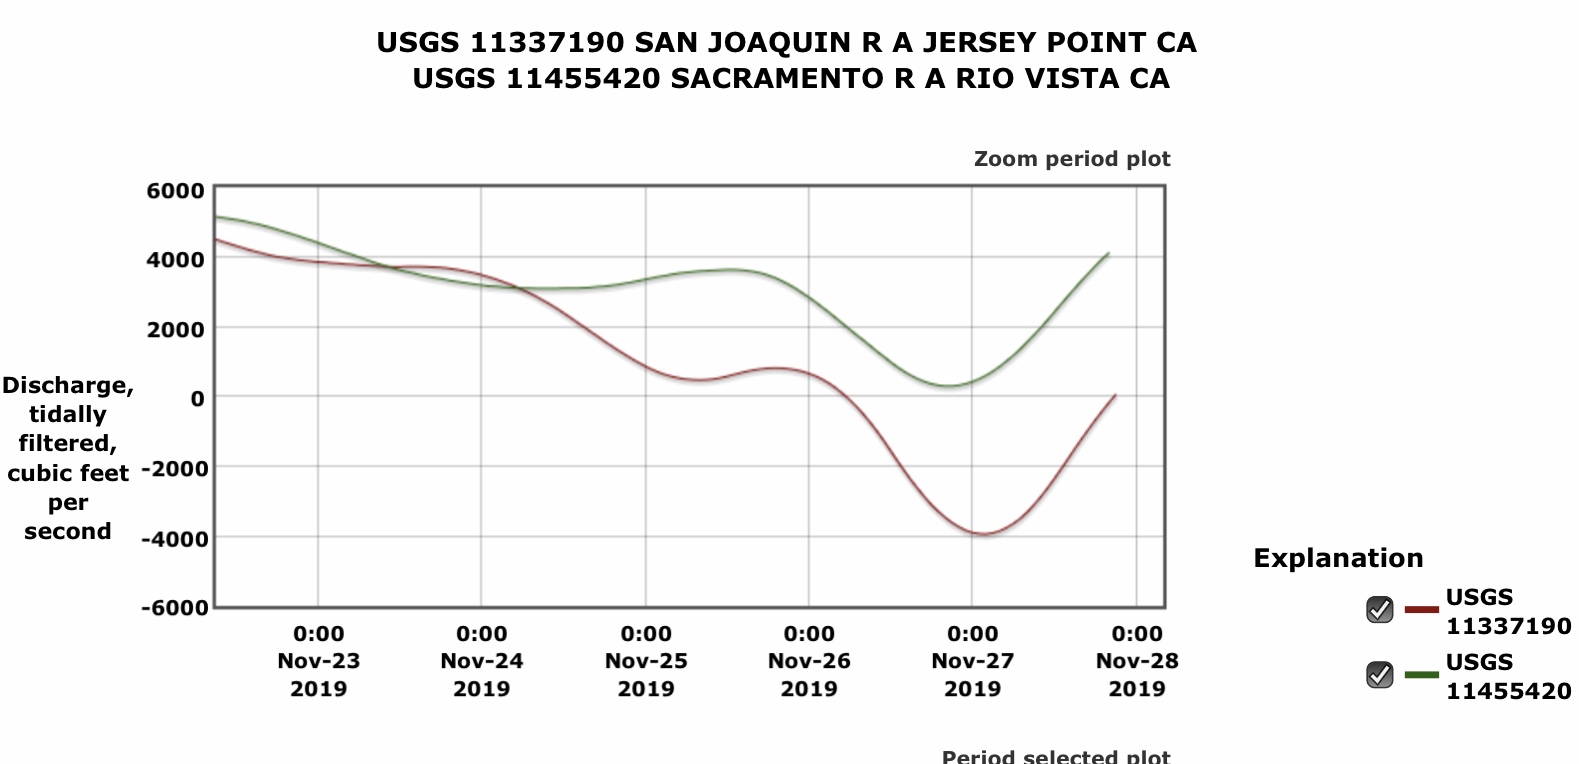
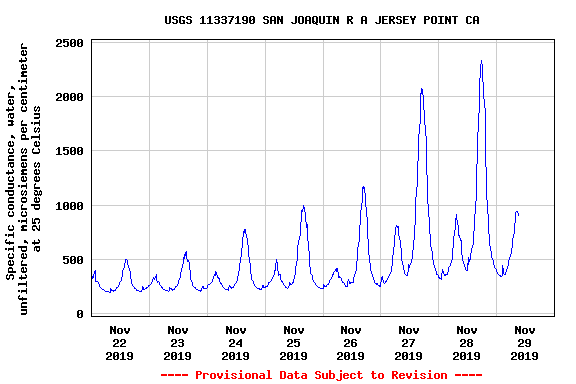
Figure 10. Water temperature in spring 2019 in west Delta in San Joaquin channel off Sherman Island at Jersey Point.
State San Joaquin Spring-Run Recovery Hatchery
The Salmon Conservation and Research Facility Hatchery near Fresno released 212,000 spring-run salmon smolts into the San Joaquin River in 2019 (Figure 11). Generally, most of the smolts were released under favorable conditions. The late release on May 30, however was problematic with river temperatures (Figure 12) and Bay-Delta temperatures (Figure 6, 8, and 10) being too high. The February releases were prone to being drawn into the south Delta and exposed to salvage through April (Figure 13). A similar problem occurred in 2018. Flow pulses or trucking/barging may help resolve this problem.
One very encouraging development was the return of 200 spring-run adults to the San Joaquin River near Fresno, including unmarked fish that were apparently born in the river (not hatchery-born) and successfully navigated the river from near Fresno out the Golden Gate.
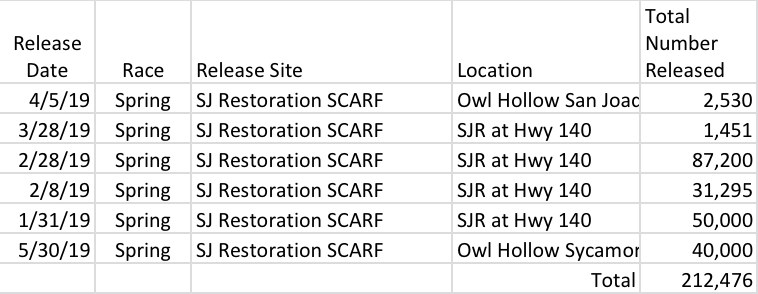
Figure 11. Summary of San Joaquin River Hatchery releases in 2019.
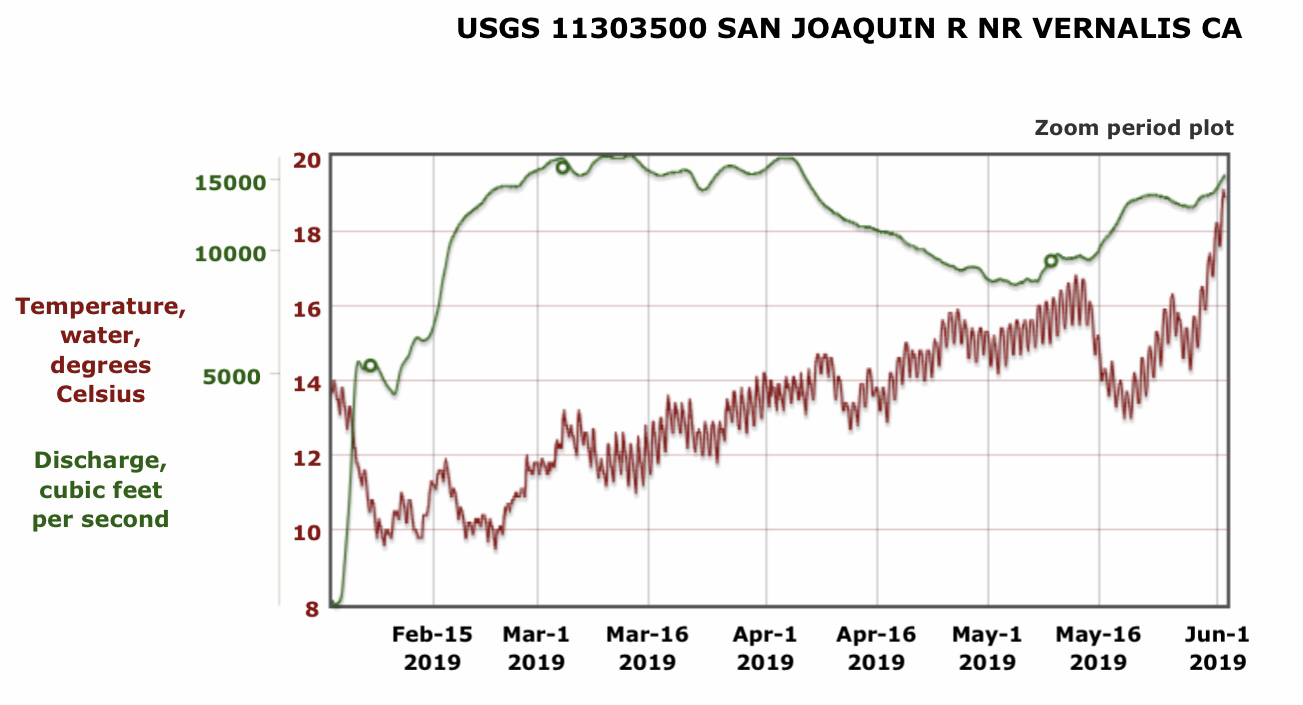
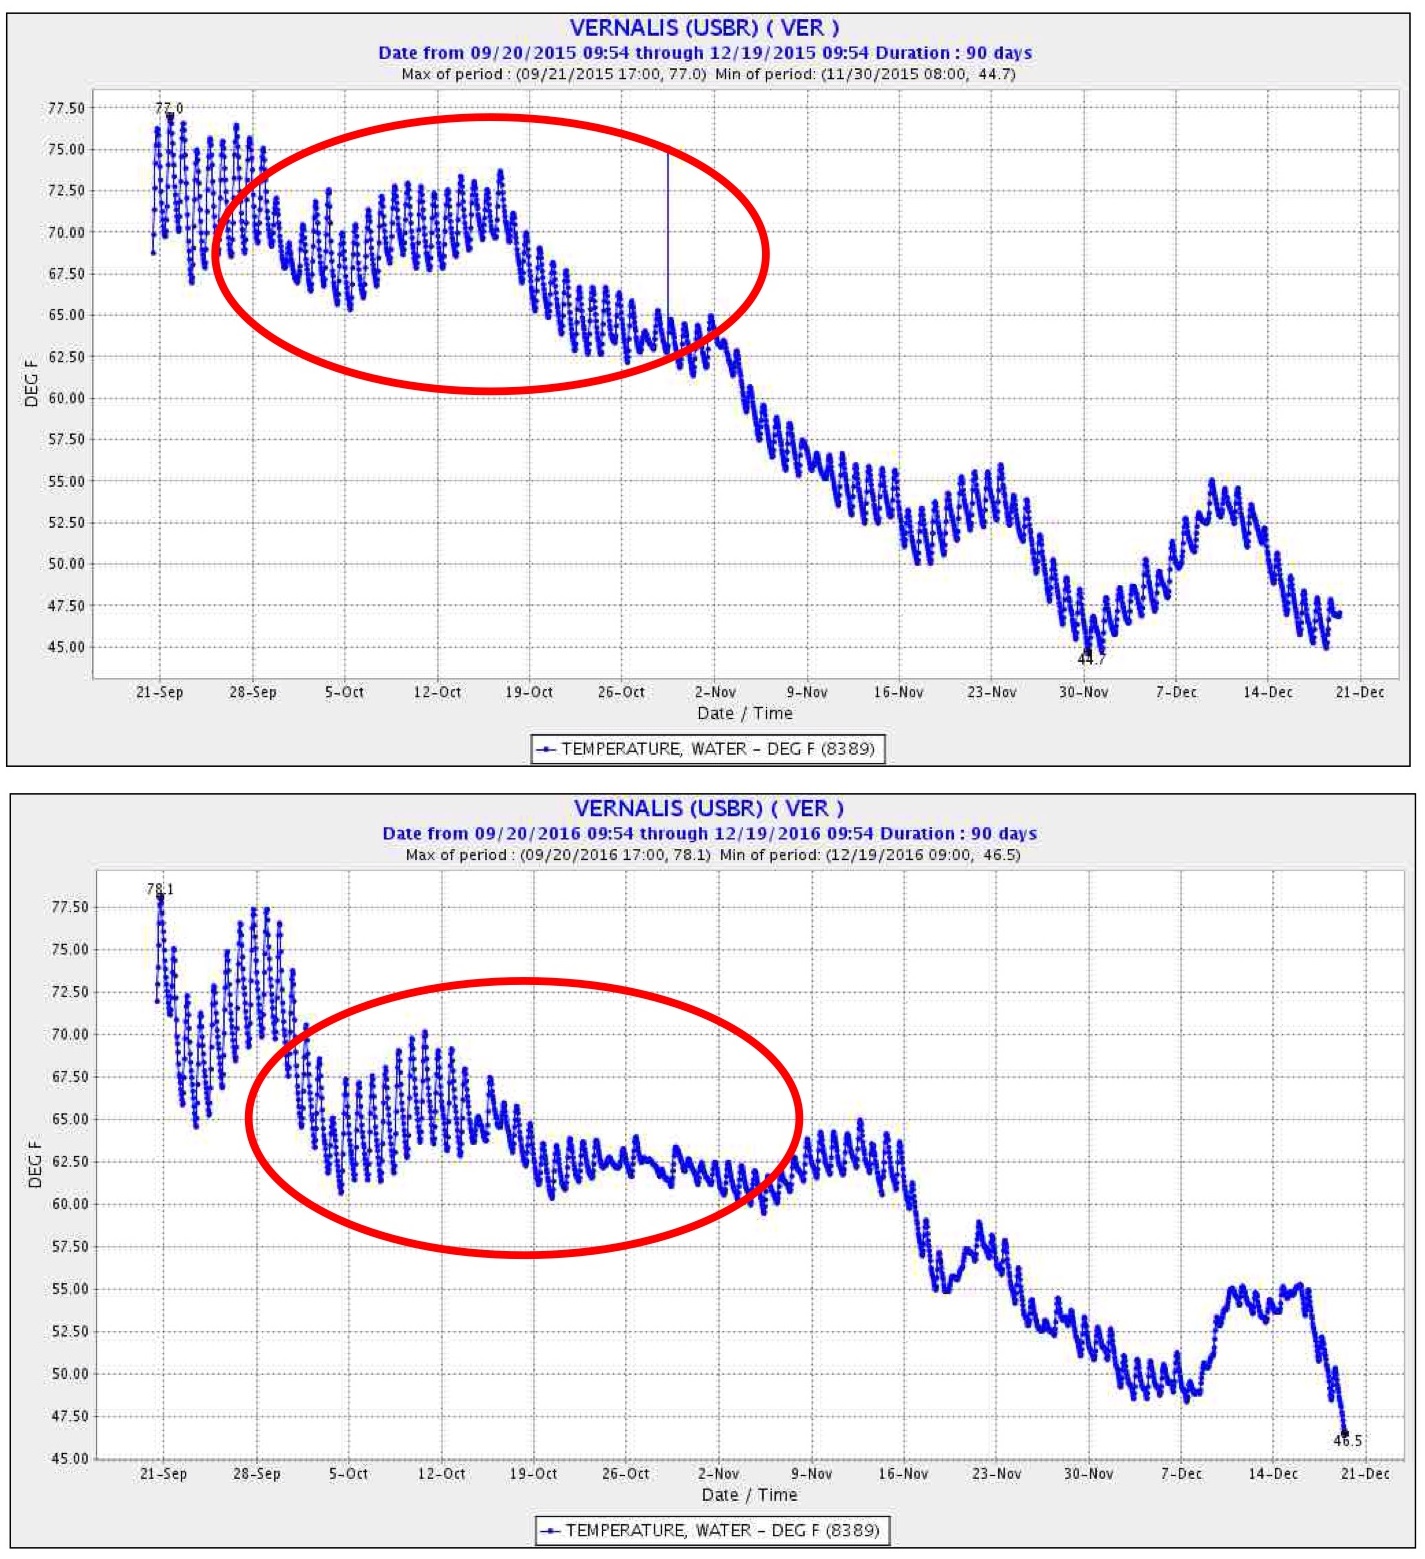
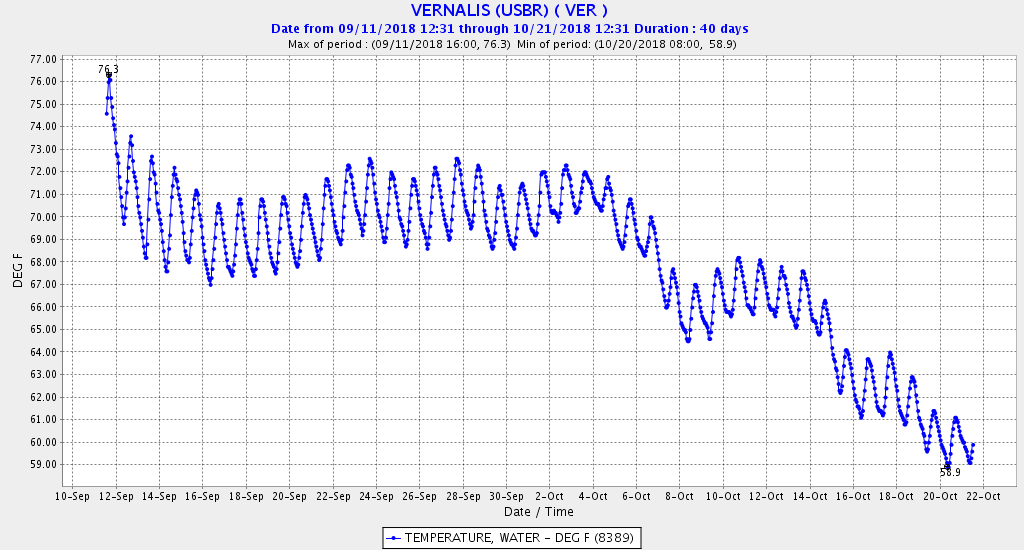
Figure 12. Water temperature and flow in lower San Joaquin River at Vernalis in winter-spring 2019.
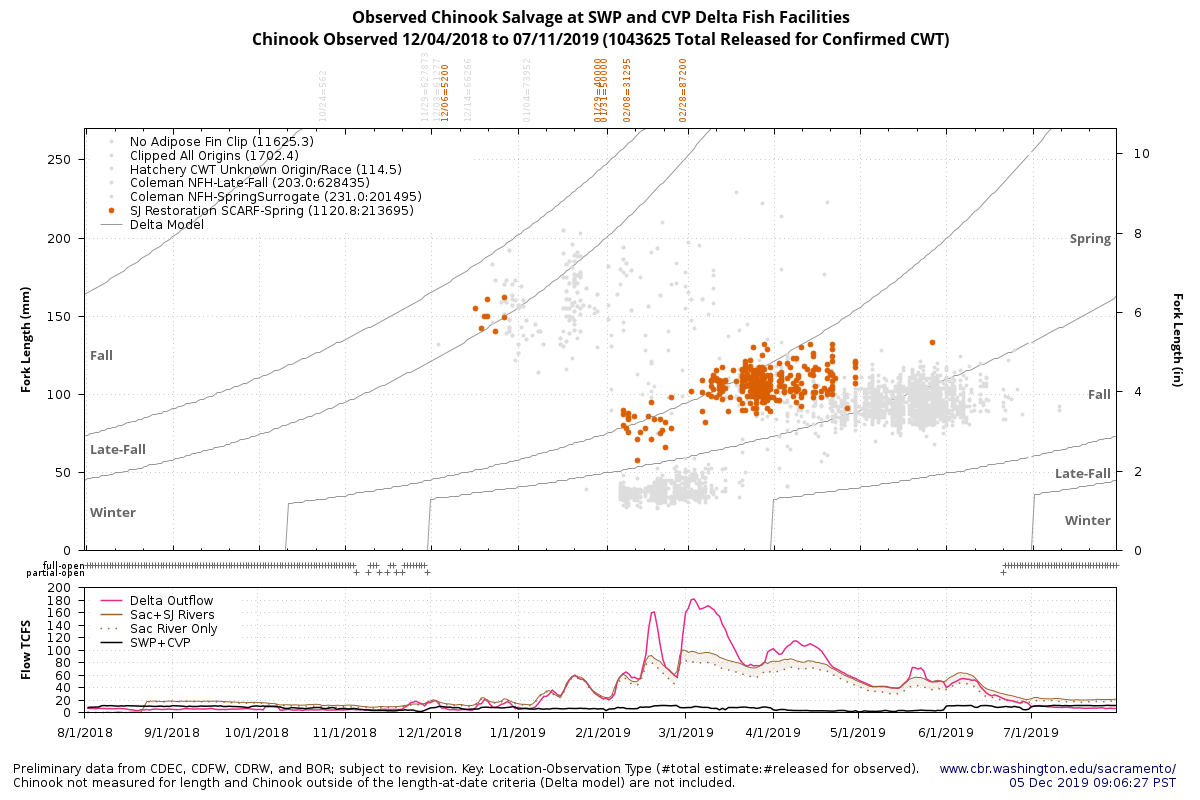
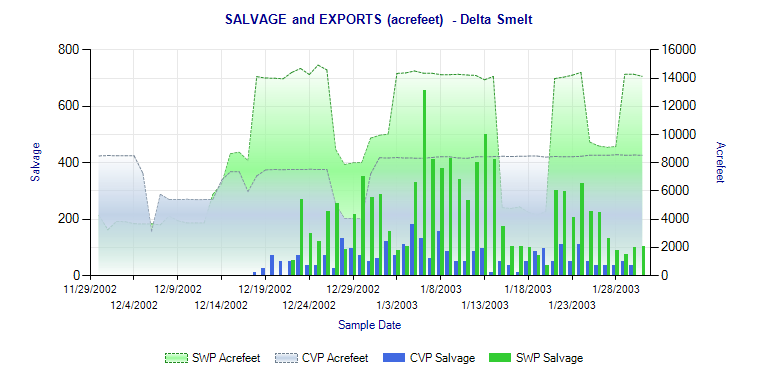
Figure 13. Spring-run hatchery smolt salvage at south Delta export facilities in 2019.
Federal Sacramento River Livingston-Stone Winter-Run Recovery Hatchery
The Livingston Stone Hatchery near Redding released 408,000 winter-run salmon smolts to the Sacramento River and Battle Creek in winter 2019 (Figure 14). Smolts were released under favorable conditions. Salvage of these smolts at south Delta export facilities (Figure 15) indicates some degree of risk probably from being diverted to the south Delta via Georgiana Slough.
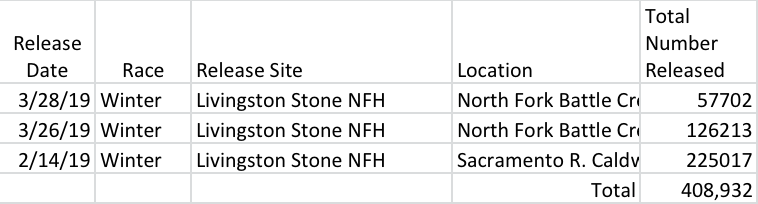
Figure 14. Summary of Livingston-Stone Sacramento River Hatchery releases in 2019.
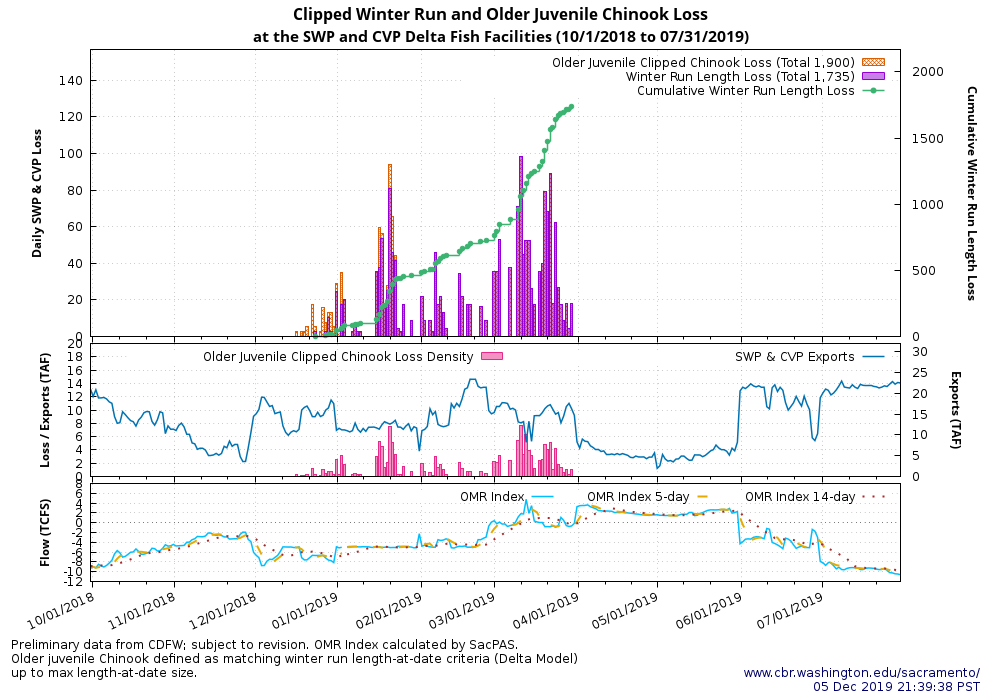
Figure 15. Salvage of hatchery winter-run sized smolts at south Delta export facilities in 2019. Collection includes some late-fall-run hatchery smolts from the Coleman Hatchery.
In Summary
Hatchery salmon releases in wet year 2019 were generally made under favorable survival conditions. However, some releases were made under unfavorable conditions that were avoidable either by altering release timing or location, or by providing pulsed flows to support smolt migrations. Note that it will be several years before we see the adult returns from these tagged hatchery smolts. However, based on past experience, the portion of fish that were released in 2019 under unfavorable conditions will likely have poor adult returns.