On May 8, 2019, the California Department of Fish and Wildlife (CDFW) released one million fall-run salmon smolts from the Feather River Fish Hatchery into the lower Feather River.1 Their prognosis is good, as it is for most salmon, both hatchery and wild, in the Central Valley in this very wet year.
This post focuses on features of wet years that are good for salmon, and how those features help us to understand how to improve salmon production in general. In the past, I have posted a lot about increasing hatchery contributions. In this post, I focus on wild salmon in wet year 2019.
Two periods in early life stage wild salmon survival stand out: fry and smolt migrations. The two periods are well represented in vulnerability to south Delta exports, as seen in intake screen salvage numbers (Figure 1). Fry emerge from river gravels in winter. Many ride the winter flows in February and early March into the tidal Bay-Delta, where they rear for a month or two before heading to the ocean as smolts. From April to June, smolts are migrating from rivers, Delta, and Bay to the ocean. This focused two-migration-period pattern can also be seen in lower river, upper Delta, and upper Bay fish surveys (Figures 2-5). Note that fry are not apparent in the Bay trawls (Figure 5), because fry concentrate in shallow margins that trawls cannot sample. Flows support migrations: getting fry to the Bay-Delta and sustaining smolts to the ocean.
So what factors appear important?
- January-February flow pulses that carry fry to Bay-Delta rearing habitats.
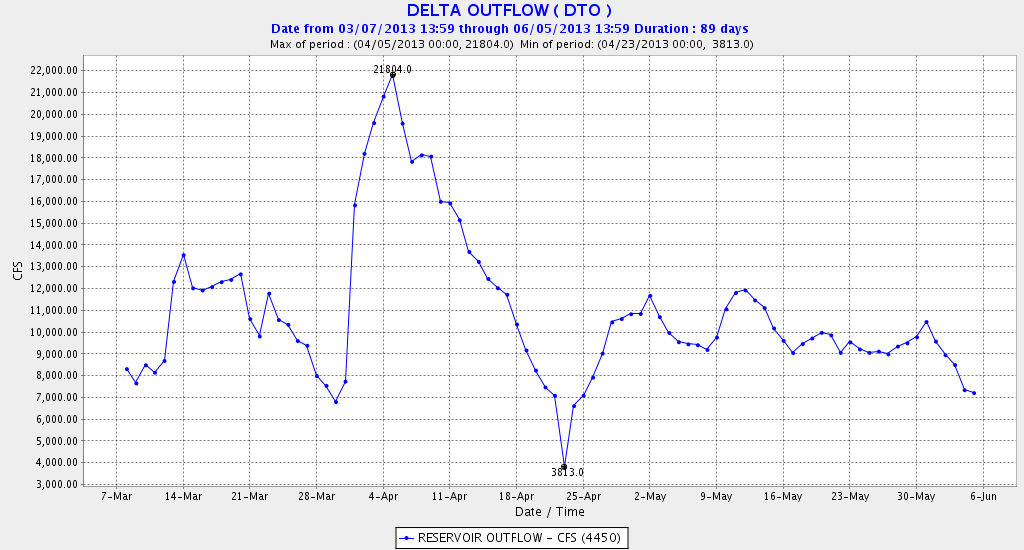
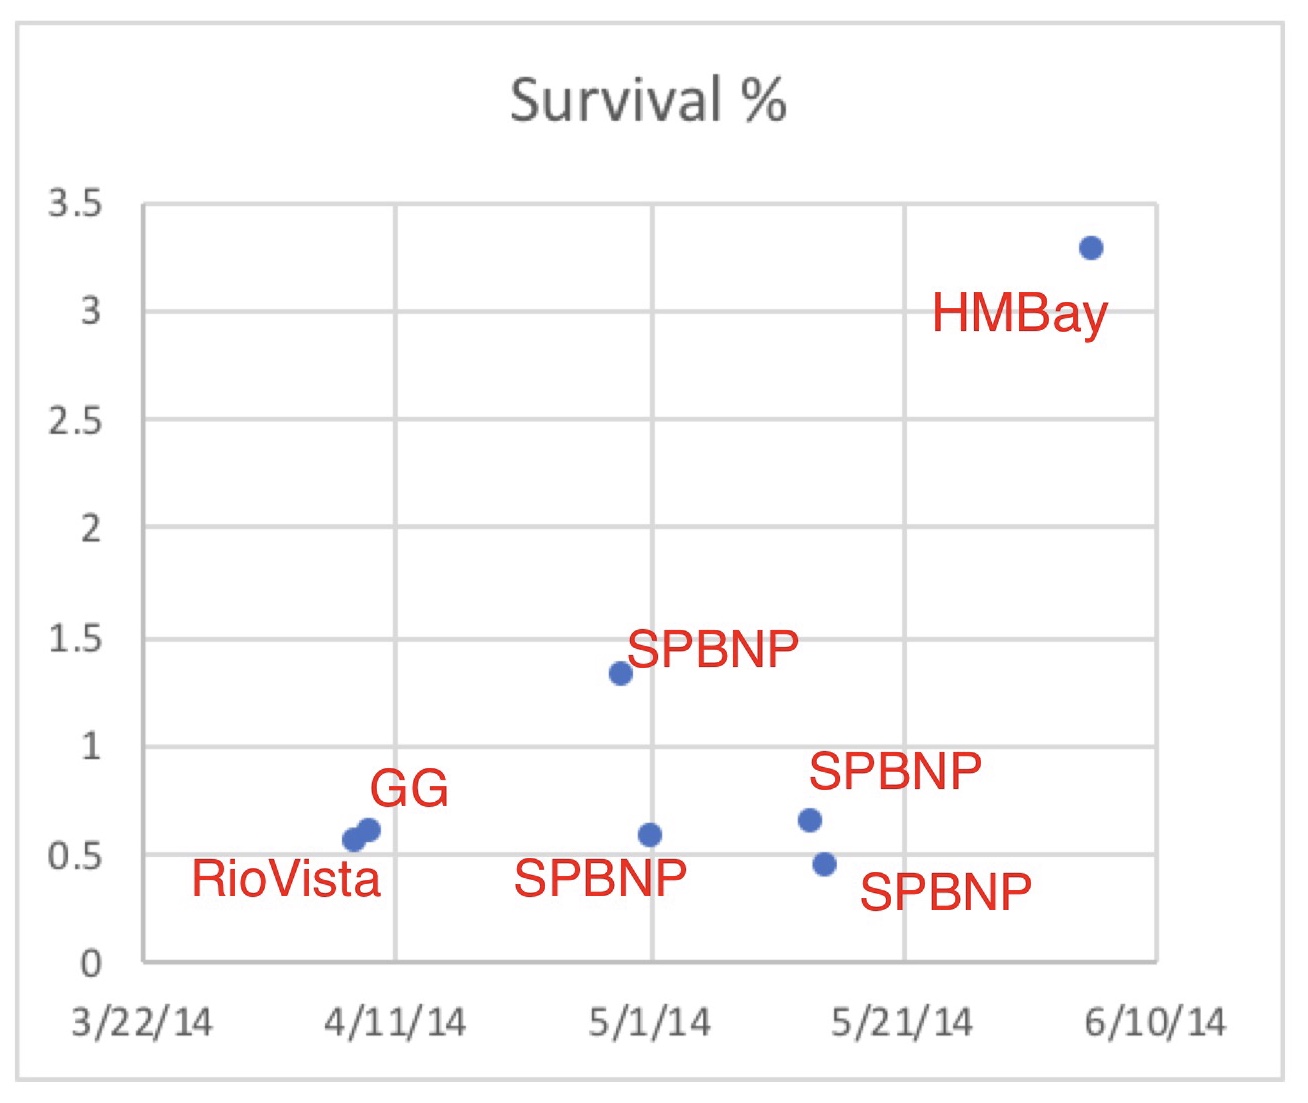
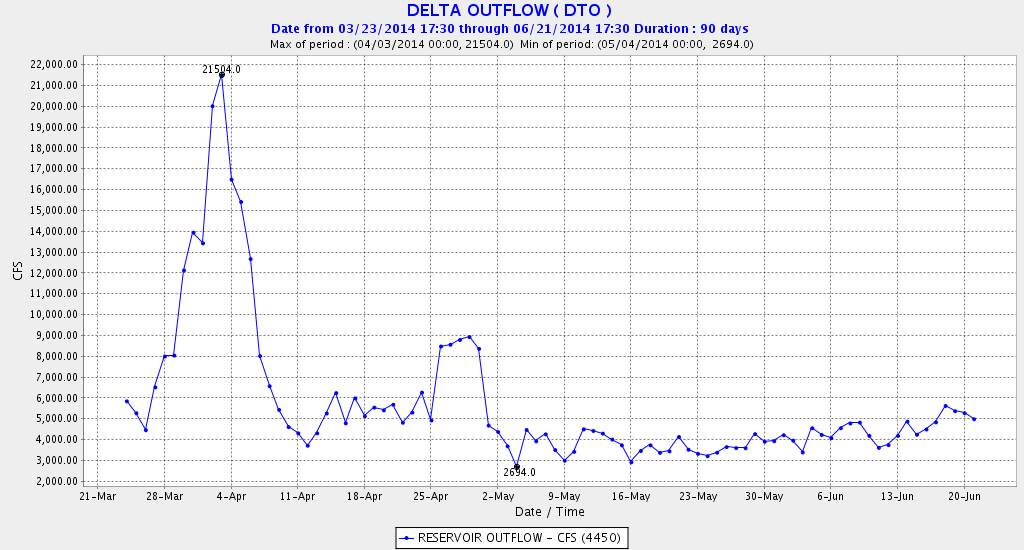
- May-June smolt migration Delta inflows and outflows, and water temperatures.
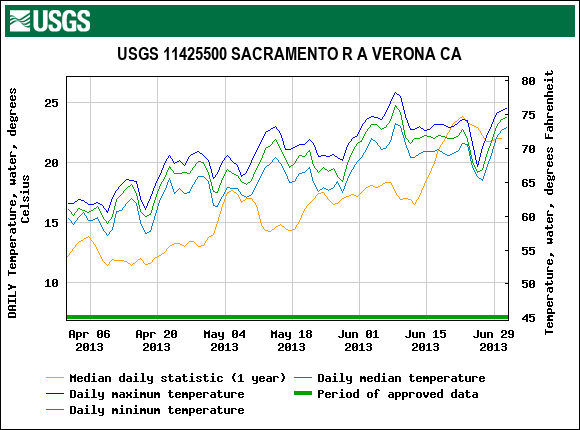
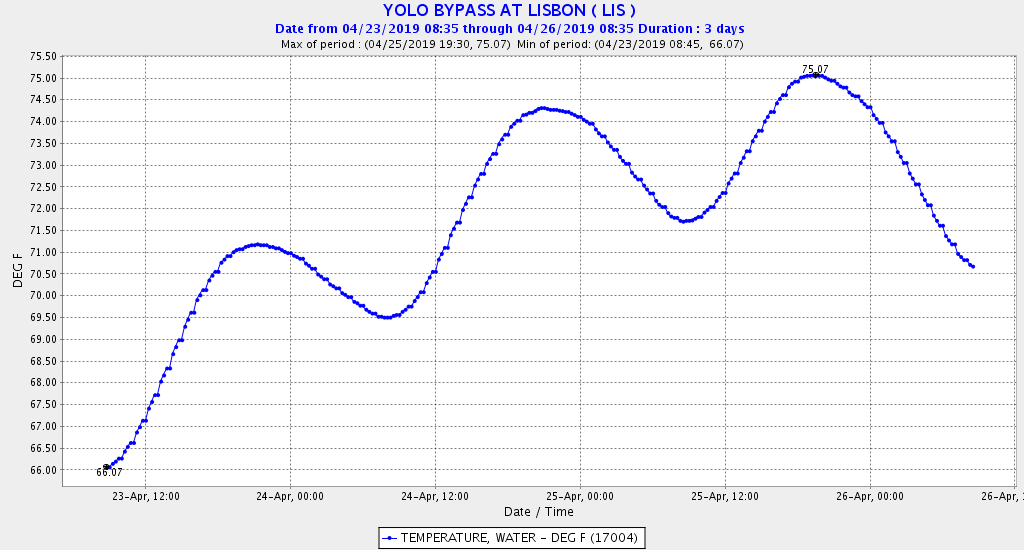
Without winter flow pulses, fry cannot reach the Bay-Delta. Without adequate flows and cool water temperatures (<20oC, 68oF) in spring, smolt survival to the ocean is poor. Even in this very wet year, May conditions are becoming marginal in the lower Sacramento River for migrating smolts (Figures 2 and 3). Delta and Bay conditions remain near optimal (Figures 4 and 5) because of major snow-melt flow contributions from Feather-Yuba and American rivers.
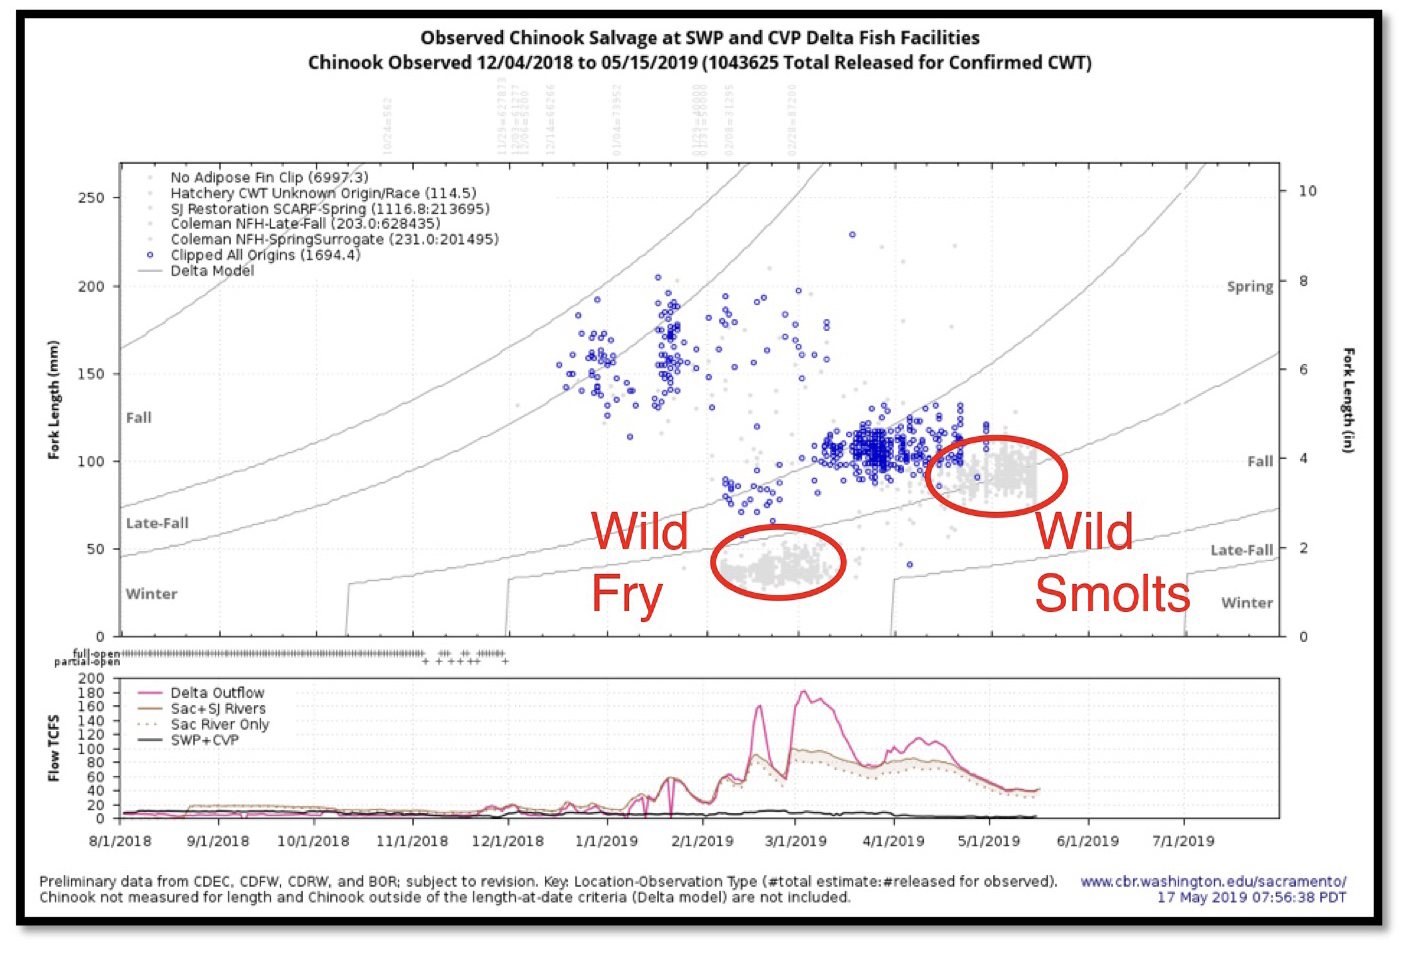
Figure 1. South Delta pumping plant fish salvage sampling surveys (salmon only) in winter-spring 2019. Hatchery smolts dominate salvage except during wild fry and smolt migration periods.
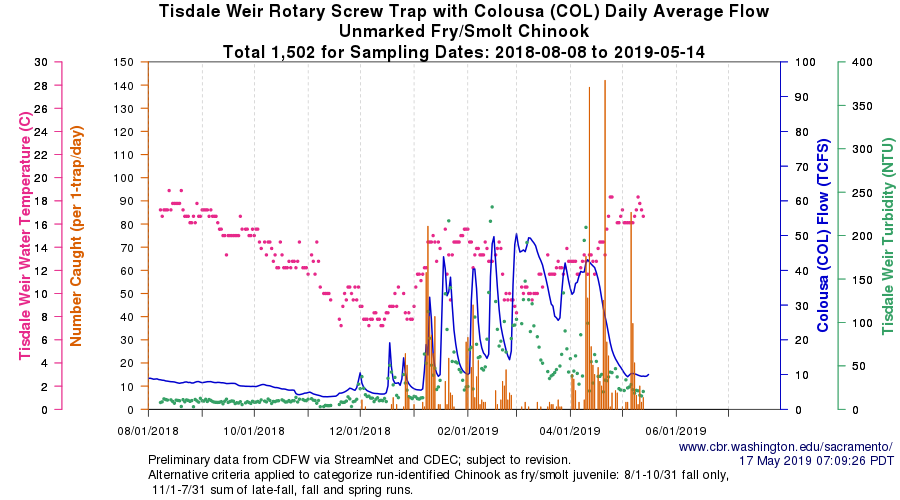
Figure 2. Trap catch of juvenile salmon at Tisdale Weir (river mile 120) winter-spring 2019.
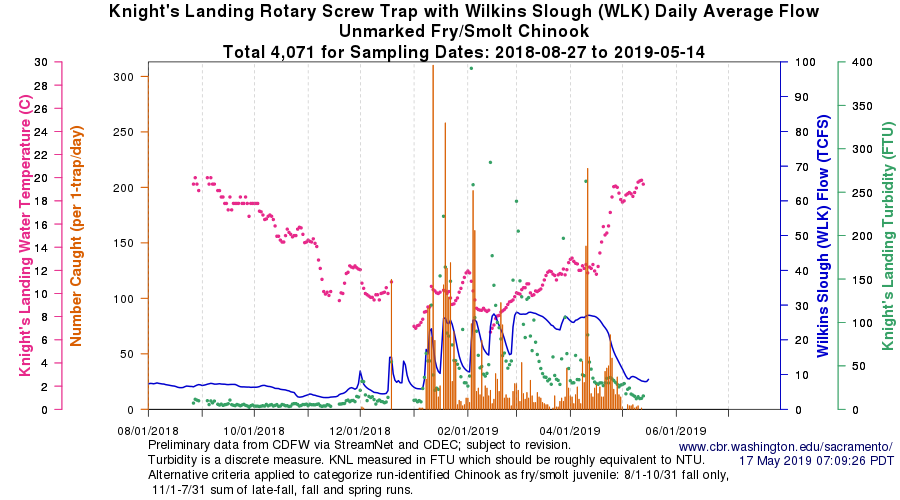
Figure 3. Trap catch of juvenile salmon at Knights Landing (river mile 90) winter-spring 2019. Note Knights Landing is upstream of mouth of Feather River. Flows are much reduced in early May, and water temperatures have reached the stressful level of 20oC.
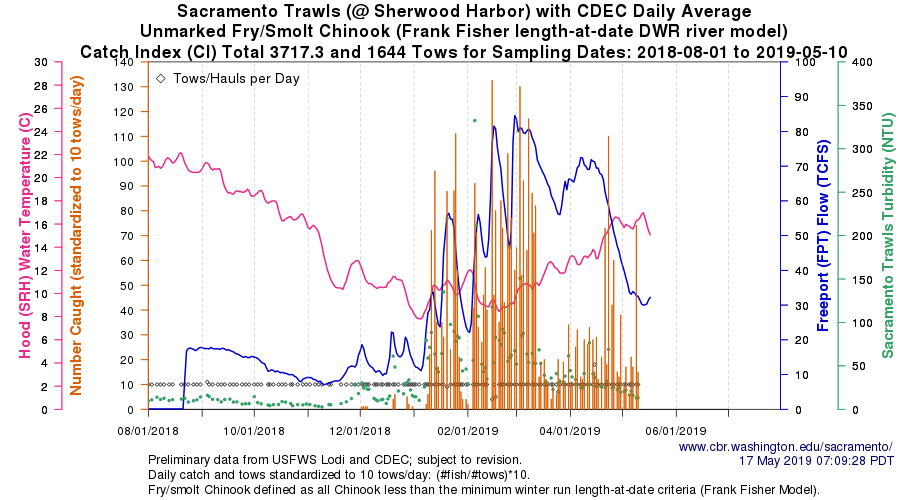
Figure 4. Trawl catch of juvenile salmon at Sacramento (river mile 50) winter-spring 2019. Note high flow of 30,000 cfs in early May from major contributions from Feather-Yuba and American rivers.
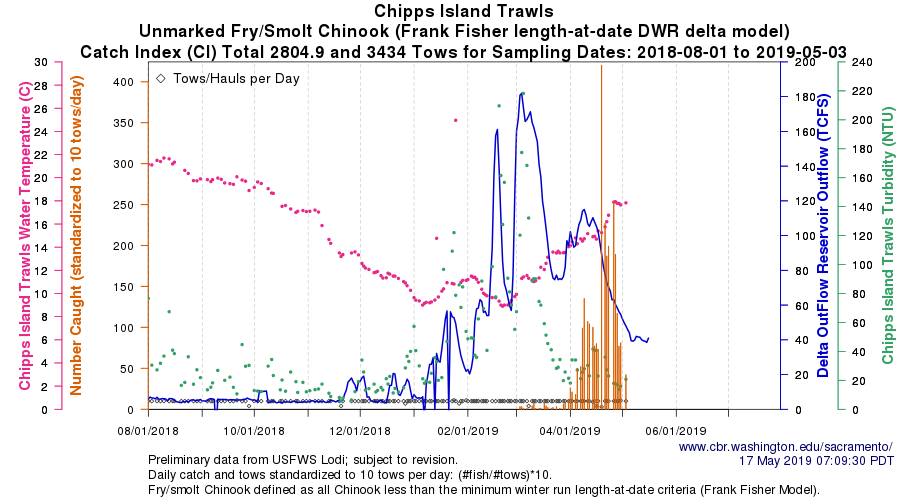
Figure 5. Trawl catch of juvenile salmon at Chipps Island near Antioch in Suisun Bay winter-spring 2019.