Splittail Status – End of 2016

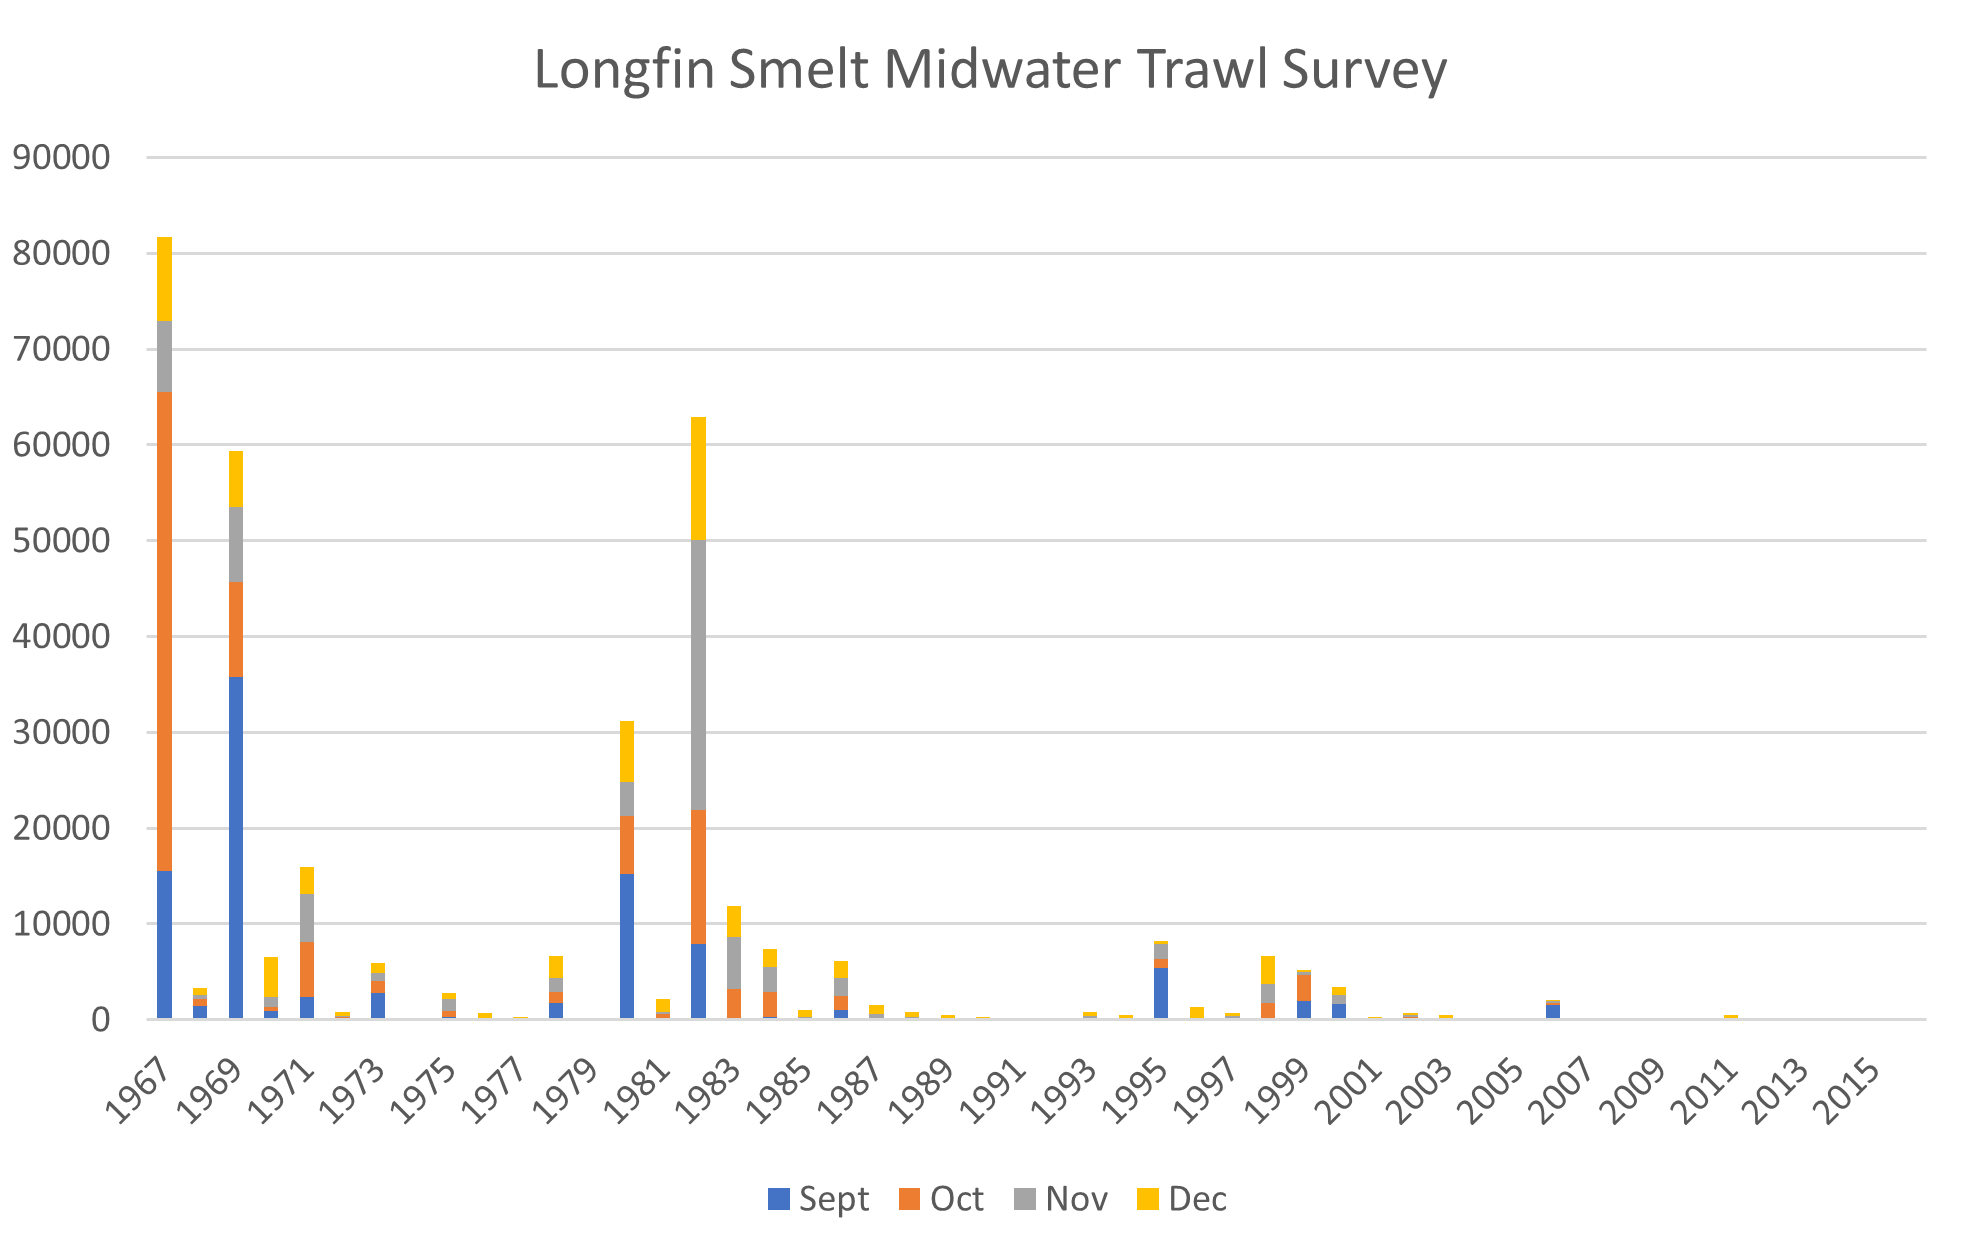
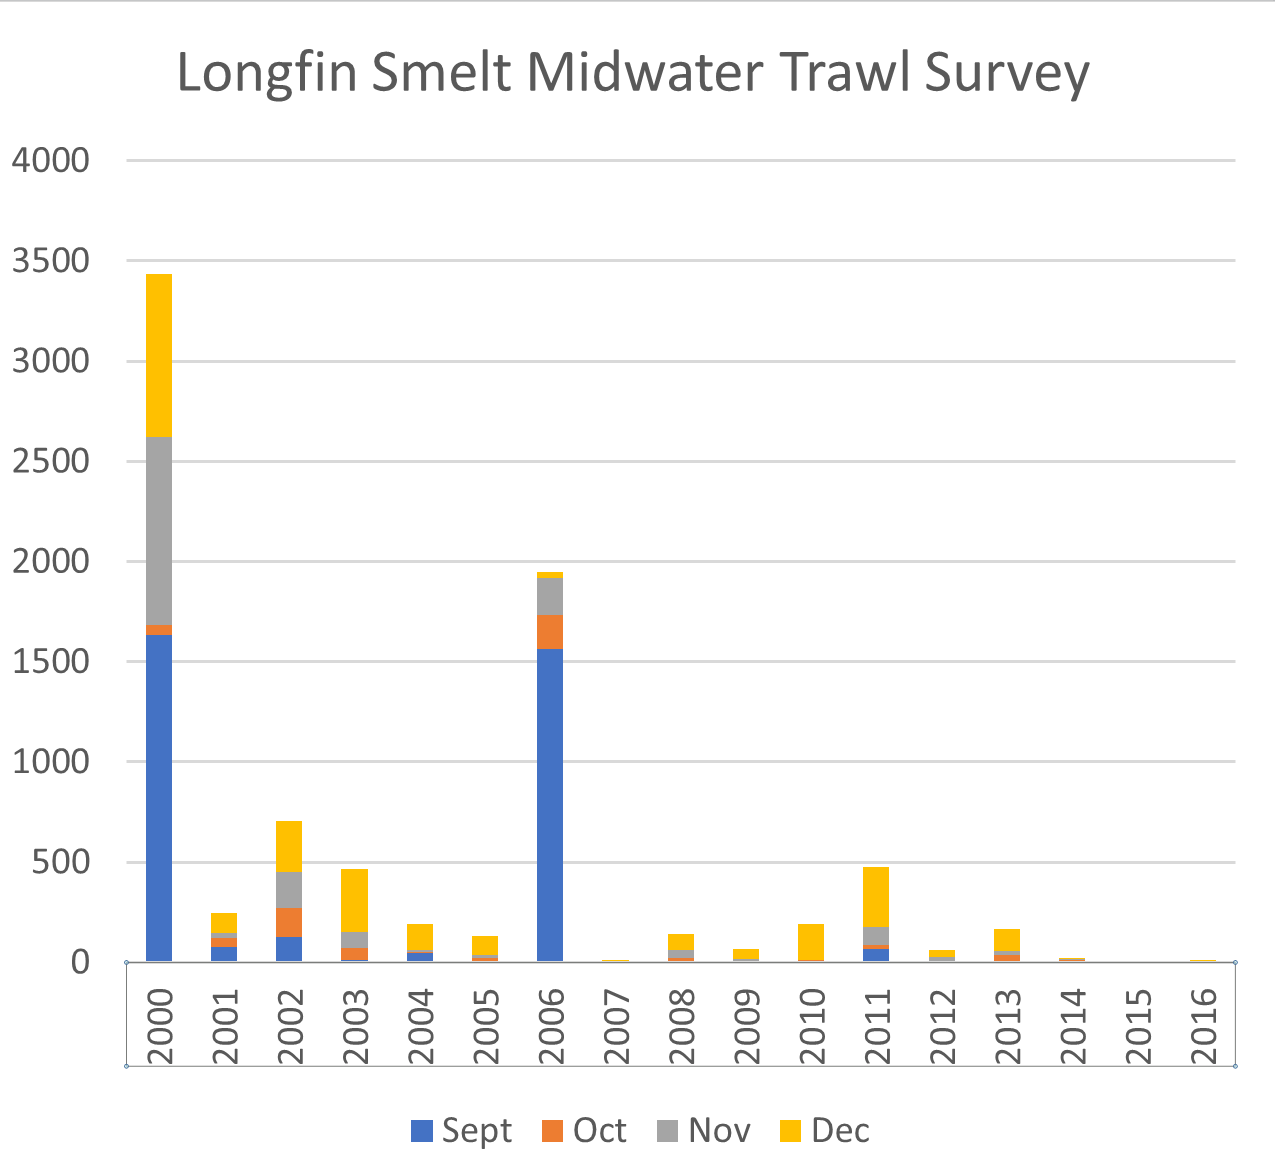
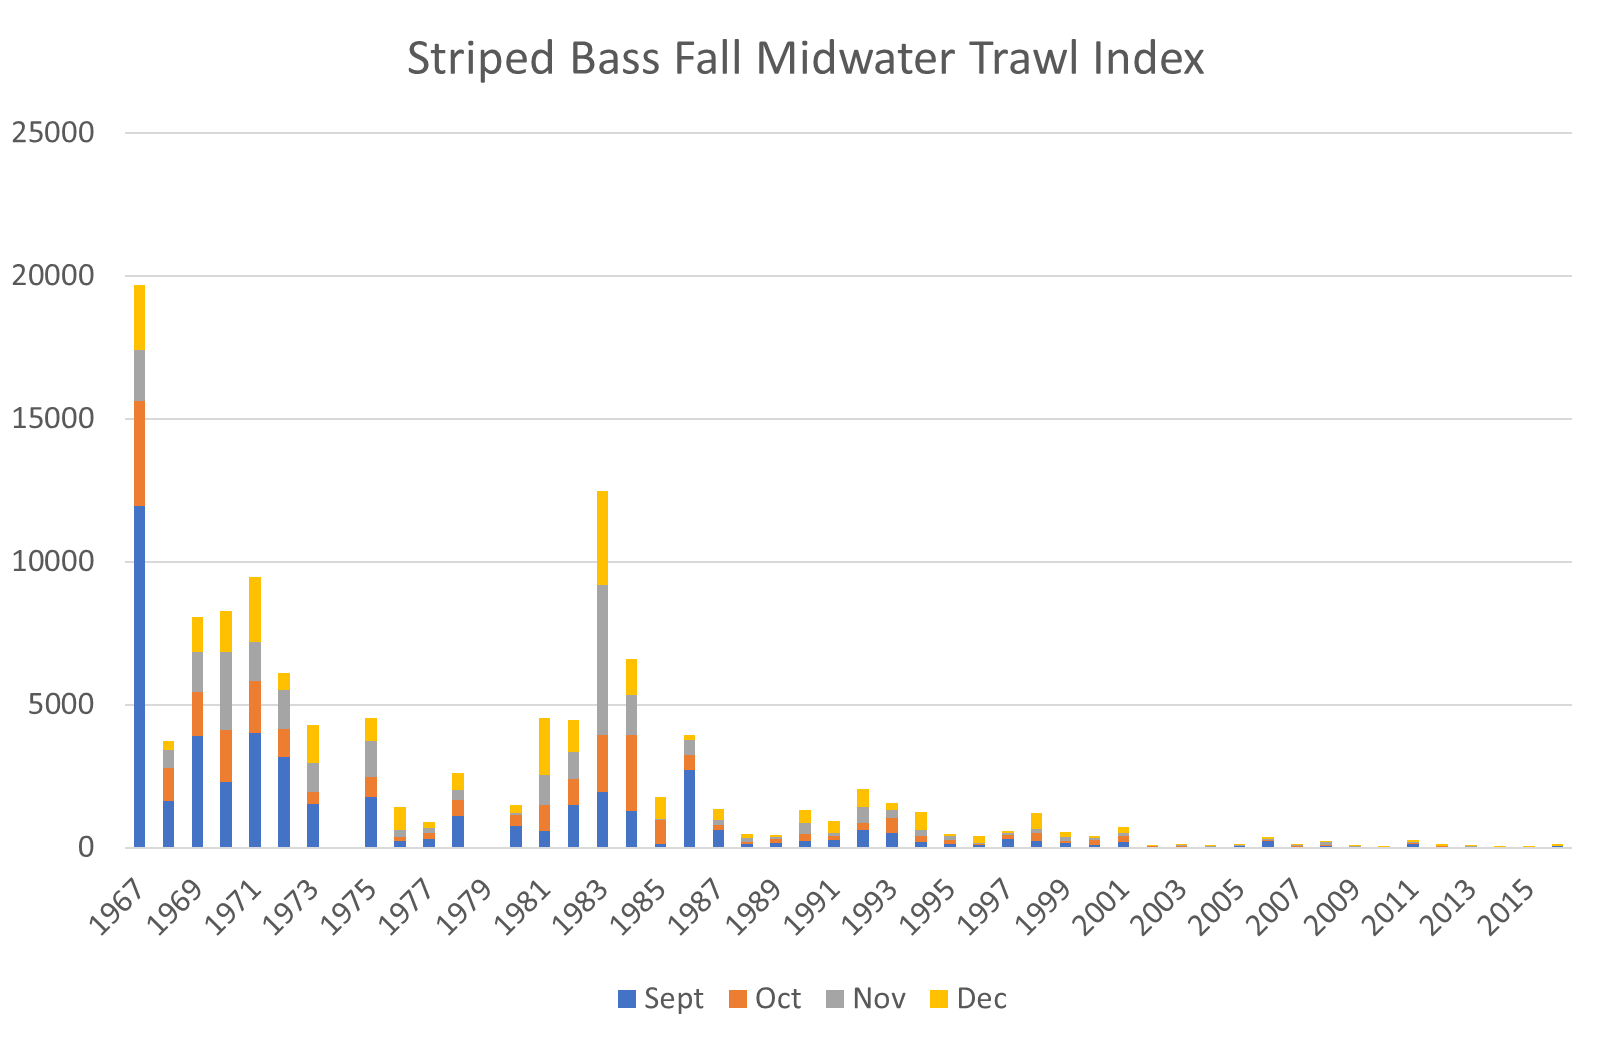
The prognosis for splittail was not good in 20151 after four years of drought and little recruitment since 2011. The below-normal water year in 2016, with its limited winter flooding, brought no apparent recovery in the Fall Midwater Trawl Index (Figure 1). Summer salvage (Figure 2) indicated that there was some production in 2016, although salvage was two orders of magnitude lower than the previous normal water year 2010 (Figure 3) and three orders of magnitude less than the previous wet water year 2011 (Figure 4).

If water year 2017 were to continue on its current trajectory and become a wet year with widespread flooding, conditions for splittail spawning and rearing this winter and spring would be optimal. A positive response in salvage, Fall Midwater Trawl Survey, and FWS Seine Survey would indicate some form of recovery in the population. However, a lack of response on the order of that which occurred in 2011 would be a signal that the population is in dire straits and at risk of recruitment failure and eventual extinction. In the absence of a 2011-magnitude response in the next wet year, the fisheries agencies should conduct a comprehensive review to evaluate whether to re-list2 splittail under the federal and state endangered species acts.

Figure 1.  Splittail Fall Midwater Trawl Survey Index 1967-2016.  (Data Source)

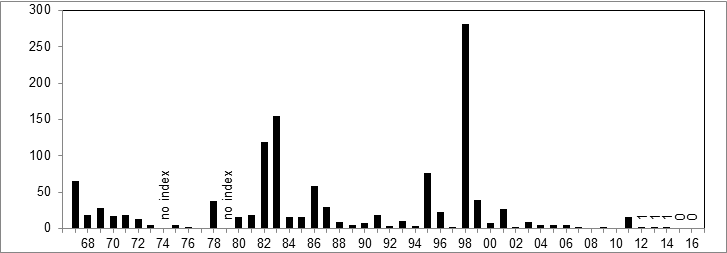
Figure 1. Splittail Fall Midwater Trawl Survey Index 1967-2016. (Data Source3)

Figure 2.  Splittail salvage in 2016.  Export rate for federal and state pumping plants.  (Source )

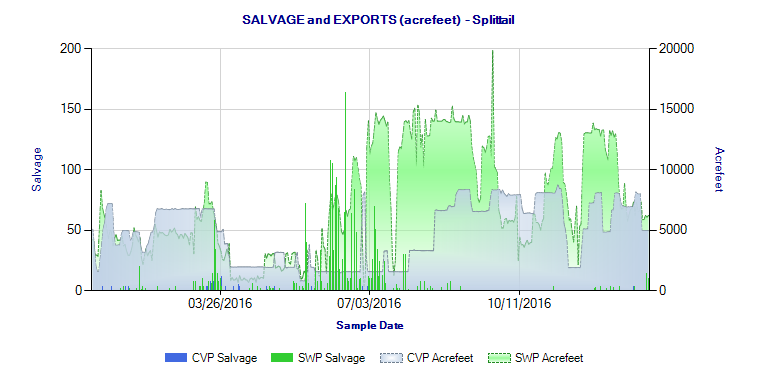
Figure 2. Splittail salvage in 2016. Export rate for federal and state pumping plants. (Source4)

Figure 3.  Splittail salvage in 2010.  Export rate for federal and state pumping plants.  (Source )

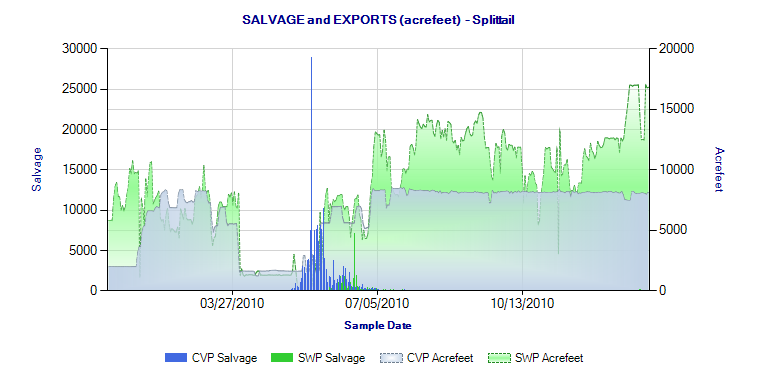
Figure 3. Splittail salvage in 2010. Export rate for federal and state pumping plants. (Source5)

Figure 4.  Splittail salvage in 2011.  Export rate for federal and state pumping plants.  (Source )

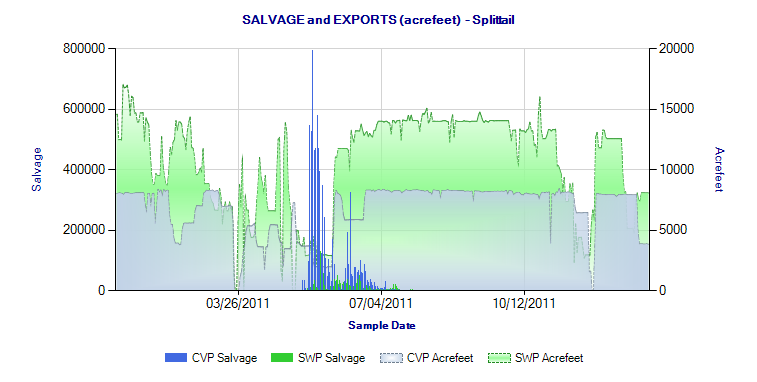
Figure 4. Splittail salvage in 2011. Export rate for federal and state pumping plants. (Source6)

  1. http://calsport.org/fisheriesblog/?p=1126
  2. Splittail were de-listed in 2003. On October 7, 2010, the USFWS found that re-listing of splittail was not warranted (75 FR 62070). The splittail is designated as a species of special concern by the California Department of Fish and Wildlife.
  3. https://www.wildlife.ca.gov/Conservation/Delta/Fall-Midwater-Trawl
  4. https://www.wildlife.ca.gov/Conservation/Delta/Salvage-Monitoring
  5. https://www.wildlife.ca.gov/Conservation/Delta/Salvage-Monitoring
  6. https://www.wildlife.ca.gov/Conservation/Delta/Salvage-Monitoring

Striped Bass Status – End of 2016

The prognosis for stripers was not good in 20151 after four years of drought. The normal water year in 2016 brought only minor improvement in recruitment of juveniles into the population, but recruitment remains near record lows (Figures 1-3). The wetter 2016 started with higher juvenile production, but that stalled by late spring. Striped bass salvage at south Delta export facilities showed typical patterns, with about 10% of the numbers salvaged in year 2000 and two primary peaks in salvage – late spring/early summer and late fall (Figure 4).

The Fall Recruitment Index of juveniles into the population as derived from the Fall Midwater Trawl Survey (Figure 2) compared with the prior Summer Townet Survey (Figure 1) indicates a strong positive relationship (Figure 5). The year class strength is very much dependent on the number of young starting the summer, which in turn is likely related to the number of eggs laid in spring and subsequent survival of larvae hatched to the early summer juvenile stage as measured in the Summer Townet Survey. Subsequent survival to the fall appears related to summer habitat conditions, for which a good indicator is Delta outflow. High relative survival to fall in 1998 and 2006 (labeled blue in Figure 5) is likely due to these summers’ higher Delta outflow (Figure 6) and related Delta conditions including export levels (Figure 4). The 2010 and 2016 fall indices were likely suppressed by low outflow, high exports, and resulting poor in-Delta survival, indicated by high salvage numbers. Likewise summer and fall indices in drought years 2007, 2014, and 2015 were likely depressed (Figure 5) by these same factors.

The above patterns and observations are very important because the striped bass remain an important indicator of Bay-Delta Estuary ecological health.

Figure 1.  Striped bass Summer Townet Survey Index 1959-2016.  (Data Source )

Figure 1. Striped bass Summer Townet Survey Index 1959-2016. (Data Source2)

Figure 2.  Striped bass Fall Midwater Trawl Survey Index 1967-2016.  (Data Source )

Figure 2. Striped bass Fall Midwater Trawl Survey Index 1967-2016. (Data Source3)

Figure 3.  Striped bass Fall Midwater Trawl Survey Index 2000-2016. (Same source as Figure 2)

Figure 3. Striped bass Fall Midwater Trawl Survey Index 2000-2016. (Same source as Figure 2)

Figure 4.  Striped bass salvage at south Delta fish facilities in 2016.  Export rate is shown as acre-feet (~2 times rate in cfs).  (Data Source )

Figure 4. Striped bass salvage at south Delta fish facilities in 2016. Export rate is shown as acre-feet (~2 times rate in cfs). (Data Source4)

Figure 5. Striped bass Fall Midwater Trawl Survey Index (log10[index+1]) versus prior Summer Townet Index (log10).  Select years labeled, with color of number showing year type: blue=wet, green=normal, and red=critically dry.

Figure 5. Striped bass Fall Midwater Trawl Survey Index (log10[index+1]) versus prior Summer Townet Index (log10). Select years labeled, with color of number showing year type: blue=wet, green=normal, and red=critically dry.

Figure 6.  June through August Delta outflow in 1998, 2006, and 2010.

Figure 6. June through August Delta outflow in 1998, 2006, and 2010.

Delta Smelt at Risk – 1/5/17

The conflict continues between the Smelt Working Group (SWG) and the designated protector of the Delta smelt, the US Fish and Wildlife Service (FWS), over the amount of Delta exports allowed under existing Delta conditions.  The SWG recommends exports of no more than 2000 cfs, while the FWS continues to allow exports of 5000-6000 cfs (about half capacity), contrary to  the rules for Delta exports in its own smelt biological opinion.  The SWG notes that adult smelt continue to be captured in trawls in the central Delta (in surprising numbers), where smelt are at high risk of being drawn to the south Delta pumping plants or of eventually spawning in the central Delta where their offspring will be vulnerable to the export pumps.  The FWS is committed to allowing moderate exports as long as no adults are captured at the pumping plants’ fish salvage facilities (which would indicate it is too late to do anything other than to shut down the pumps). The National Marine Fisheries Service limits exports to the present 5000-6000 cfs level as of January 1, consistent with rules in its own biological opinion to protect juvenile salmon migrating down the Sacramento River.

Despite high Sacramento River inflows into the Delta of 30,000 to 50,000 cfs in the past two weeks, the smelt move from the Bay into the Delta by surfing the tides – that is, by moving upstream on incoming tides.  Flood tide velocities shown in Figure 1 indicate the adult smelt can readily “surf” into the Delta until they come up against the strong flows of the Sacramento River and its inflow channels that overwhelm the tidal flows.  In the south Delta, where limited flow has been coming down the San Joaquin River, export pumping plants accentuate the negative flood tide velocities and reduce ebb tide velocities.  This further increases the risk that adult smelt will be drawn to the south Delta.  Only time will tell if this risky FWS strategy protects the endangered Delta smelt during this potential comeback year.

Figure 1. Flood tide channel current velocities in feet/second in early January 2017. Arrows depict current direction on flood tides. Sacramento River net downstream flow was 30,000-50,000 cfs, which overwhelmed the flood tide. Light blue dots are flow gaging stations. Basemap source with gaging stations is DWR/CDEC.

Figure 1. Flood tide channel current velocities in feet/second in early January 2017. Arrows depict current direction on flood tides. Sacramento River net downstream flow was 30,000-50,000 cfs, which overwhelmed the flood tide. Light blue dots are flow gaging stations. Basemap source with gaging stations is DWR/CDEC.

Longfin Smelt Status – End of 2016

The longfin smelt population in the Bay-Delta reached a near record low index in 2016 (Figures 1 and 2).  The index was 7, slightly higher than the record low index of 4 in fall 2015.  There is a strong positive spawner (fall index two years prior) to recruitment (fall index) relationship (Figure 3).  Recruitment is strongly related to the number of spawners (likely the number of eggs spawned).  Recruits-per-spawner is also strongly influenced by wet or dry year conditions; in other words, first-year survival is higher in wetter years.  The poor fall 2015 and 2016 indices indicate that recruitment in 2017 and 2018 is likely to continue at record low levels.  Adult longfin (presumably some two-year-old spawners) were collected in the Bay trawl survey in December 2016.  Mid-January 2017 larval smelt surveys will be the first indication of recruitment into the population in 2017.  Water year 2017 has been a wet year to date, so some positive response in recruitment could potentially occur.

We will be keeping a close look at longfin recruitment in 2017, especially with new less stringent export restrictions mandated in recent legislation for the implementation of the two federal biological opinions that apply to Delta water project operations.  So far, no adult longfin have been collected in salvage at the south Delta export facilities.

sSouth Delta xEexport fish salvage facilities. Figure 1. Longfin smelt Fall Midwater Trawl indices 1967-2016. Source: CDFW.

Figure 1. Longfin smelt Fall Midwater Trawl indices 1967-2016. Source: CDFW.

Figure 2. Longfin smelt Fall Midwater Trawl indices 2000-2016. (Note: 2007=13; 2015=4; 2016=7) Source: CDFW.

Figure 2. Longfin smelt Fall Midwater Trawl indices 2000-2016. (Note: 2007=13; 2015=4; 2016=7) Source: CDFW.

Figure 3. Longfin smelt Fall Midwater Trawl Index (Recruits) vs two-year-prior index (Spawners), log10 scales. Wet years are blue labelled; dry years are red labelled.

Figure 3. Longfin smelt Fall Midwater Trawl Index (Recruits) vs two-year-prior index (Spawners), log10 scales. Wet years are blue labelled; dry years are red labelled.

Delta Smelt Status – End of 2016

The Delta smelt population in the Bay-Delta reached record or near-record low indices in 2016 (Figures 1-3), but ended the year with some promise of recovery (Figure 3). The December 2016 Kodiak Trawl Survey collected 214 Delta smelt in one of its nine trawls, and at least one Delta smelt was captured in each of the other eight trawls. Fall 2016 has been wet following a below normal water year 2016 (October 2015 – September 2016), which followed the 2012-2015 drought.

Some early insight into this apparent resurgence in the 2017 index can be gained by reviewing the relationship between the Fall Midwater Fall Index and the subsequent Winter Kodiak Trawl Index (Figure 4). There is a strong positive stock (previous fall index) to recruitment (winter index) relationship with three apparent outliers (2009, 2016, 2017). The poor fall 2015 and 2016 indices resulted in strongly contrasting winter recruitment (winter 2016 and 2017 indices). This likely reflects the benefits of a wet fall of 2016 to the 2017 index (Dec. 2016 survey), as compared to the dry fall of 2015 and subsequent poor 2016 index.

Water year 2015 was a critically dry year with extremely low flows. In contrast to 2015, critically dry year 2008 with its low fall index produced a strong winter 2009 index. The strong showing in the winter of 2009 may have been due to the extremely low December (2008) and January (2009) exports, combined with relatively high Delta outflow pulses, a pattern that rarely occurs after a critically dry year. We will be keeping a close look at how the apparent resurgence plays out in 2017, especially with new less stringent export restrictions mandated in recent legislation for the implementation of the two federal biological opinions that apply to Delta water project operations.

Figure 1. Summer Townet Index for Delta smelt 1969-2016.

Figure 1. Summer Townet Index for Delta smelt 1969-2016.

Figure 2. Fall Midwater Trawl Index for Delta smelt 1967-2016.

Figure 2. Fall Midwater Trawl Index for Delta smelt 1967-2016.

Figure 3. Winter Kodiak Trawl Index of Delta smelt 2002-2016, including December 2016 (Water Year 2017). December surveys were not conducted from 2002 to 2014.

Figure 3. Winter Kodiak Trawl Index of Delta smelt 2002-2016, including December 2016 (Water Year 2017). December surveys were not conducted from 2002 to 2014.

Figure 4.  Winter Kodiak Trawl Index versus previous fall Midwater Trawl Index of Delta smelt (log scales) 2002-2016.  The 2017 winter index is from Dec 2016 survey only and does not include Jan-Mar 2017 survey results as yet, thus it will likely be even higher than shown.

Figure 4. Winter Kodiak Trawl Index versus previous fall Midwater Trawl Index of Delta smelt (log scales) 2002-2016. The 2017 winter index is from Dec 2016 survey only and does not include Jan-Mar 2017 survey results as yet, thus it will likely be even higher than shown.