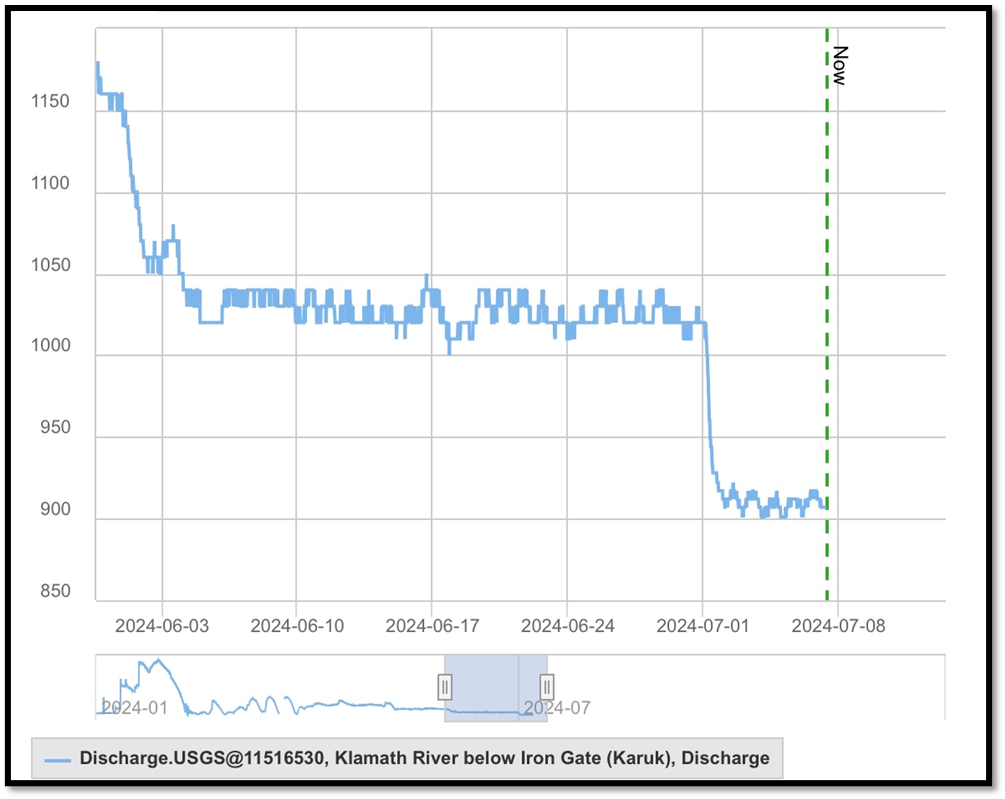
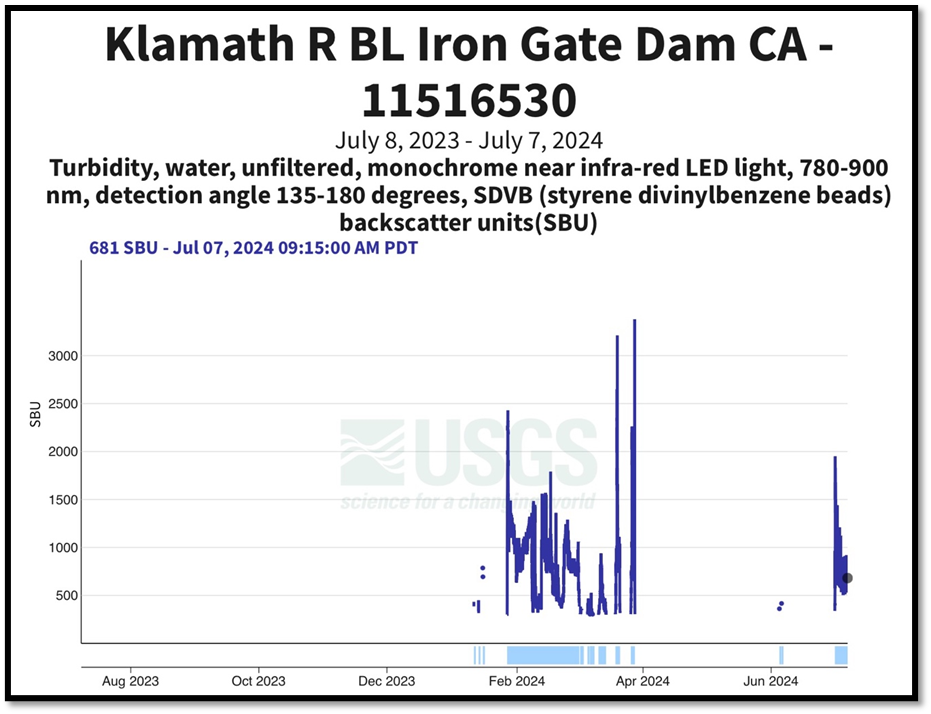
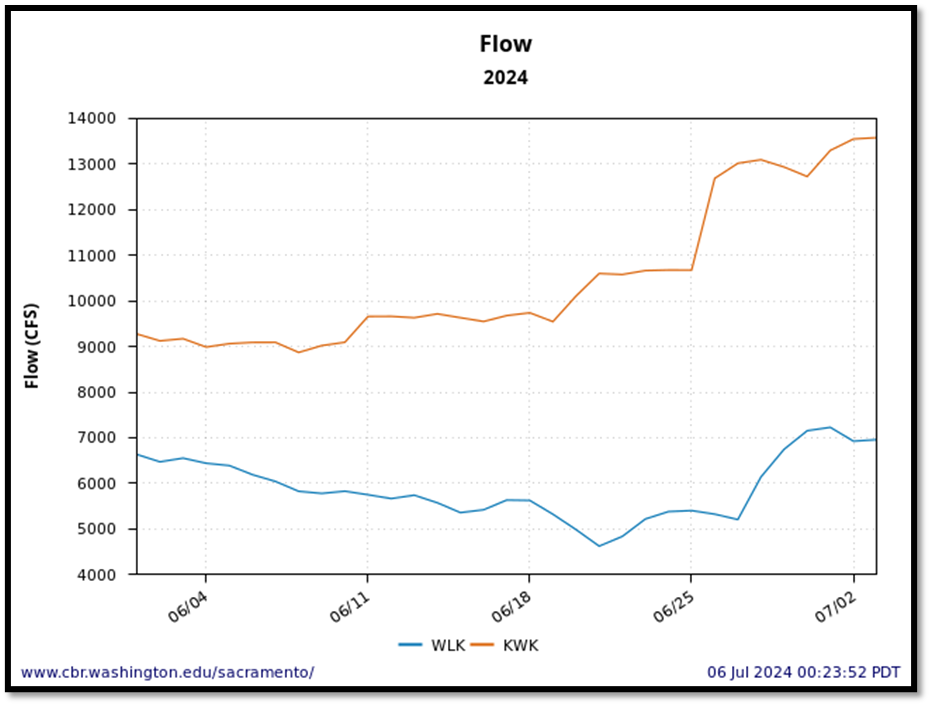
It is the first summer without the reservoirs on the Klamath River. Upper river flows at Iron Gate are now at summer lows (900 cfs, Figure 1). The flow, water temperature, and turbidity in the river without the reservoirs (the dams have not all been removed) is shown in the following figures. Two major concerns are sporadic turbidity events from dropping flows and higher water temperatures that are a consequence of unshaded former reservoir reaches and loss of cold-water dam releases.
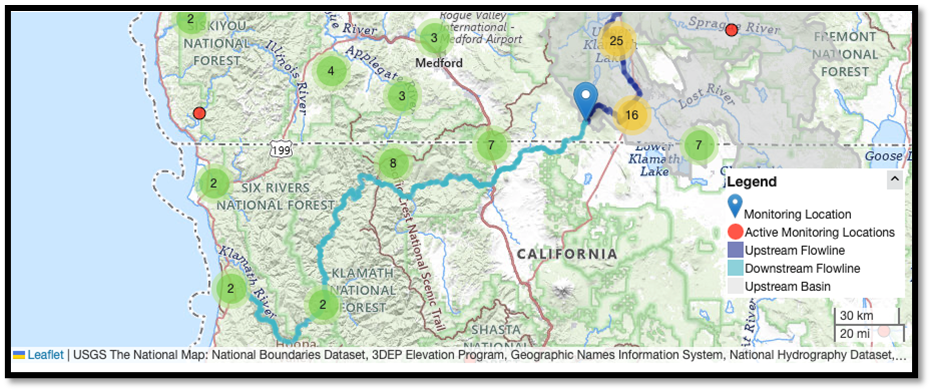
Extensive gaging data are available for the lower Klamath River from the USGS and Karuk Tribe (Figure 2). The focus here is on the reach below the four-dam-removal project where the dams were drained in early 2024, leaving the river free-flowing.
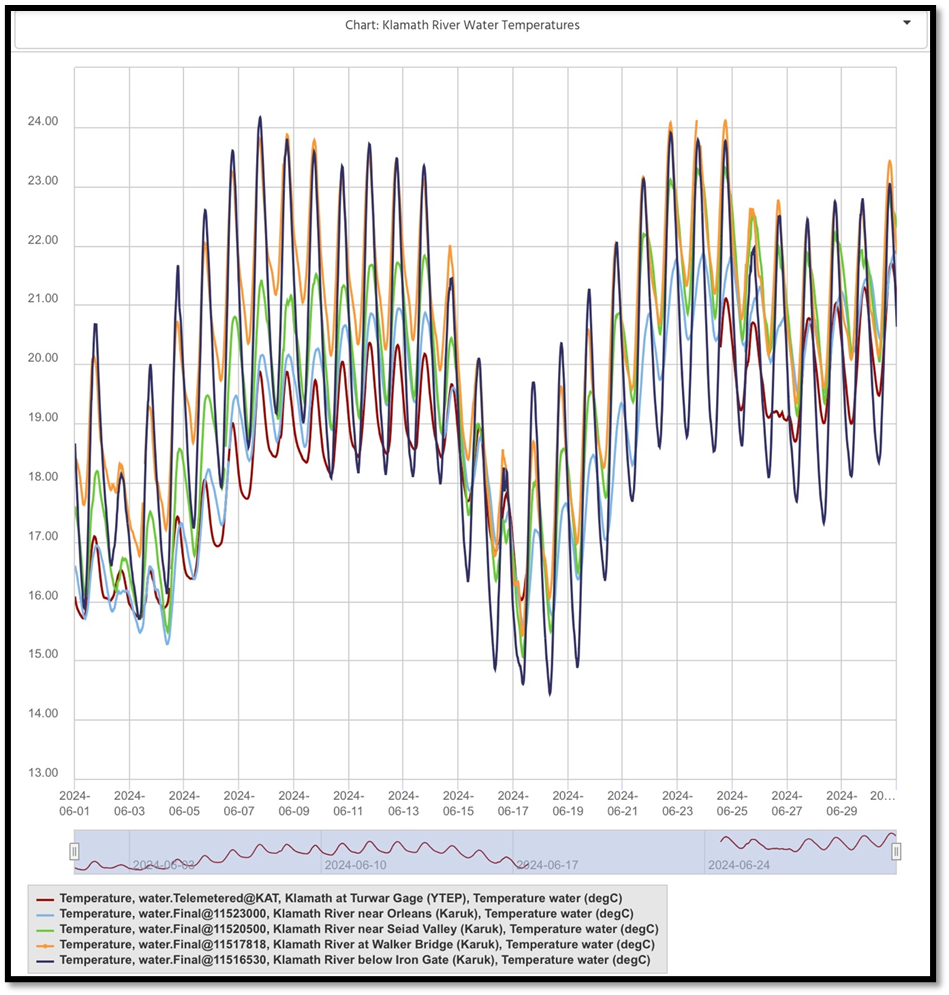
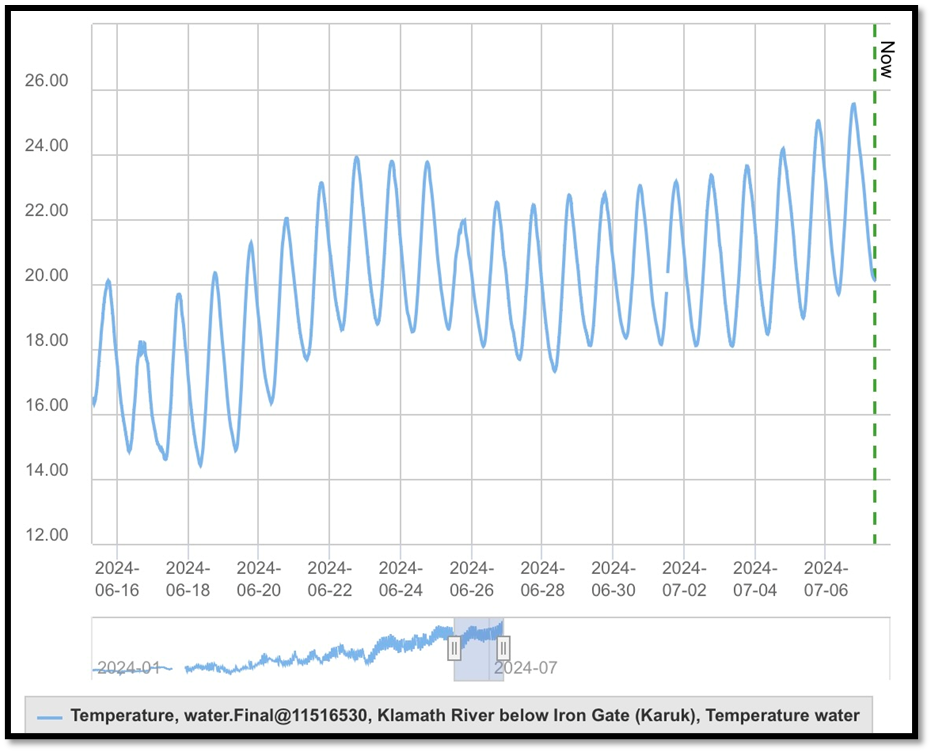
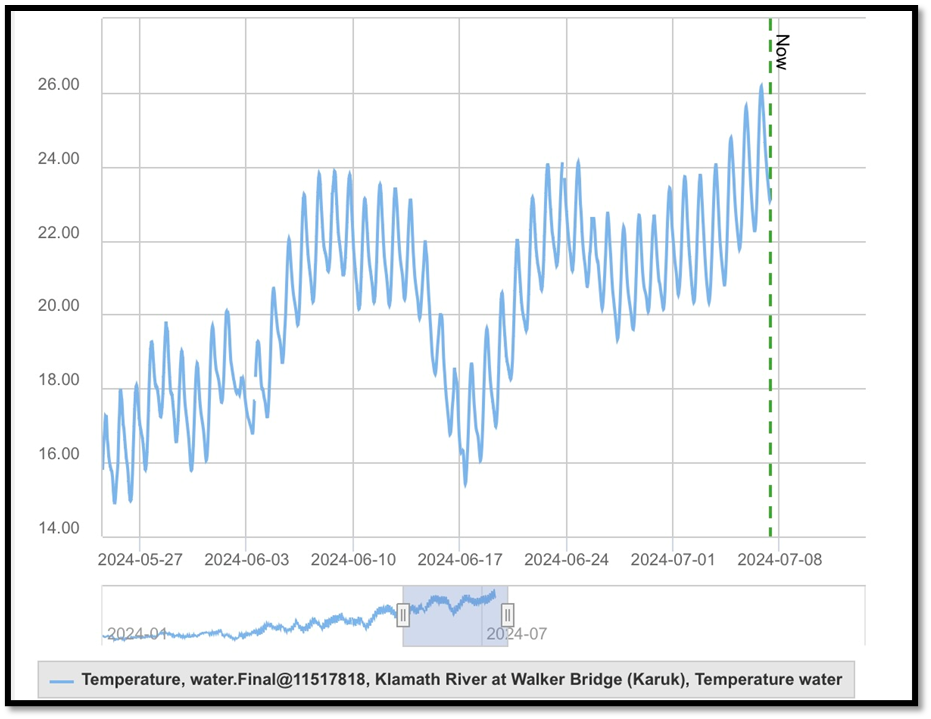
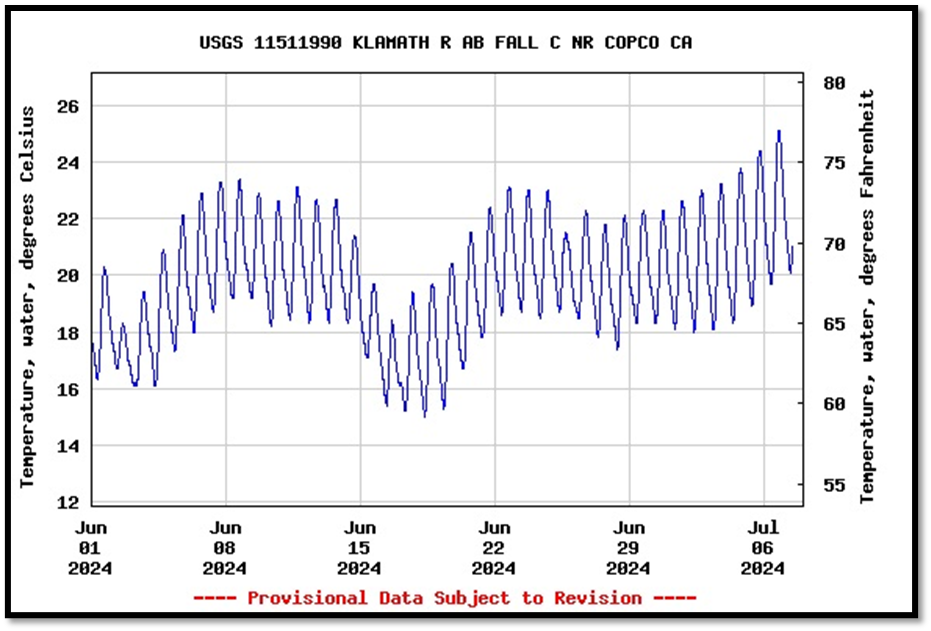
Late spring and early summer gage data show the upper reaches below Iron Gate had the warmest water in 2024 (Figures 3-5). Water temperatures reached 25oC/77oF, lethal to salmonids. Further downstream, water temperatures were gradually cooler as the river progressed toward the mouth, generally remaining in the 68-70oF maximum range after receiving cool tributary water and cooler air temperatures. Further upstream above Iron Gate, water temperatures were similar those immediately below Iron Gate (Figure 6).
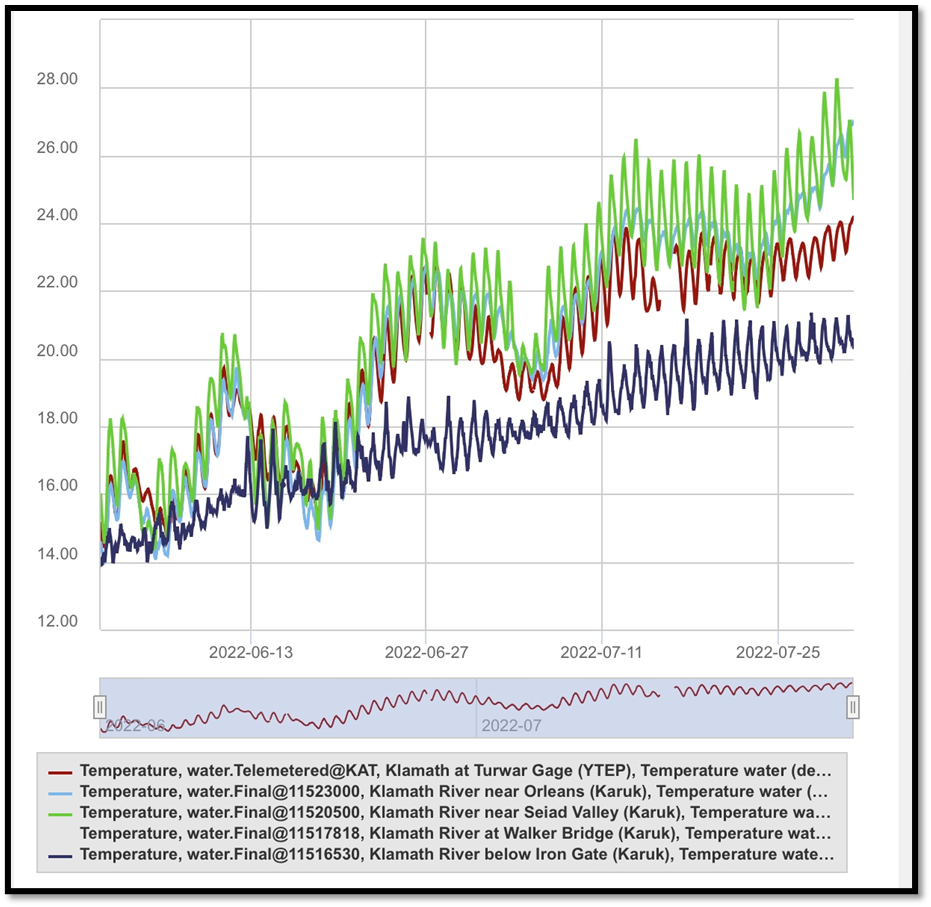
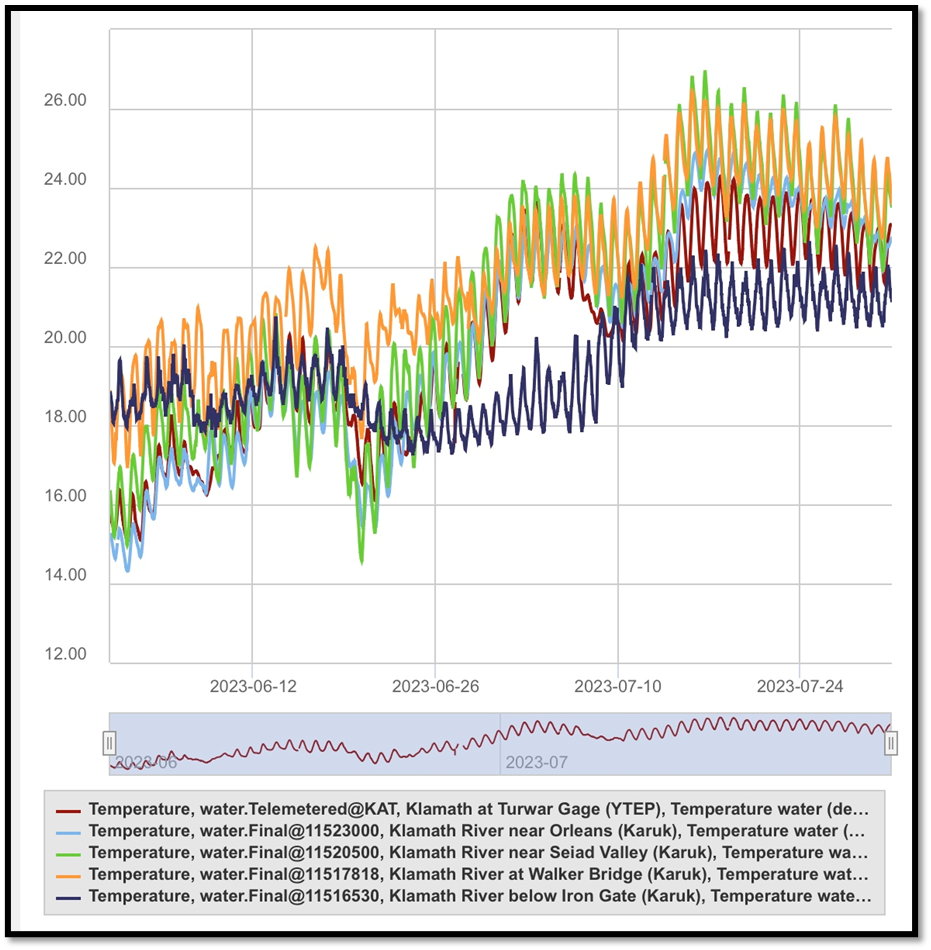
Prior to dam removal, the upper reaches below Iron Gate had the lowest water temperatures in 2022 and 2023 (Figure 7 and 8), reflecting the release of cold water from the bottom of Iron Gate Reservoir. Without this source of cold water, the upper reaches are now significantly warmer in late spring and summer.
Because the water temperatures were similar in 2024 above and below the former Iron Gate Reservoir (see Figures 4 and 6), there seems to be little warming in the unforested former Iron Gate reservoir reach. The upper reach of river below Iron Gate Dam now generally reflects historic warm water characteristics of the 6-dam project reach between Klamath Lake and Iron Gate Dam. Future riparian forest restoration of the three former reservoir reaches may lead to some cooling of the upper river in the future.
Finally, the drop in river flow in early July 2024 (see Figure 1) appears to have caused additional reservoir-footprint erosion and scouring, leading to high turbidity levels below Iron Gate (Figure 9). Such turbidities like the warm water are generally lethal to salmonids.
Figure 1. Upper Klamath River flow at Iron Gate gage in June and early July 2024.
Figure 2. Lower Klamath River gauging stations from Klamath Lake downstream to mouth. Blue marker denotes gage below JCBoyle Dam. Numbers in green and yellow circles denote multiple gage locations.
Figure 3. Water temperatures in lower Klamath River in June 2024. Iron Gate Dam is uppermost location and Turwar Gage is lower-most location near mouth. Note greatest water temperatures were recorded from the two uppermost reaches: Iron Gate and Walker Bridge.
Figure 4. Water temperature recorded at Iron Gate gage 6/15-7/7 2024.
Figure 5. Water temperature recorded at Walker Bridge gage 5/20-7/7 2024.
Figure 6. Water temperature recorded at Fall Creek gage 6/1-7/7 2024.
Figure 7. Water temperatures in lower Klamath River in June-July 2022. Iron Gate Dam is uppermost location and Turwar Gage is lower-most location near mouth. Note lowest water temperatures were recorded from the two uppermost reaches: Iron Gate and Walker Bridge.
Figure 8. Water temperatures in lower Klamath River in June-July 2023. Iron Gate Dam is uppermost location and Turwar Gage is lower-most location near mouth. Note lowest water temperatures were recorded from uppermost reach: below Iron Gate.
Figure 9. Turbidity (suspended sediment) concentrations measured at Iron Gate Gage in 2024. Note original reservoir drawdown and subsequent reservoir sediment deposit erosion January-
In Above Normal water year 2024, an increase in summer freshwater flows released from reservoirs to the Bay-Delta estuary has proven a viable action to reduce threats to Central Valley fishes. Water management actions in early July heat waves alleviated extreme water temperatures that threaten the native fishes in rivers and the Bay-Delta. These actions can be described as adaptive management experiments to test their potential performance for the update of the State Board’s Bay-Delta Plan.
Actions
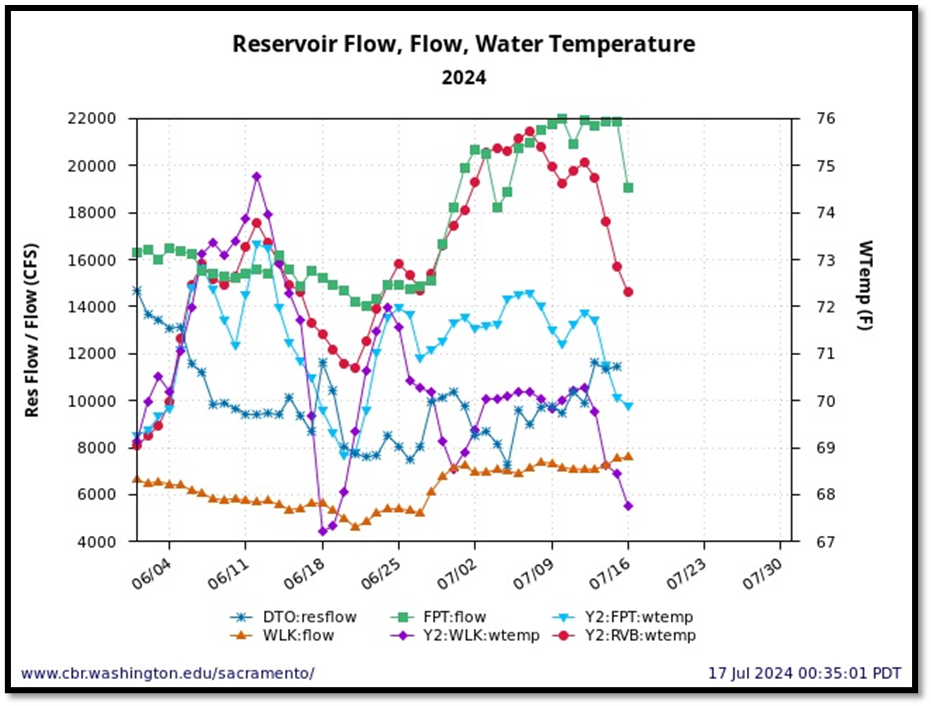
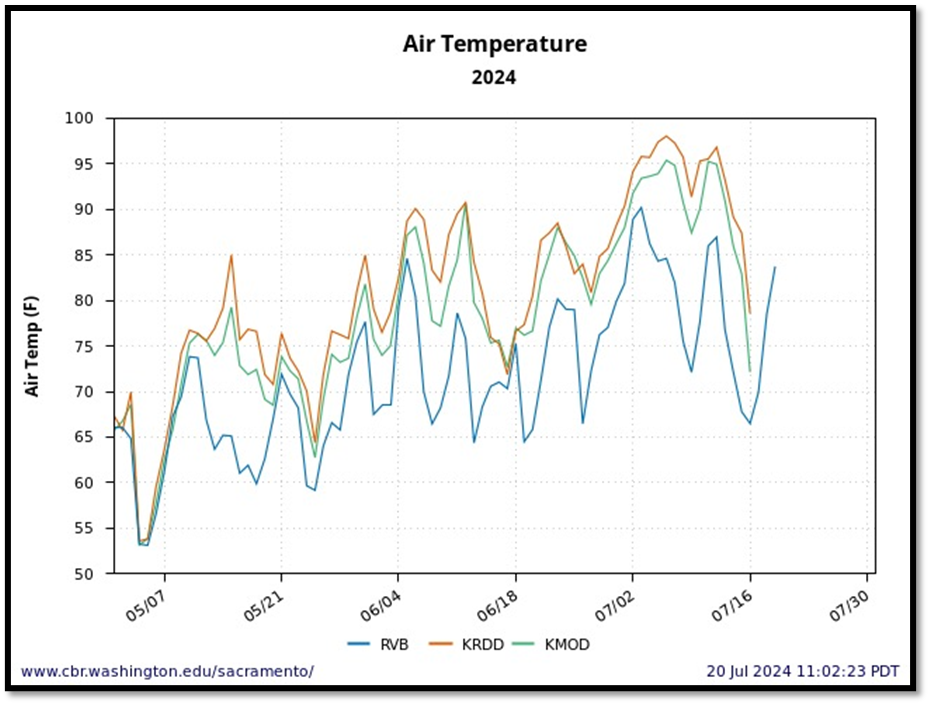
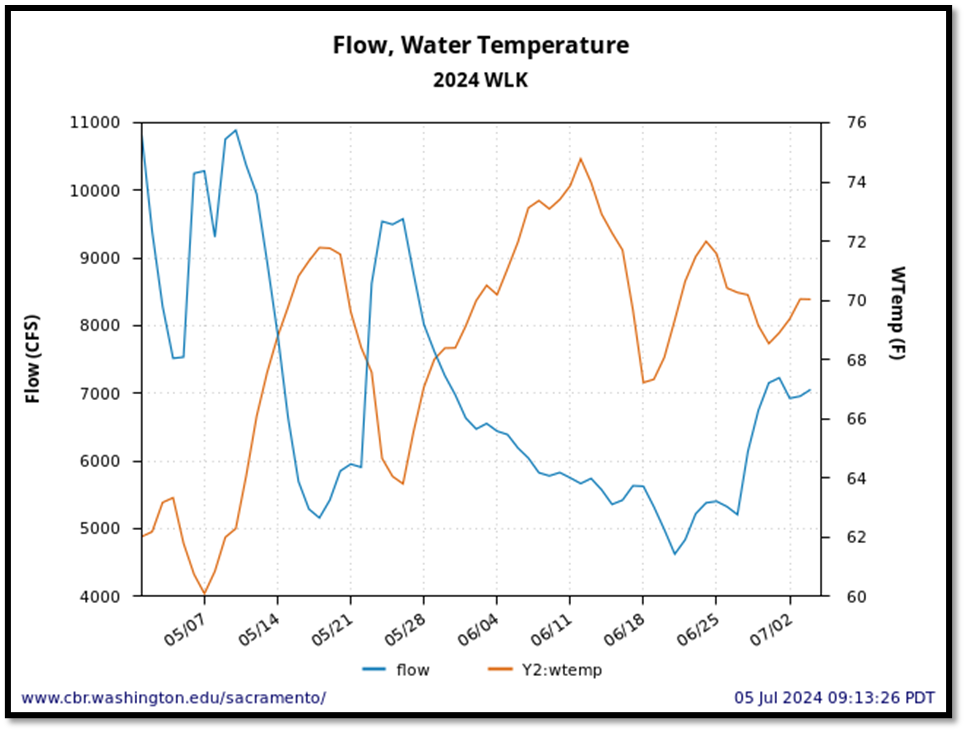
Increasing lower Sacramento River flow from 5000 cfs to near 8000 cfs has helped lower Wilkins Slough gage (WLK) water temperatures from 70-72oF to the water quality standard of 68oF (Figure 1), despite record-high air temperatures (Figure 2).
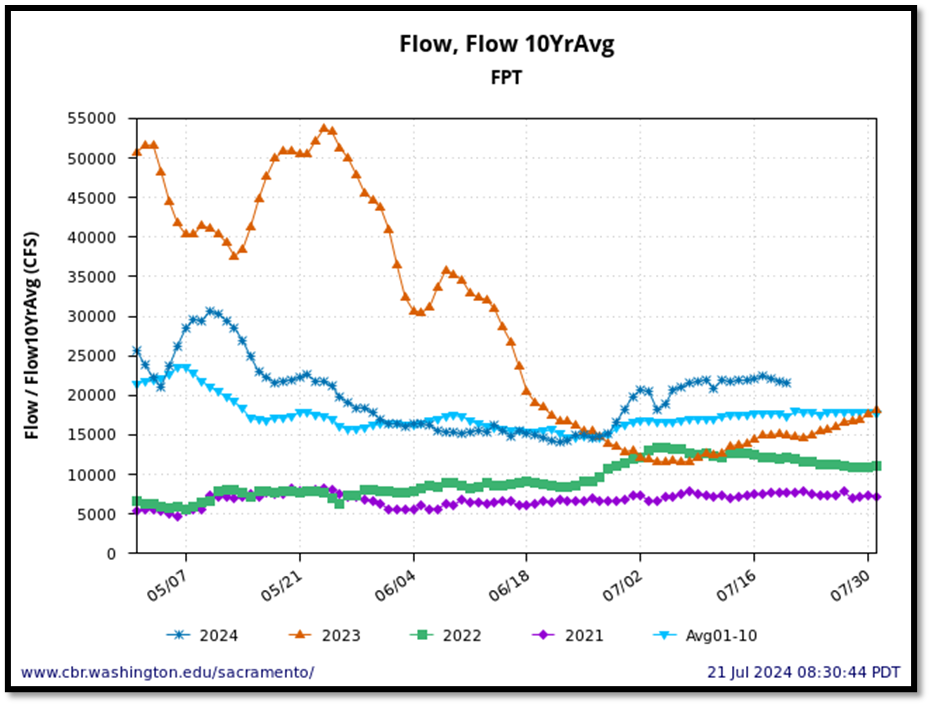
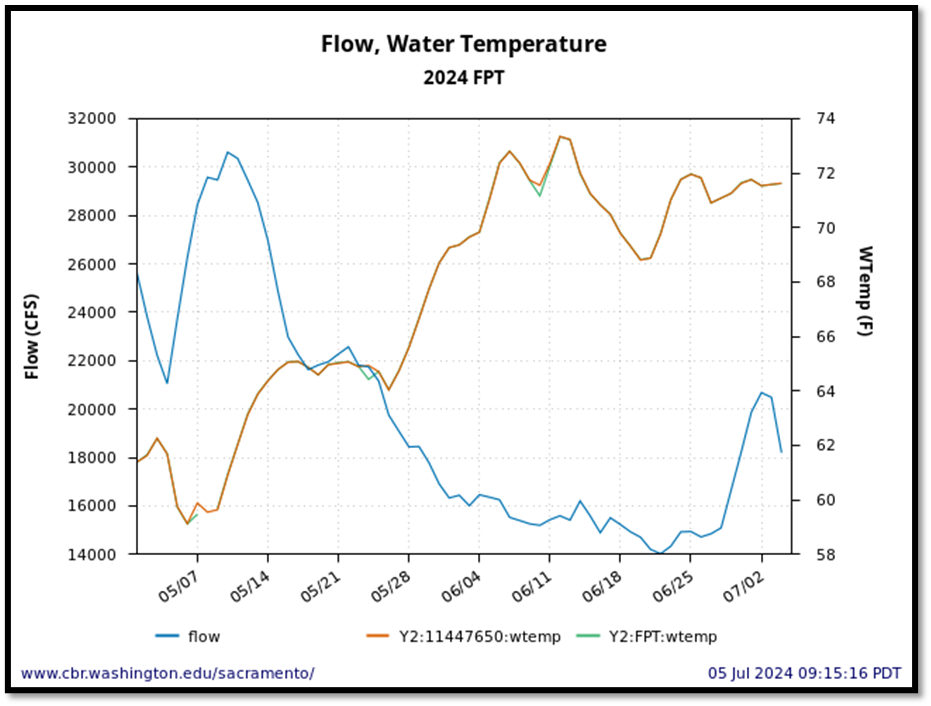
Increasing Delta inflow at Freeport (FPT) from 14,000 cfs to 20,000-22,000 cfs (a combination of increased Wilkins Slough, Feather River, and American River flows) has lowered Freeport water temperatures in the north Delta from 72oF to 70oF (Figure 1).
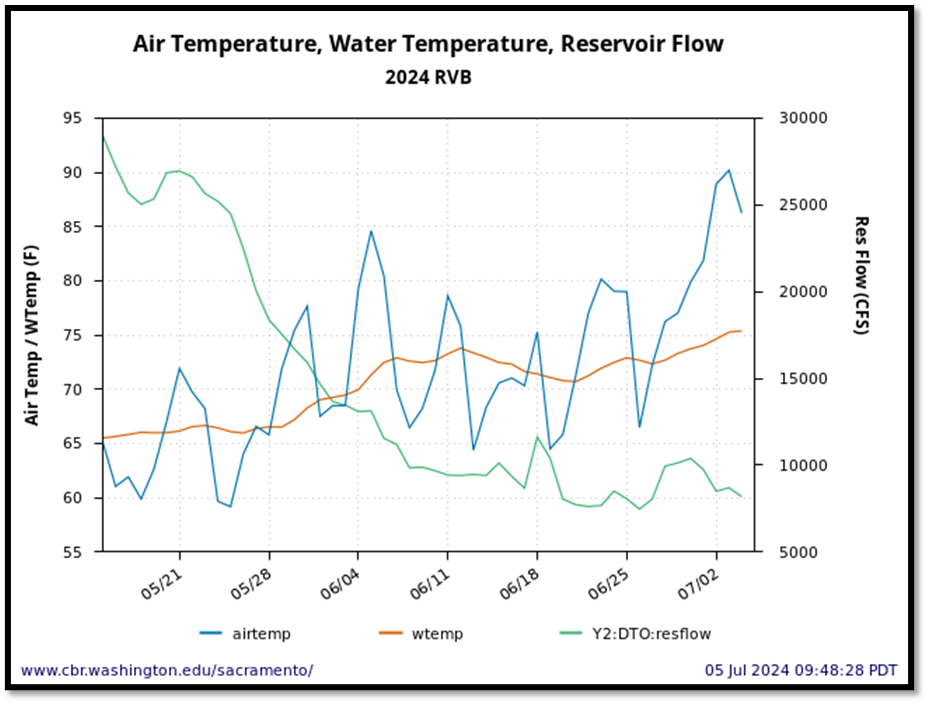
A rise in Delta outflow from 8,000 cfs to 12,000 cfs has helped reduce Rio Vista (RVB) water temperatures at the Delta’s exit to the Bay from 75-76oF during the early July heat wave to 72oF after the heat wave (Figure 2).
Benefits
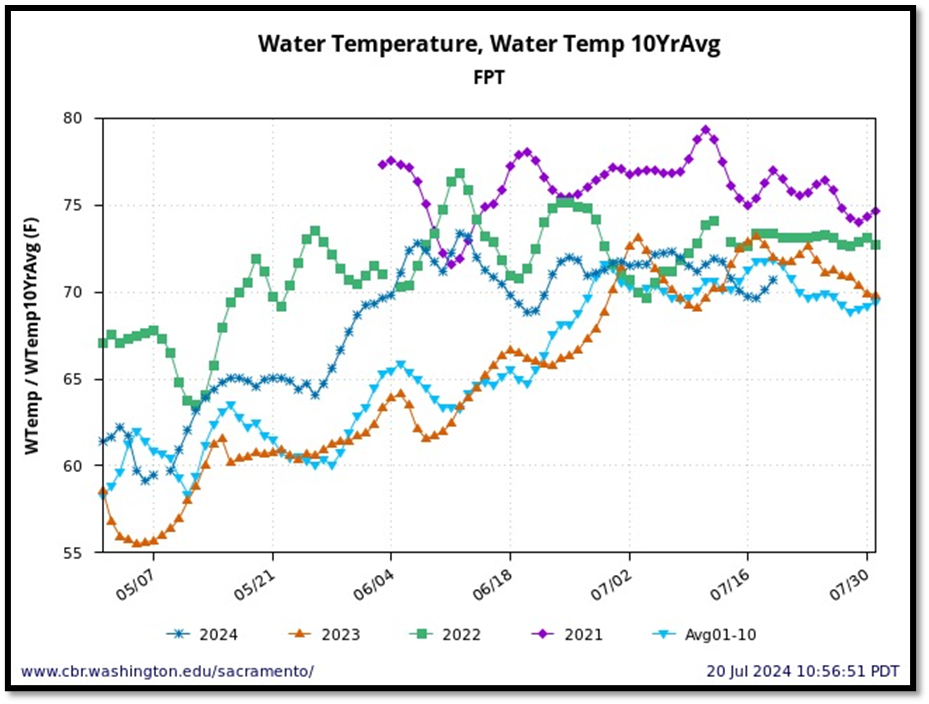
The actions may not seem that dramatic, but they are very important to the river, Delta, and Bay environments and to the salmon, smelt, steelhead, sturgeon, and other native Central Valley fishes that depend on these habitats. Water temperatures in the 72-75oF range are highly stressful or lethal to these native fishes. Such temperatures favor non-native predatory and competing fishes. Water temperatures of 68-72oF are at the upper favorable limits for the native fish and are necessary to maintain viable growth, survival, and reproduction. These temperatures also help ensure that dissolved oxygen is adequate and that algae blooms do not reach excessive levels. In other words, they promote a healthier ecosystem. Water temperatures near or above 75oF, which occurred in the Delta of drought years 2021 and 2022 (Figure 3) under extreme low flows (Figure 4), are deadly to native Delta fishes.
Conclusion
Although water managers in 2024 probably did not have these bold actions in mind to save fish (flows were increased to allow maximum summer water diversions from the Delta), their fortuitous implementation clearly highlights early summer flow measures that should be included in the update of the Bay-Delta Plan. Two additional actions I would recommend are higher flows in the San Joaquin River to provide some minimal benefit to the San Joaquin’s native fish community, and reductions in water exports.
Figure 1. DTO = Delta Outflow to the Bay, FPT = Sacramento River Freeport gage, WLK = gage below Wilkins Slough on lower Sacramento River upstream of the Delta, RVB = Rio Vista Bridge in Sacramento River channel northwest Delta, near entrance to eastern Bay.
Figure 2. Average daily air temperatures at Red Bluff (KRDD) in Sacramento Valley, Modesto (KMOD) in San Joaquin Valley, and Rio Vista Bridge (RVB) in west Delta May-July 2024. Note Delta air temperatures are generally 5-15oF lower in the Delta than the valleys. Also note the record or near-record air temperatures in early July.
Figure 3. Average daily water temperatures in the north Delta channel of the Sacramento River at Freeport May-July 2021-2024 and average of years for decade 2001-2010.
Figure 4. Average daily (tidally filtered) streamflow in the north Delta channel of the Sacramento River at Freeport, May-July 2021-2024 and average of years for decade 2001-2010.
This is a follow-up to a July 8 post on summer 2024 aquatic habitat conditions in the Bay-Delta Estuary. In this post, I focus on mid-July conditions after yet another summer heat wave. I am concerned that conditions are building for yet another sturgeon die-off this summer. Sturgeon mortality is caused by excessively warm water and algae blooms that eventually lead to rapid algae die-off and associated extremely low dissolved oxygen levels (<5 mg/l) throughout the Bay. Such conditions became acute in summer of drought year 2022 and led to the deaths of thousands of adult sturgeon and other Bay fishes.
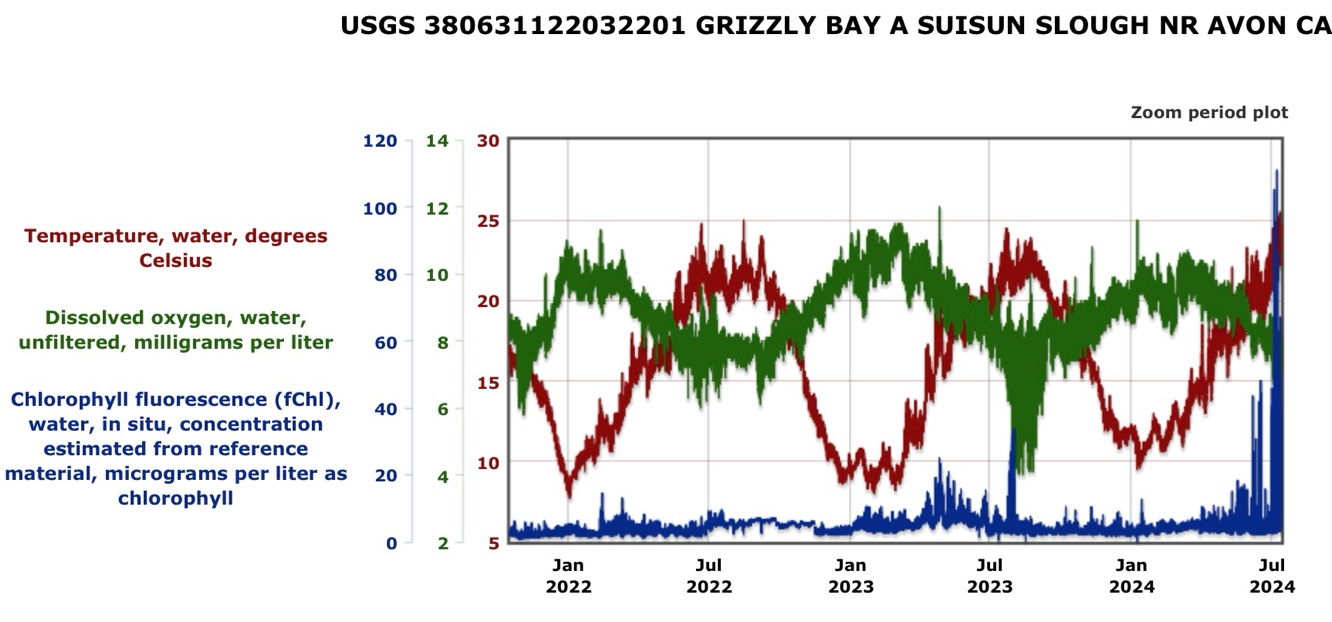
Conditions in the Bay are already worse this year at the beginning of summer than in 2022 or 2023 (Figure 1). Water temperatures and chlorophyll concentrations are higher, with dissolved oxygen concentrations falling.
Figure 1. Water temperature (C), dissolved oxygen (mg/l), and chlorophyll concentration (micrograms per liter) in Grizzly Bay 2022-2024.
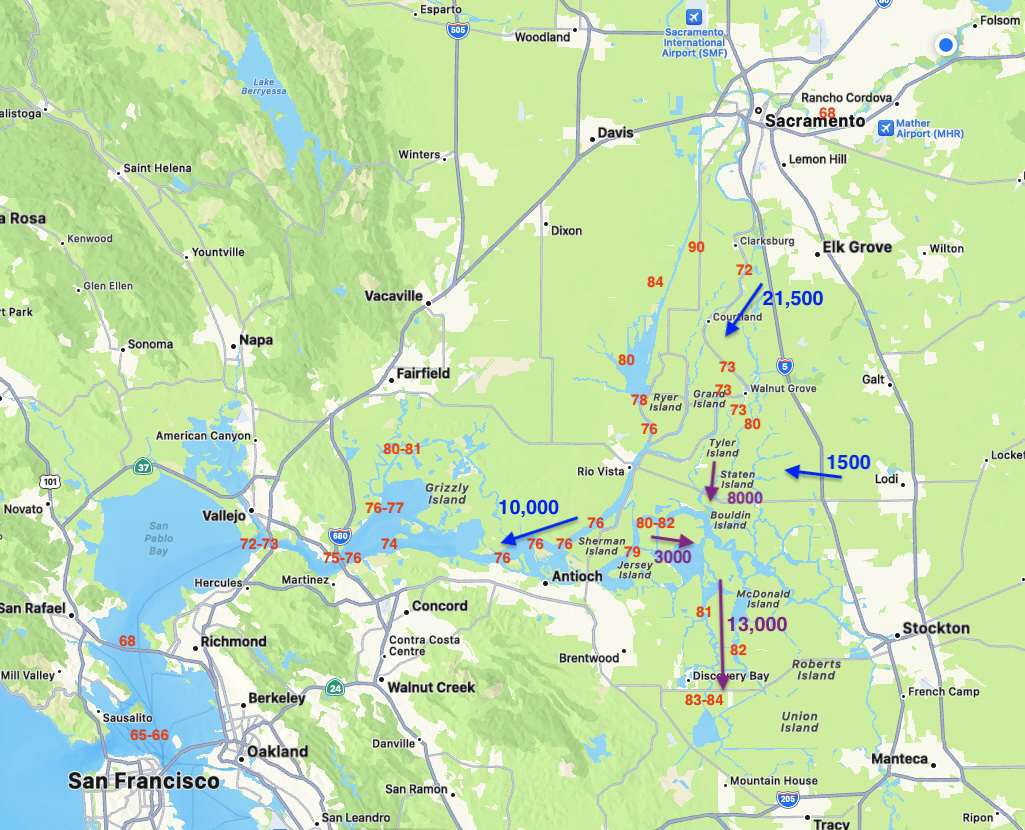
Of greatest concern is the already warm water temperatures in parts of the Bay-Delta despite a relatively high Delta inflow with cooler than normal water temperatures (Figure 2). Water temperatures have exceeded 75oF in the west Delta and east Bay low-salinity zone of the estuary (the prime summer habitat of endangered Delta smelt). Water temperatures of 75-77oF (24-25oC) are lethal to Delta smelt.1
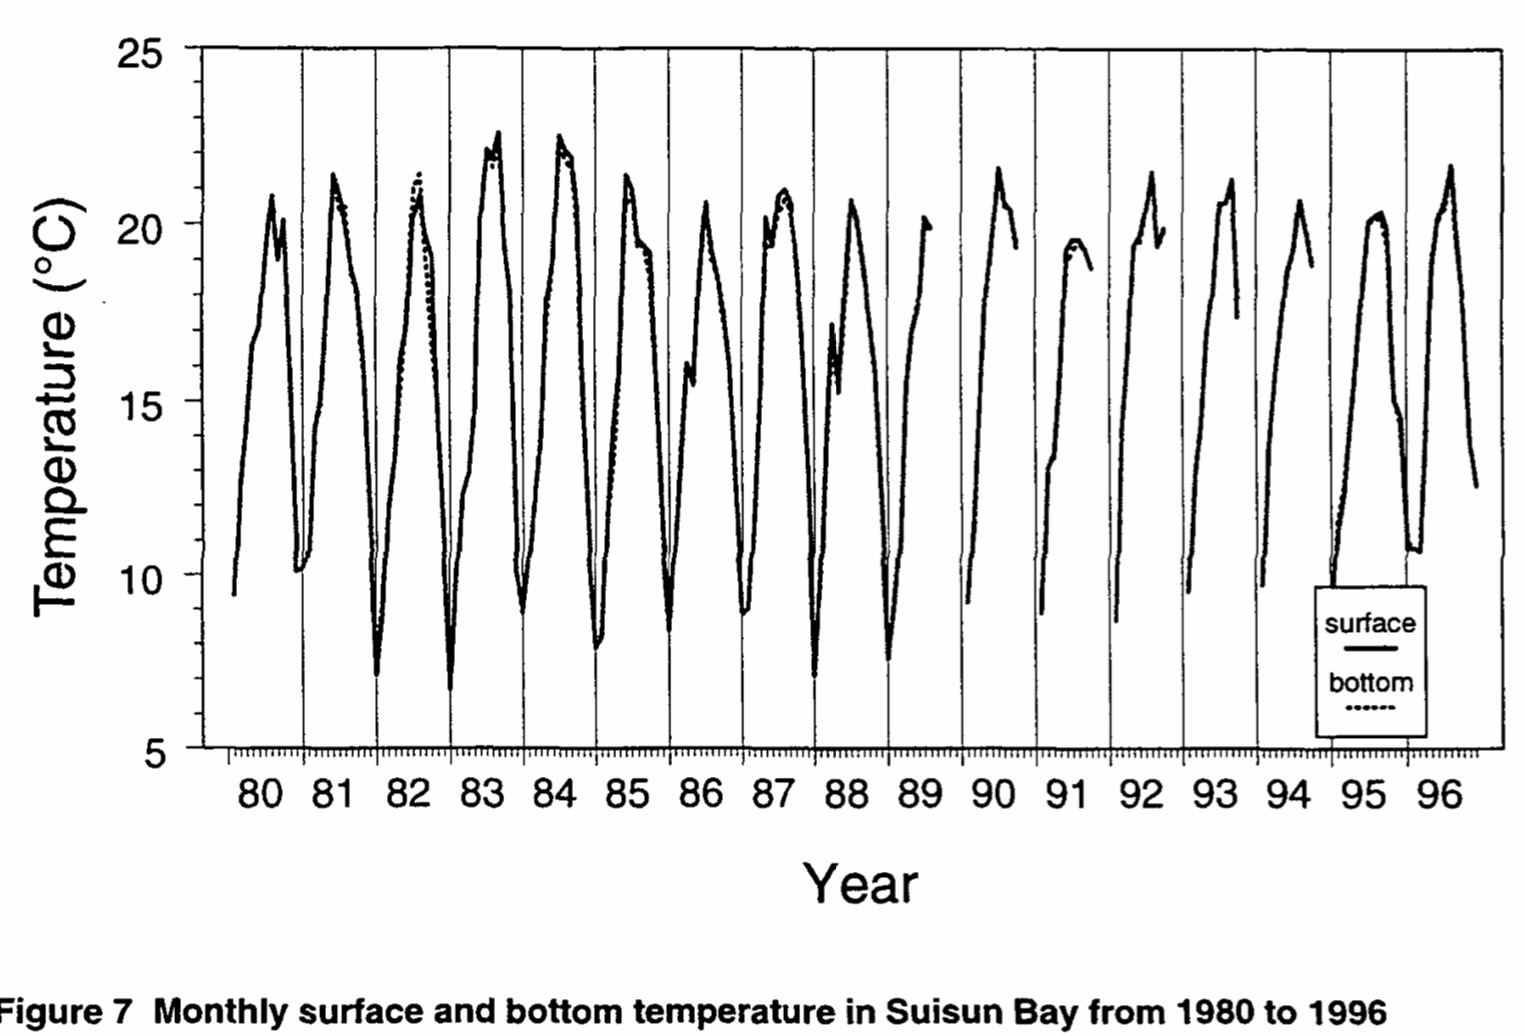
In the decades of the 80’s and 90’s, Delta smelt were still relatively abundant although suffering severely in drought years. Water temperatures rarely exceeded 70oF in Suisun Bay (Figure 3). The reason for the difference is likely a combination of higher air temperatures, lower Delta outflows, and higher Delta water diversions in recent decades. In some years lower, warmer Delta inflows aggravate the problem, but not this year (2024) when inflows were kept high to sustain high Delta water diversions.
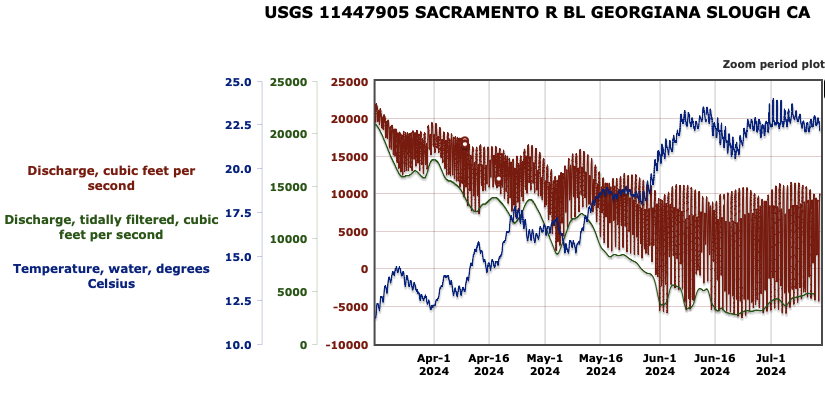
One area of warming of the lower Sacramento River channel that deserves special attention is the north Delta below the Delta Cross Channel and Georgianna Slough bifurcation. Much of the water destined for south Delta exports is diverted from the Sacramento River through these channels. In the reach below the diversion channels the river temperature increased several degrees (73 to 76oF) in early July. One explanation is that of the 21,000 cfs Delta inflow at Freeport only 5000 cfs remained below the entrance to Georgianna Slough (Figure 4). The missing flow passed into Georgianna Slough, the Delta Cross Channel, and Miners/Steamboat Sloughs, all reaches where the flow warmed to even a greater degree. At Rio Vista and the west Delta, where the water exits the Delta for the Bay, water temperatures reached 76oF as total outflow increased to 10,000 cfs from the 5000 cfs in the lower Sacramento River channel and 5000 cfs returning warmer water from the Cache Slough complex and San Joaquin River channel. Waters in the wide, large, open channel at Rio Vista also slowed, with a stronger influence of the tides, especially during the recent heat waves (Figure 5).
I contend that the high rate of Delta water diversion at Georgianna Slough and the Delta Cross Channel contributed to the warming by forcing cooler water from the Sacramento River Delta inflow into the central Delta where it warmed or was diverted.
I recommend closing the DCC and reducing Delta water diversions in July and August to reduce Bay-Delta water temperatures and minimize the potential for excessive algae blooms, low dissolved oxygen, and sturgeon die-offs in the Bay this summer. I further recommend that Delta inflows be sufficient to maintain water quality standards for water temperatures in the lower Sacramento River above the Delta.
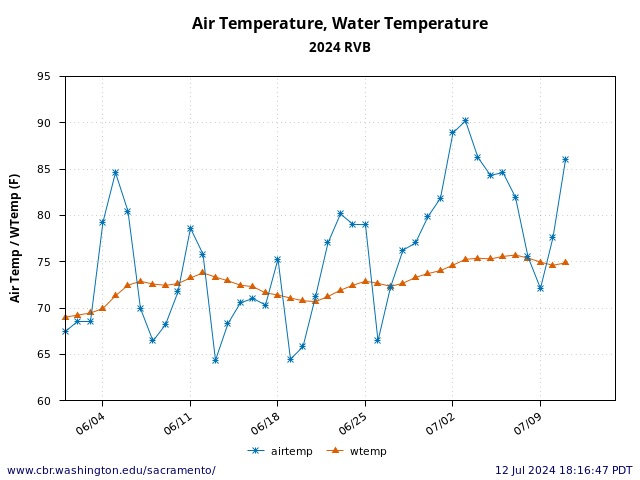
Figure 2. Bay-Delta conditions showing daily average flows in blue and purple, maximum daily water temperatures in red on or about July 12, 2024.Figure 3. From Baxter et al 1999 Figure 7.Figure 4. Sacramento River flow and water temperature downstream of the entrance to Georgianna Slough, April-July 2024. Note the effect of two closures of DCC in early June that forced more water down the Sacramento River channel cooling the river below slightly. Opening of the DCC at the beginning of June reduced flow and increased water temperature in the river below Georgianna Slough. Note also that at the lower net flows, the effect of the tides was greater, slowing transit net flow rate, which likely increased the rate of warming.Figure 5. Air and water temperature at Rio Vista Bridge June 1 to July 1, 2024. Note the 1 to 2.5oF influence of heat waves on water temperature. The heat wave at the beginning of July with an average daily temperature of 90oF is exceptional for Rio Vista.
It is unlikely Delta smelt would survive extended periods above 72oF; they would not do well in water temperatures above 68oF. ↩
This is an update on my last several posts on spring habitat conditions in the Bay-Delta in this Above Normal water year. After a wet winter-spring with good Delta and Bay conditions in Above Normal water year 2024, June 2024 water project operations returned the river, Delta, and Bay to drought-year conditions. I warned in late June that habitat conditions (flows and water temperatures) were getting bad and that a forecasted heat wave could make conditions even worse. It’s happened.
The State Water Project (SWP) and the Central Valley Project (CVP) started moving water south in earnest at the beginning of July. Shasta, Oroville, and Folsom reservoir releases increased, raising Delta inflow at Freeport to 20,000 cfs (Figure 1). SWP south Delta exports are at maximum at 6,000 cfs (Figure 2). CVP south Delta exports were already maxed out at 4,000 cfs. The Sacramento River contractors also removed their portion of the Shasta pie (6,000 cfs, Figure 3), to make the total water project haul from the Sacramento Valley 16,000+ cfs. Note this total does not include water diverted upstream of the Delta from Sacramento tributaries or from the San Joaquin River and its tributaries.
Impact to Freeport Water Temperature
On the positive side, the increased Delta inflow at Freeport dropped water temperatures slightly at Freeport as the heat wave commenced (Figure 4). I contend that the water temperature would have increased significantly with heat wave if the flow had not increased.
Impact to Rio Vista Water Temperature
On the negative side, the main problem from the state action was increased water temperature at Rio Vista (to 75oF) due to the combination of higher south Delta exports, high air temperatures, and lower Delta outflow (Figure 5). I contend that slightly higher Delta inflows and lower south Delta exports (thus, higher Delta outflow and higher net Rio Vista flows) could have kept Rio Vista water temperatures closer to 72oF.
Impact to Lower Sacramento River Water Temperature
On the positive side, the increased flow in the lower Sacramento River from the Shasta Reservoir releases (see Figure 1) kept lower Sacramento River water temperatures from increasing during the heat wave (Figure 6). That experiment proved the potential benefit of such an action on its own
Impact to Bay Water Temperature
Bay water temperature during the early July heat wave also increased to 74-75oF during ebb tides, as warm Delta (Rio Vista) water entered the eastern Bay (Figures 7 and 8). On flood tides, cooler 68-70oF water returned to the eastern Bay. After several days of these conditions, the eastern Bay warmed by 2-3oF. I contend that if Delta outflow had not dropped to 8000 cfs with the higher south Delta exports, and the Delta (Rio Vista) had thus been maintained closer to 72oF, that Bay temperatures would have been several degrees cooler (likely less than 72oF).
Conclusion
The State Water Project should not have started full transfer of Sacramento Valley reservoir water to southern California via its south Delta export pumps during an early July heat wave. Such action compromised San Francisco Bay’s already-stressed environmental conditions, which could lead to fish die-offs in the Bay again this summer.
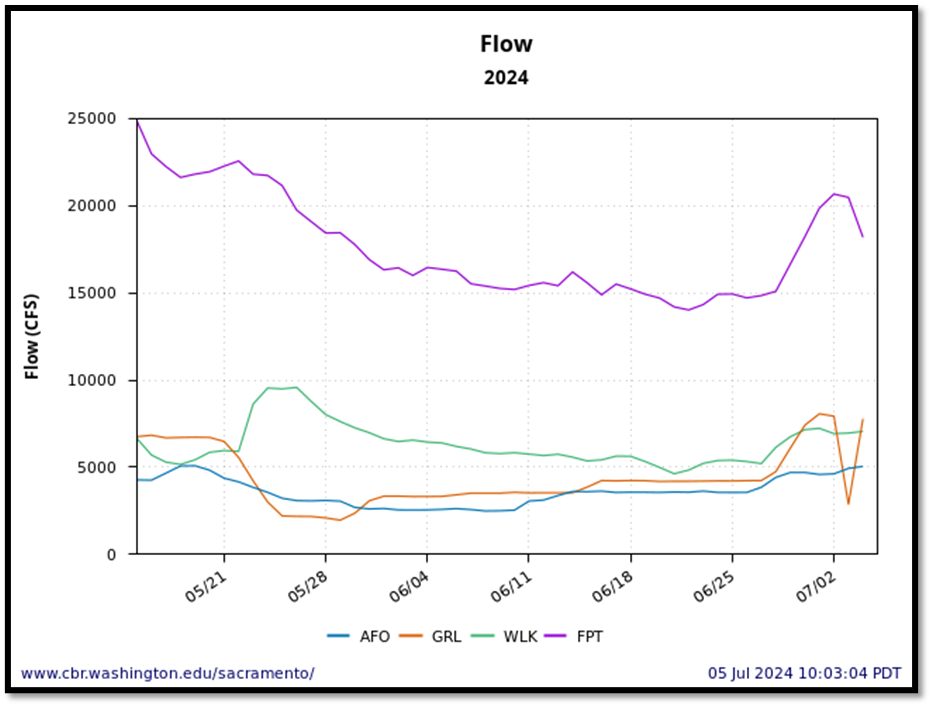
Figure 1. American (AFO), Feather (GRL), and Sacramento River (WLK) flows, making up Delta inflows at Freeport (FPT) May 15-July 5, 2024.
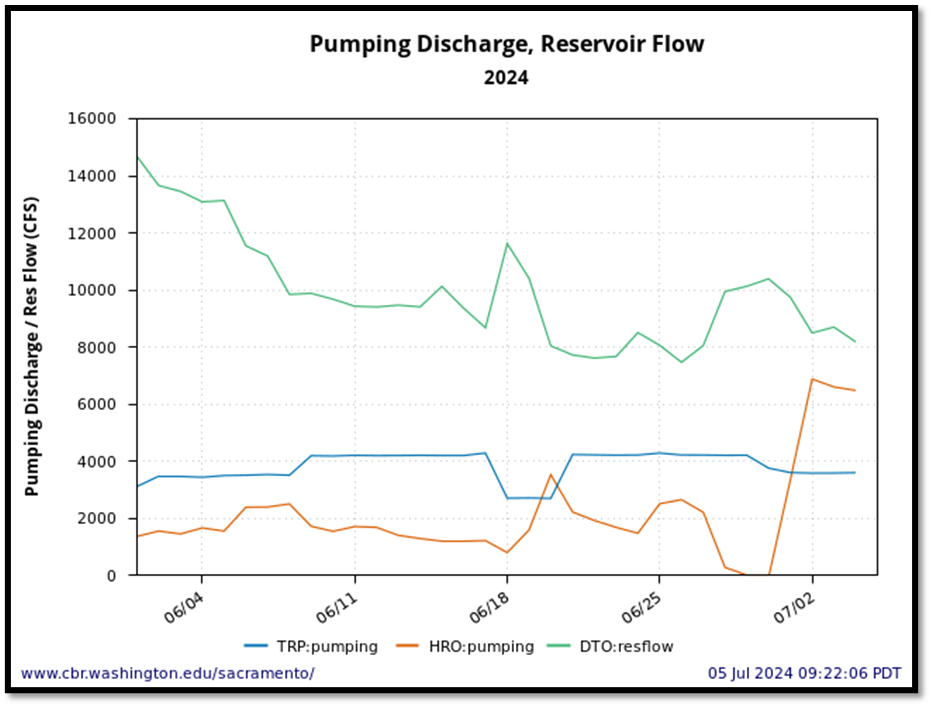
Figure 2. Delta outflow (DTO) and CVP’s Tracy (TRP) and SWP’s Harvey Banks (HRO) export rates 6/1-7/5, 2024.
Figure 3. Sacramento River June 2024 streamflows at Keswick Dam (RM 300) and Wilkins Sough (RM 120) gages. Diversion loss equals difference plus above-Wilkins tributary inputs.
Figure 4. Sacramento River channel flow and water temperature at Freeport (FPT), 5/1-7/5 2024.
Figure 5. Water and air temperature at Rio Vista Bridge gage with Delta Outflow 5/15-7/5, 2024.
Figure 6. Sacramento River channel flow and water temperature at Wilkins Slough (WLK), 5/1-7/5 2024.
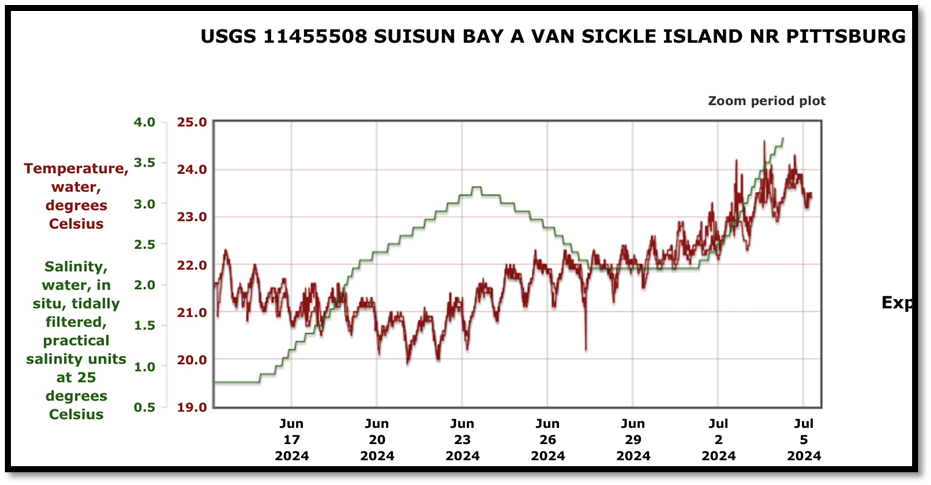
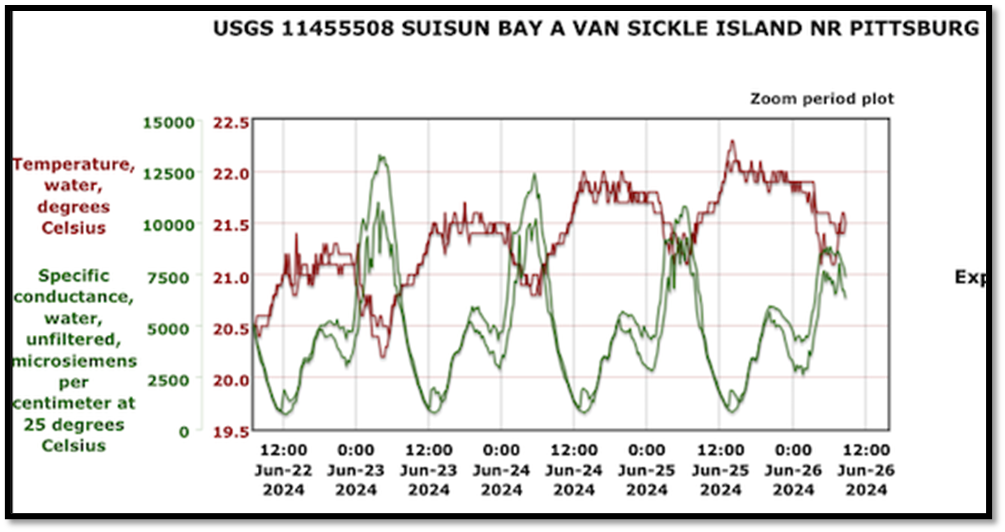
Figure 7. Tidally filtered salinity and water temperature in eastern Suisun Bay near Pittsburg, CA. 6/15-7/5, 2024.
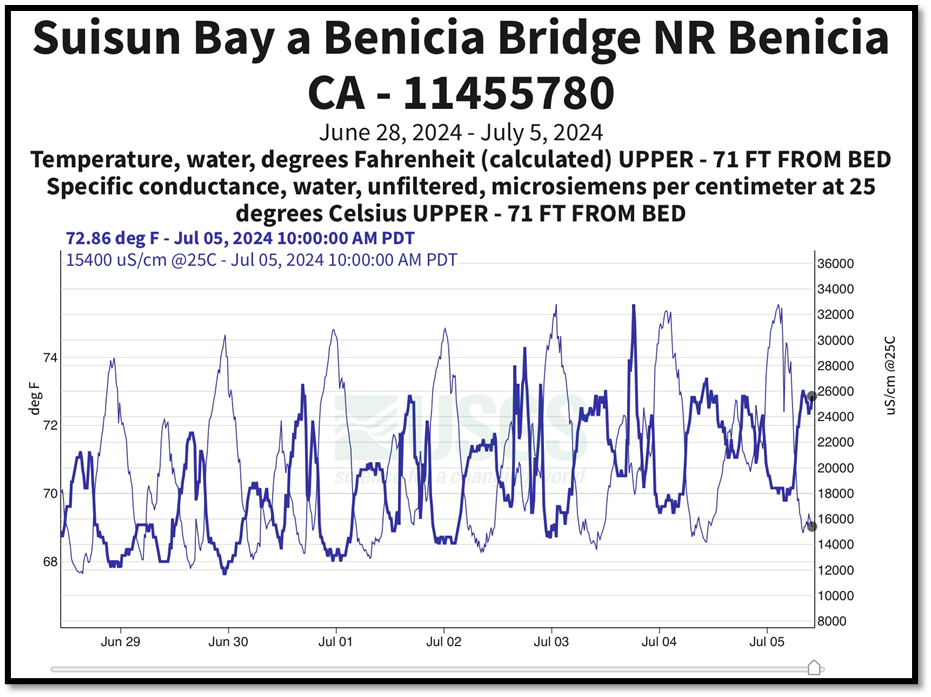
Figure 8. Salinity (EC) and water temperature in western Suisun Bay at Benicia Bridge near Benicia, CA. 6/28-7/5, 2024.
The Strawberry Moon, sometimes called the planting moon, is the June full moon (e.g., June 21, 2024). June is the end the juvenile salmon and sturgeon emigration season from the Central Valley to the Bay. The Strawberry Moon June 2024 super tides drained the warm river and Delta waters into the Bay driving the remainder of the brood year 2023 salmon and sturgeon with it toward the Bay.
In a wet year, the young salmon and sturgeon are pushing through the Delta throughout June. But 2024 was just an average water year, with the seasonal salmon and sturgeon emigration to the Bay ending with lower streamflow and higher water temperatures from the rivers through the Delta and then entering the Bay. At this point, we cannot yet determine if the seasonal event was successful – we just do not know. Regardless, we now must look toward the Bay to ensure that fish die-offs from warm water, low DO, and toxic algae blooms do not occur again.
What is important now is maintaining the Bay through the summer by ensuring toxic algae blooms and warm water do not stress the salmon and sturgeon present in the Bay. With water temperatures in the eastern parts of the Bay already high (22oC/72oF) at the beginning of summer, it seems the Bay is destined for another bad summer of toxic algae blooms and dying adult sturgeon.
What can be done to help keep the Bay cool this summer? There are three actions that when taken together and in sequence can help keep the Bay cooler: Keeping the rivers cooler keeps the Delta cooler. Keeping the Delta cooler keeps the Bay cooler. There are also some Bay actions that can sustain cooler water temperatures.
Keeping Lower Rivers Cooler
First, how to keep the lower Sacramento and San Joaquin rivers entering the Delta cooler. Higher streamflows speed the water along in the hot Valley keeping the rivers from absorbing heat. We are only talking about 5oF or so, but it is an important five degrees. That is accomplished by maintaining adequate (legally prescribed) streamflows with reservoir releases, especially during summer heat waves that are getting hotter and more frequent with each decade (i.e., climate change).
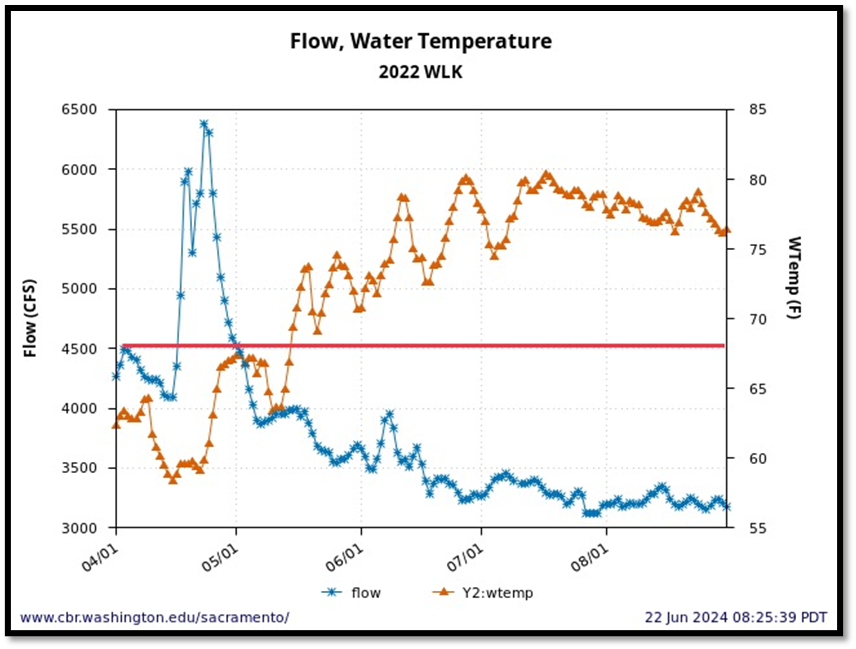
Figure 1. Drought year 2022 spring-summer streamflow and water temperatures at Wilkins Slough (RM 120) upstream of the Delta. Red line shows the target of 68ºF/20ºC needed to protect fish and keep the Delta cool.
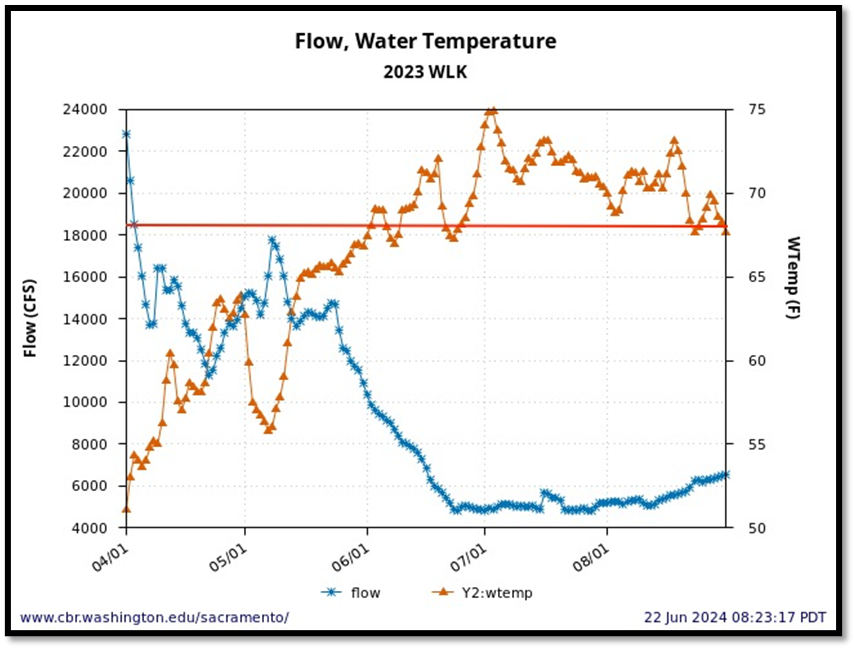
Figure 2. Wet year 2023 spring-summer streamflow and water temperatures at Wilkins Slough (RM 120) upstream of the Delta. Red line shows the target of 68ºF/20ºC needed to protect fish and keep the Delta cool.
The Sacramento River in the North Delta
Next is the Sacramento River channel in the north Delta’s Freeport to Emmaton reach, with Rio Vista in the center. This reach tends to emulate the input at Freeport, although it tends to warm when flow falls below 20,000 cfs (the inflow from Freeport, Cache Slough, and the San Joaquin River), as it too tends to warm as it slows down and sloshes back and forth with the tides in the summer sun. Delta diversions[1] can (and often do) take 12,000-13,000 cfs out of the 20,000 cfs Delta inflow (65% is the prescribed limit).
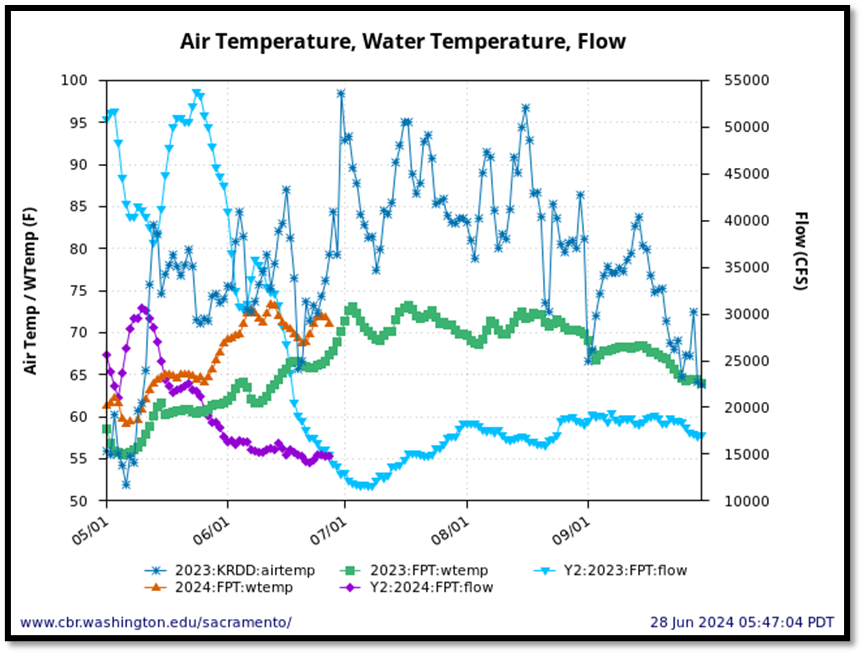
Input water temperatures at Freeport in June of 2023 and 2024, with streamflow of 15,000 cfs, were generally 70oF or higher (Figure 3). In 2023, inflows of 20,000-40,000 cfs brought water temperatures in the 62-66oF range with slightly higher water temperatures during heat waves. When streamflow at Freeport fell below 20,000 cfs in summer 2023, water temperatures reached 70oF or higher, especially during heat waves, when water temperatures spiked 2-4oF. Maintaining 20,000 cfs inflow at Freeport generally would bring water temperatures below 70oF.[2]
Figure 3. Wet year 2023 and above normal year 2024 spring-summer streamflow and water temperatures of the Sacramento River at Freeport (RM 90) at entrance to the Delta.
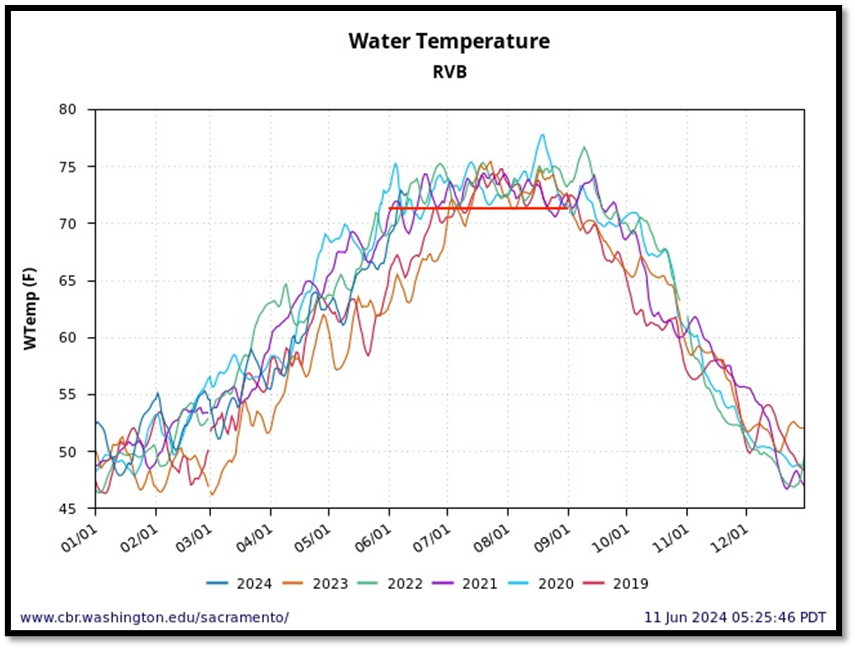
Downstream of Freeport in the central portion of the Sacramento River north-Delta channel at Rio Vista Bridge, water temperature patterns are similar to Freeport although slightly warmer and more erratic (Figures 4 and 5). Rio Vista is subject to inputs of warmer water from Cache Slough and the San Joaquin River and thus tends to be slightly warmer than Freeport. Net river flows at Rio Vista are also lower, as Delta water diversions can markedly reduce the Delta inflows by this location. Operation of the Delta Cross Channel also complicates the flow splits upstream of Rio Vista. Cooler Delta air compared to the Sacramento Valley is also a factor. However, the main factors appear to be water temperatures and inflows from upstream (Freeport). Keeping Freeport streamflows cooler should keep Rio Vista water cooler, especially during summer heat waves like the three in July 2023.
Figure 4. Water temperatures at the Rio Vista Bridge in the north Delta 2019-2024. Red line is recommended 72ºF limit.
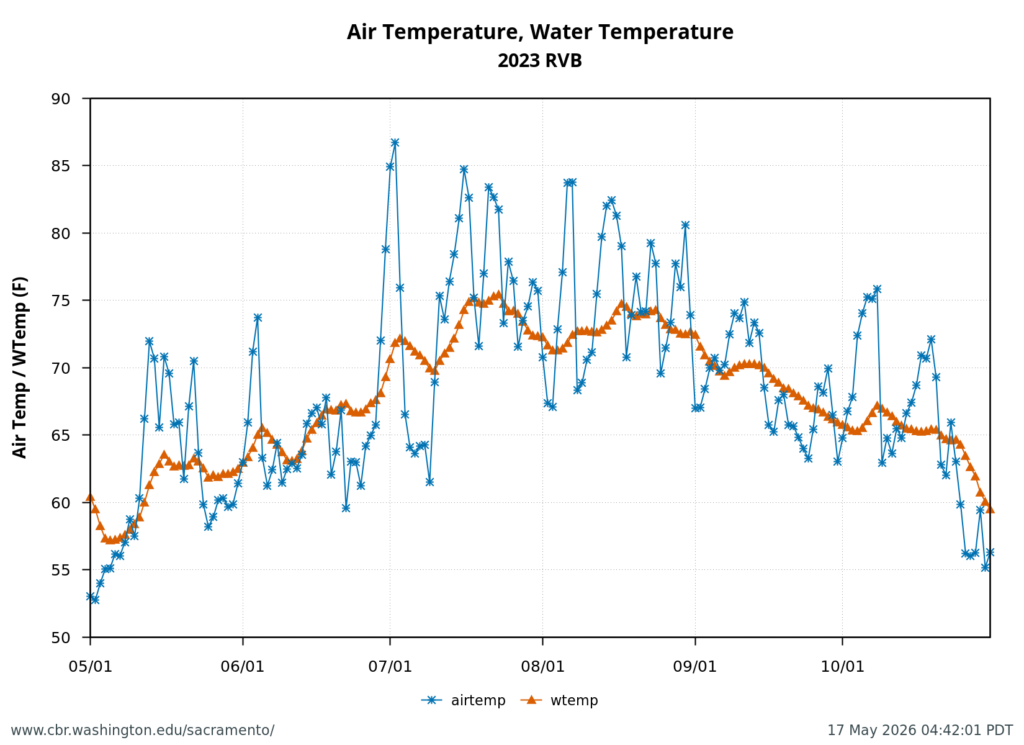
Figure 5. Water temperature (daily average) at Rio Vista Bridge in north Delta from May-October 2023 – a wet year. Also shown is Rio Vista Bridge daily average air temperatures.
The Bay
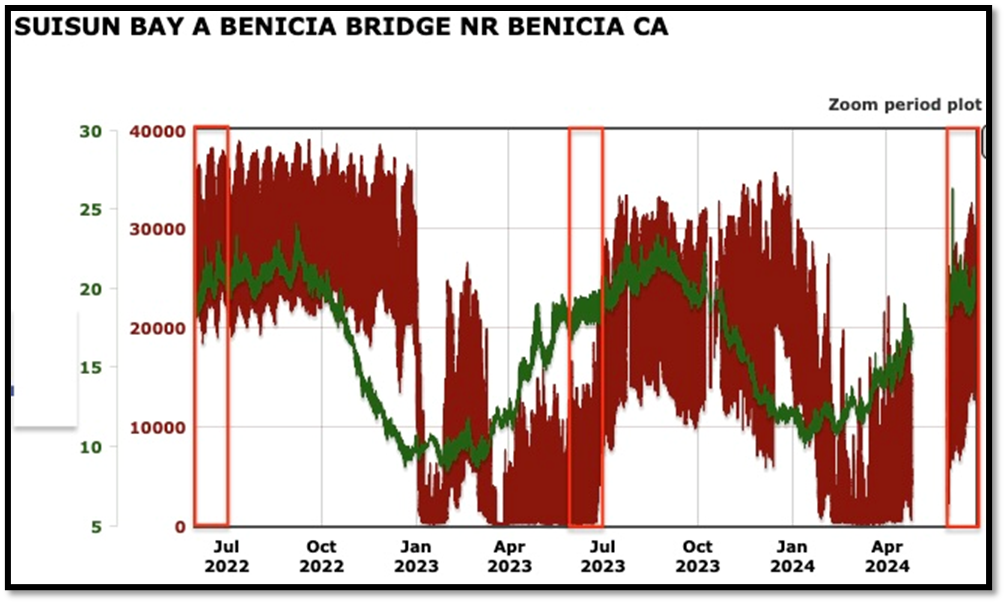
Summer Bay water temperatures are a function of inputs from the Delta and ocean, and of local air temperatures and tidal circulation. At the Benicia Bridge between the east Bay (Suisun Bay) and the north Bay (San Pablo Bay), the influence of freshwater inflows is not unlike that in the rivers and Delta. In wet years like 2023, high freshwater inflows in June kept salinity and water temperature lower (<20oC/68oF) (Figure 6). Warm water generally comes in from the Delta, especially during the twice monthly tidal-cycle draining of Delta water into the Bay (Figure 7). A one-foot stage drop from the 500,000-acre Delta into the Bay is 500,000 acre-ft of warm Delta water that over several days can have a measurable effect on the Bay. The late June 2024 full super moon is already heating the Bay with warm river and Delta water (Figure 7). A cooler Delta would make for a cooler Bay.
Figure 6. Hourly water temperatures and salinity (EC) at Benecia Bridge in west Suisun Bay June 2022-June 2024. Red boxes denote June periods in each year.
Figure 7. Hourly water temperature (degrees C) and salinity (EC) in east Suisun Bay in late June 2024 after full moon. Note warm fresher water from upstream (Delta) on ebb tides.
Conclusions and Recommendations
Poor water conditions in the Sacramento River, Delta, and Bay this summer will have negative effects on salmon, sturgeon, and other native fish populations. Unless there is action to mitigate these effects, the summer fish die-offs that occurred in summers of 2021-2023 in the Bay are likely to occur again this summer. The following actions can reduce these negative effects:
Maintain the water quality standard of 68oF (daily-average) in the lower Sacramento River at the Wilkins Slough gage. This will require raising river flow from the planned 4000-5000 cfs level to 6000-8000 cfs level or higher (during heat waves).
Maintain an average daily Delta freshwater inflow of 20,000 cfs at the Freeport gage.
Increase the freshwater inflow above 20,000 cfs and/or reduce Delta water diversions as necessary during heat waves to maintain a daily-average 68oF at the Freeport gage and maximum hourly 72oF at the Rio Vista gage.
Consider operational changes to the False River weir, Delta Cross Channel gates, and Montezuma Slough gates, which may also help reduce localized adverse effects.
[1] South Delta exports, smaller regional diversions, Delta agriculture, etc.
[2] Based on review and analyses of many years of data at Freeport and other locations.