
Following an introductory post, this is the fifth post in a series on the lessons learned by the National Marine Fisheries Service (NMFS) from the 2013-2015 drought that devastated Sacramento River salmon populations. This post addresses NMFS’s Lessons #14 and #15.
NMFS acknowledges that low spring flows may lead to low survival of juvenile spring-run Chinook salmon during their emigration to the sea. NMFS also suggests that disease may also cause poor survival in dry years.
Some additional observations regarding outmigration are appropriate. Most wild spring-run fry, fingerling, and pre-smolts emigrate in winter, although spring smolt emigration also occurs. Another thing to consider is that while disease may be more prevalent in spring of dry years, it may be due to extended rearing in the poor habitat of the upper river in drier years (less food, warmer water, and more stress). Increased predation by striped bass and other predators under these same habitat conditions is almost certainly another factor. Lower flows make predators more effective because of lower turbidities, warmer and shallower water, less cover, and slower transport rates.
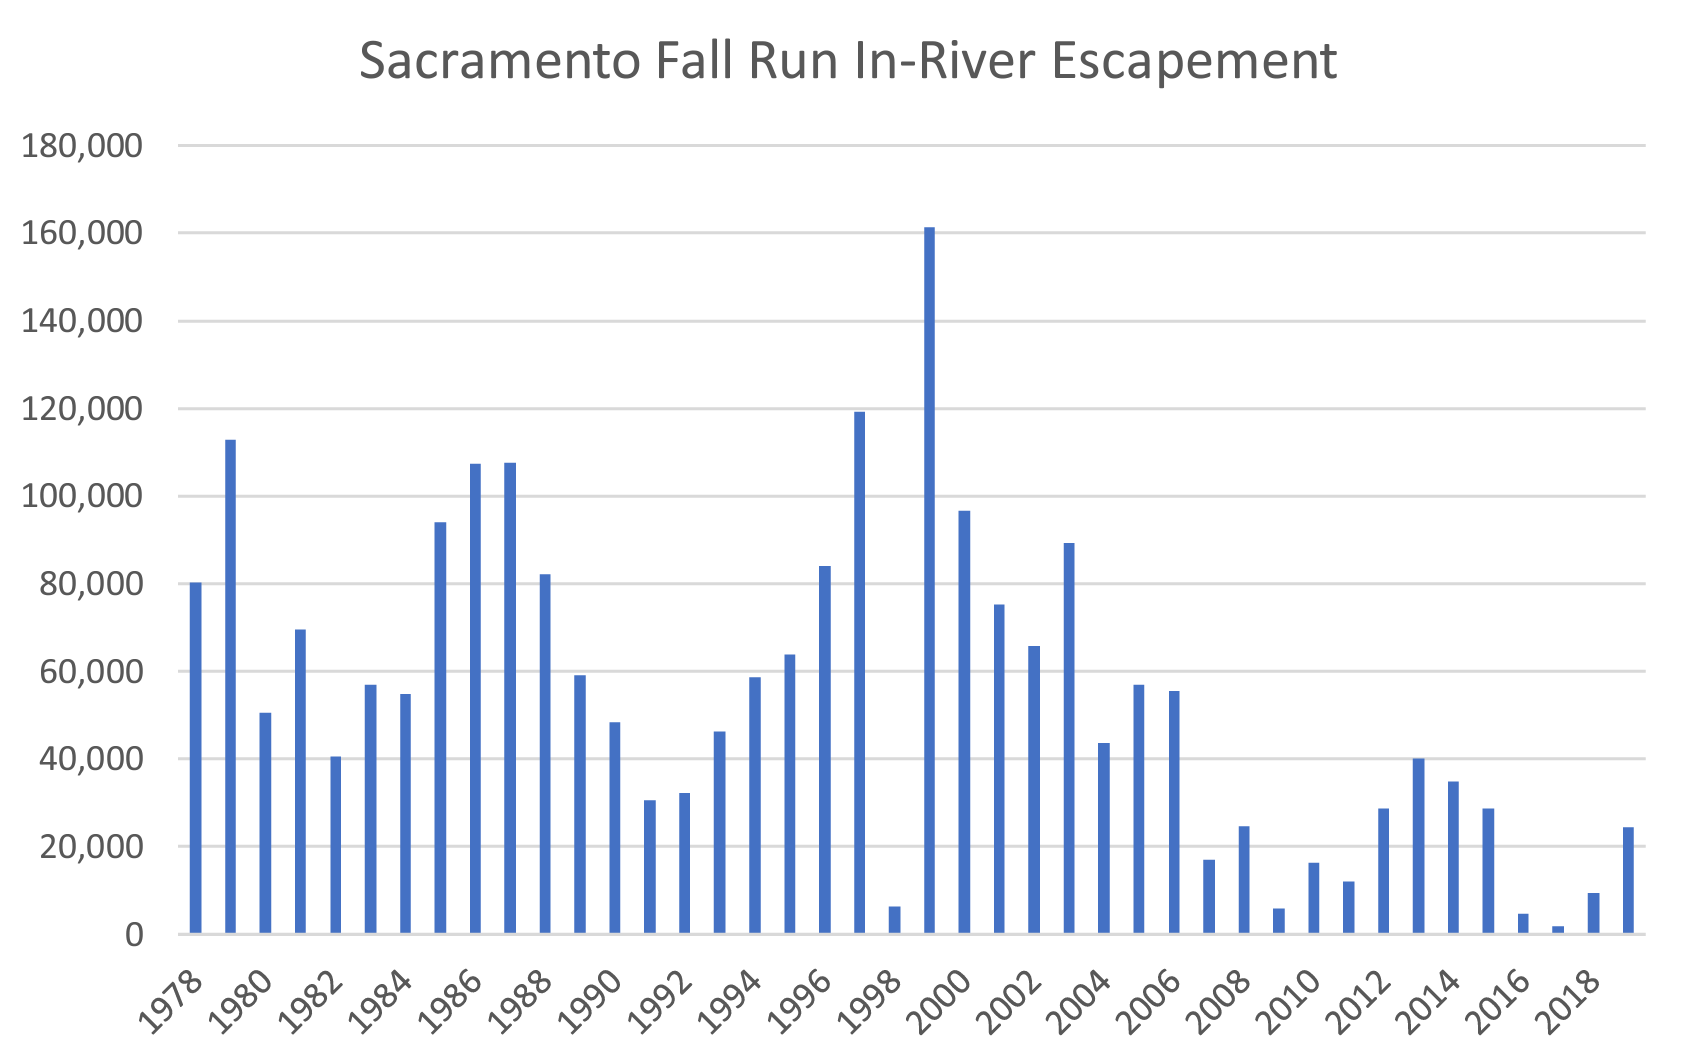
NMFS’s Lessons 14 and 15 did not consider lower survival of adult salmon migrating upstream in spring of drier, low flow, warmer water years. However, this is also important. Run counts are strongly related to water-year types, with poor runs in drier years (Figure 1). Adults that migrate upstream in spring and over-summer in dry years face more difficult passage in spring and warmer spring and summer water temperatures. Warmer water temperatures lead to greater stress, energy loss, and disease, poorer pre-spawn survival, and reduced reproductive success (Richter and Kolmes 2005).
An overall lesson is that low winter-spring flows lead to higher water temperatures in the lower Sacramento River migration corridor (Figures 2 and 3) and in spawning tributaries (Figure 4), which in turn reduce survival and reproductive success of spring-run salmon.
A related issue at play relates to Lesson 8 (low flows in the lower Sacramento River at the Wilkins Slough gage). Low spring and summer flows in the lower mainstem Sacramento River flows lead to warmer spring and summer water temperatures. This in turn leads to higher predation rates on juvenile salmon and poorer adult survival and reproduction success. Continuing to ignore long-ago established water quality standards for water temperature and operating norms for flow is putting greater stress on all the salmon runs and on sturgeon. Spring-run salmon are especially vulnerable because both juveniles and adults are present in the lower Sacramento River in spring.
One especially damaging case occurred in early spring 2018. A series of storms raised flows in the lower Sacramento River by approximately 50,000 cfs, while at the same time there was only a minimum release of about 3000 cfs into the upper Sacramento River from Shasta Dam. Substantial flows entered the lower Sacramento River from tributaries and from the outfalls of agricultural basins, including the Butte Basin at the Butte Slough Outfall gates. Some flow even left the river via overflow weirs into the Sutter Bypass. The sudden surge of urban and agricultural basin stormwater, with high oxygen demand, sediment, and chemical loads, led to a series of fish kills of adult spring-run salmon in the lower Sacramento River at the Butte Slough Outfall (Figures 5 and 6). It is not clear exactly why high concentrations of stormwater may have increased mortality of spring-run salmon in 2018. What is clear is that low Shasta releases contribute to higher concentrations of stormwater in river flows at key times during their migration.
In conclusion, Reclamation should consider higher spring releases from Shasta in drier years like 2021 to (1) improve juvenile spring-run emigration survival to the Bay-Delta, and (2) improve adult spring-run survival and reproductive success. Reclamation should also consider spring pulse flow releases from Shasta-Keswick to emulate natural unimpaired lower river spring flows and to enhance migration success. Such pulses should be timed with lower river tributary flow pulses. Finally, as discussed in previous posts, Reclamation’s contractors and others must reduce dry-year water diversions in spring from the mainstem Sacramento and its tributaries to further protect spring-run salmon.
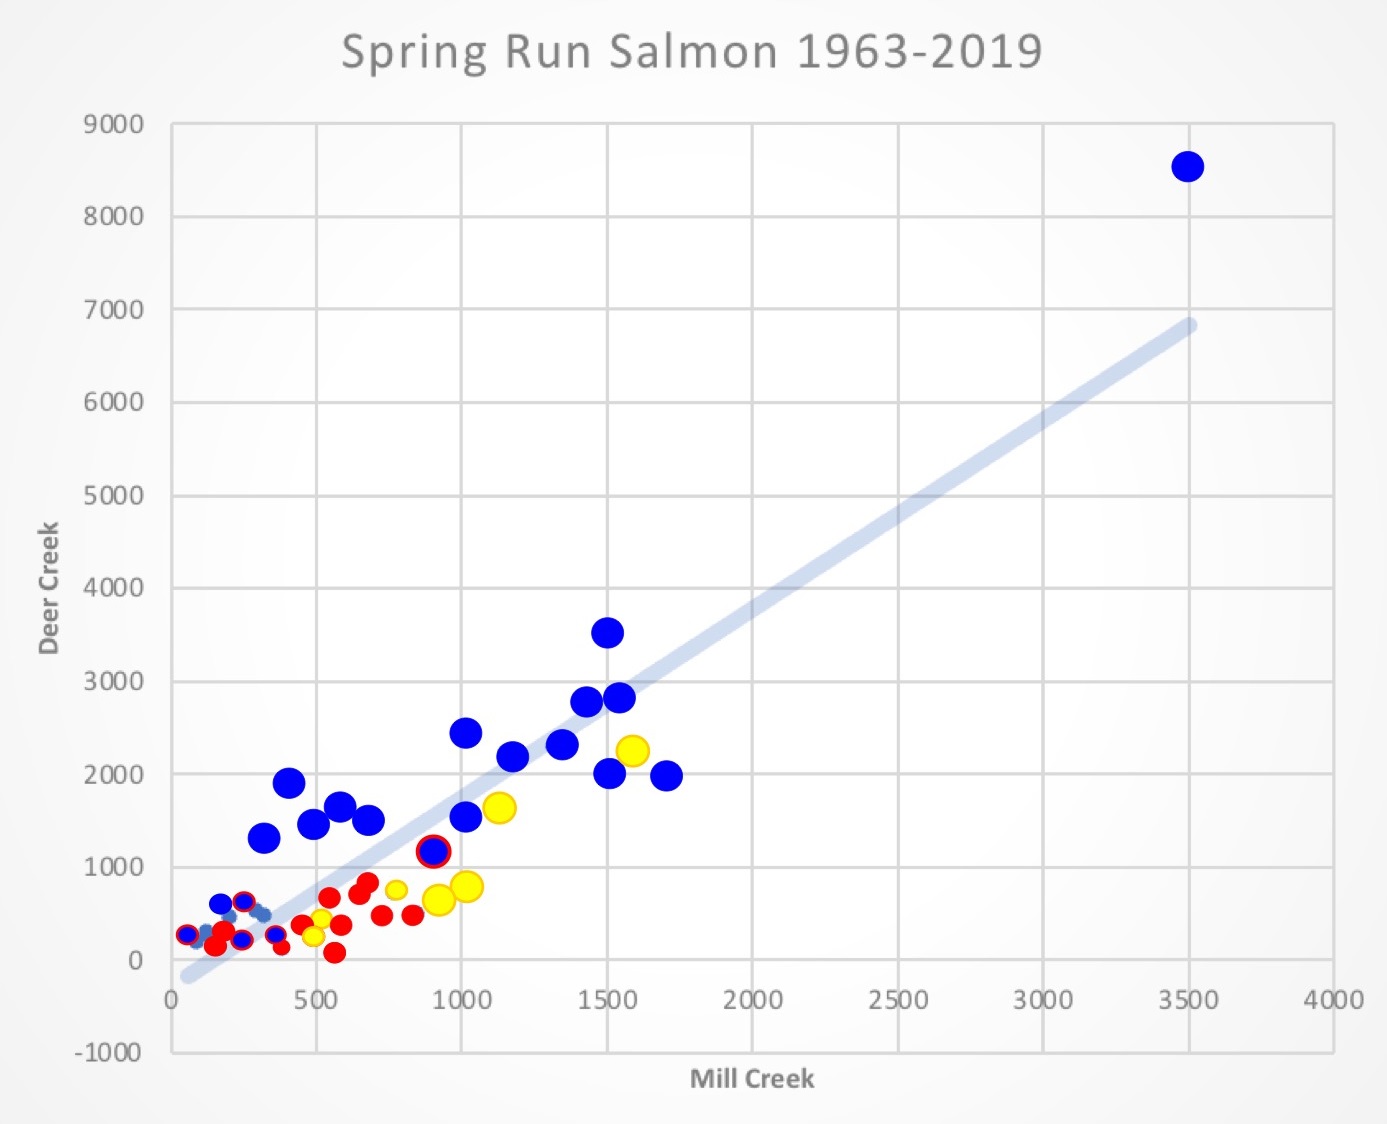
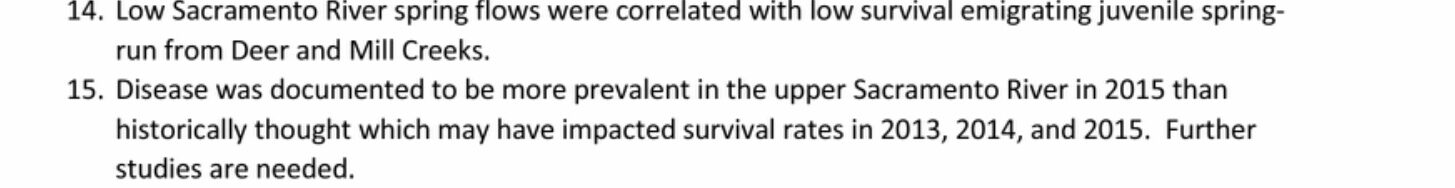
Figure 1. Relationship between Mill and Deer Creek spring run salmon counts 1963-2019. Blue dots represent above-normal and wet years. Yellow dots represent below-normal and dry years. Red dots represent critical dry years. Red margin on blue dots represents a wet and above normal year for adult immigration with a critical dry year two years prior during rearing and emigration. Of special note are the sharply higher run sizes in wet years in Deer Creek, but lower run sizes in Deer Creek in drier years. This shows that production of salmon in Deer Creek suffers proportionally more than in Mill Creek in drier years. In both creeks, salmon runs suffer in years when they are emigrating and immigrating in dry conditions.
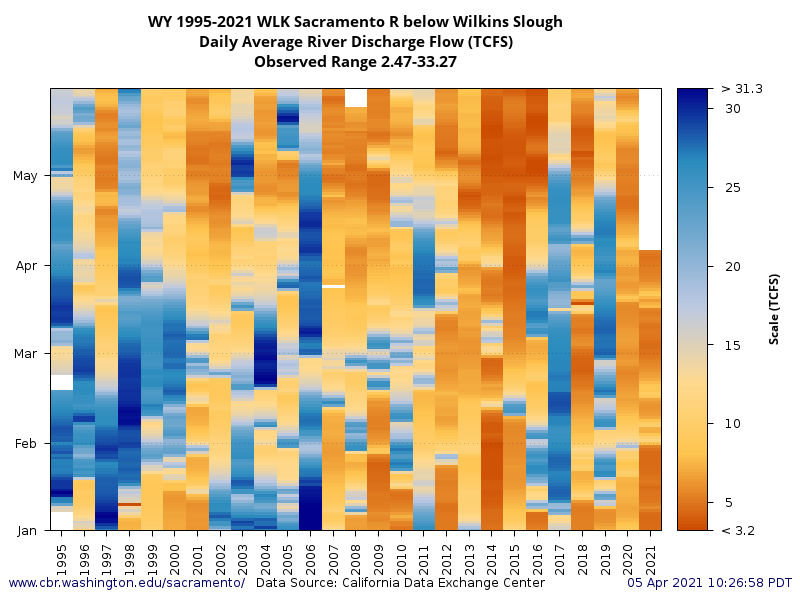
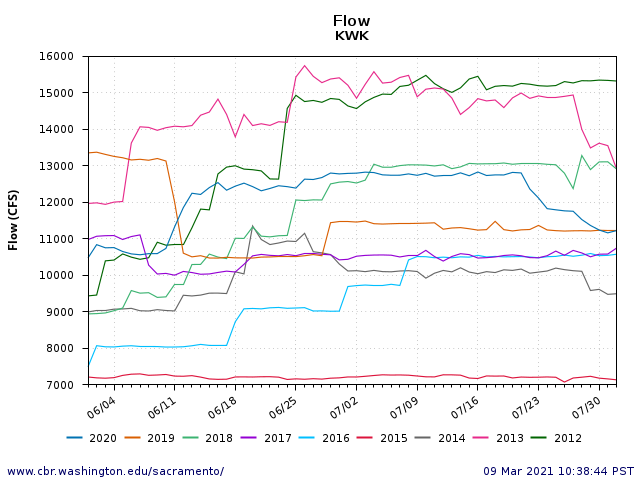
Figure 2. River flows (1000s of cfs) in the lower Sacramento River at Wilkins Slough (below the mouths of Deer and Mill Creeks) in winter-spring from 1995-2021. Note very wet conditions in 2006 and very dry conditions in 2014 and 2015.
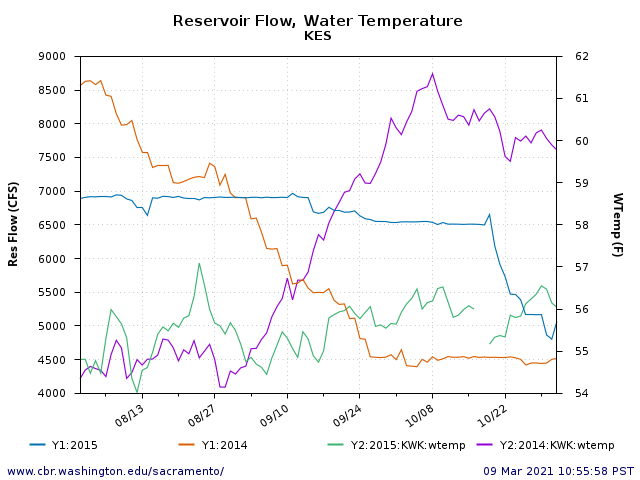
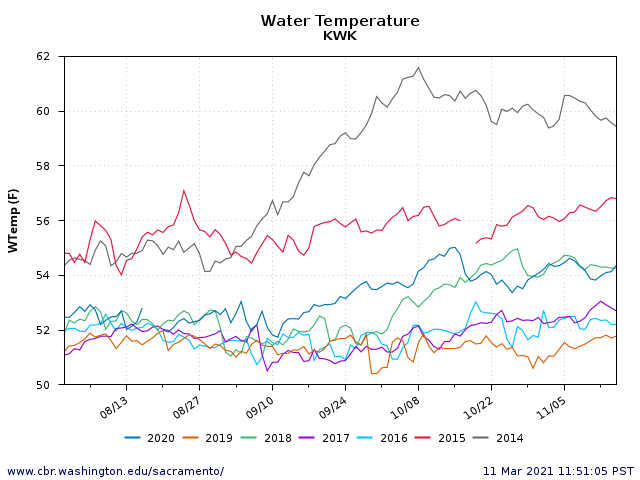
Figure 3. Water temperatures in the lower Sacramento River at Wilkins Slough (below the mouths of Deer and Mill Creeks) in winter-spring from 2013-2021 (only data available). Note the extraordinarily warm water (near or above 70ºF) in early spring of drier 2014, 2015, 2018, and 2020. State standard is 68ºF. Migrating adult salmon suffer stress and mortality at water temperatures above 60ºF.
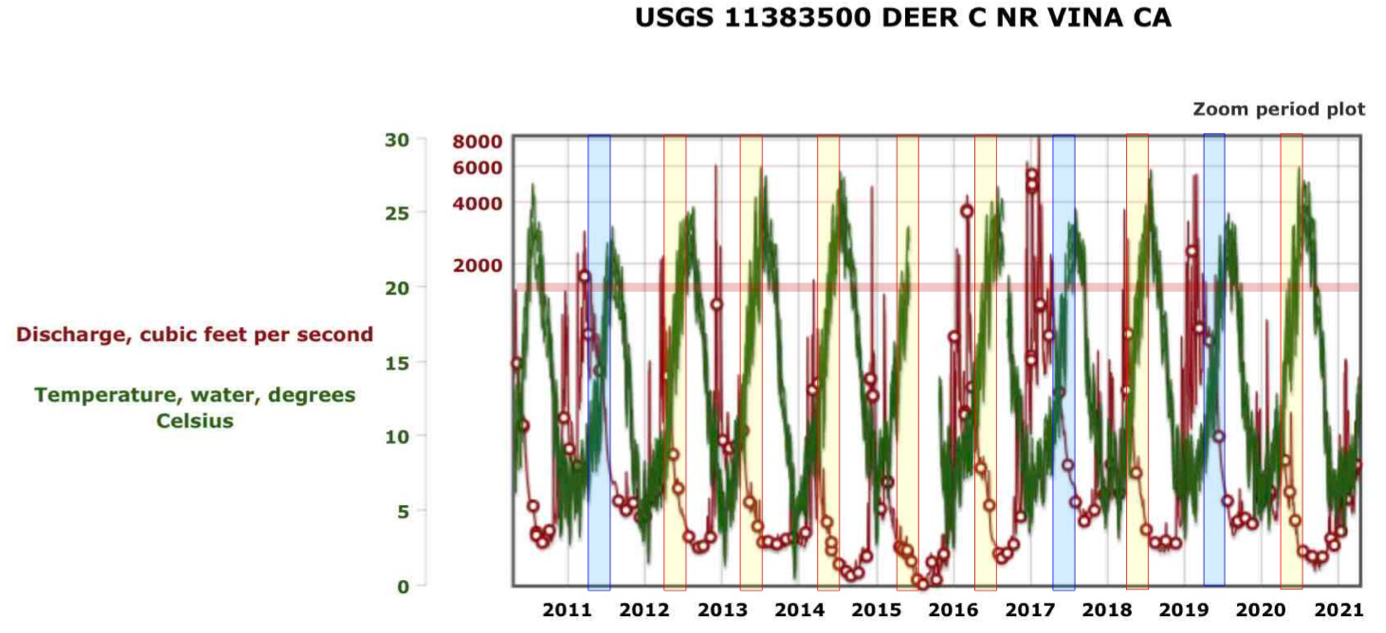
Figure 4. River flow and water temperature in Deer Creek 2011-2921. Wet year spring in 2011, 2017 and 2019 shown in blue highlight: other spring conditions shown in yellow highlight. Dry years include 2013-2015 and 2021. The remainder are normal or average year types. Note lower water temperatures in wetter years, with highly stressful temperatures (>68ºF, 20ºC) delayed further into spring than during drier years.
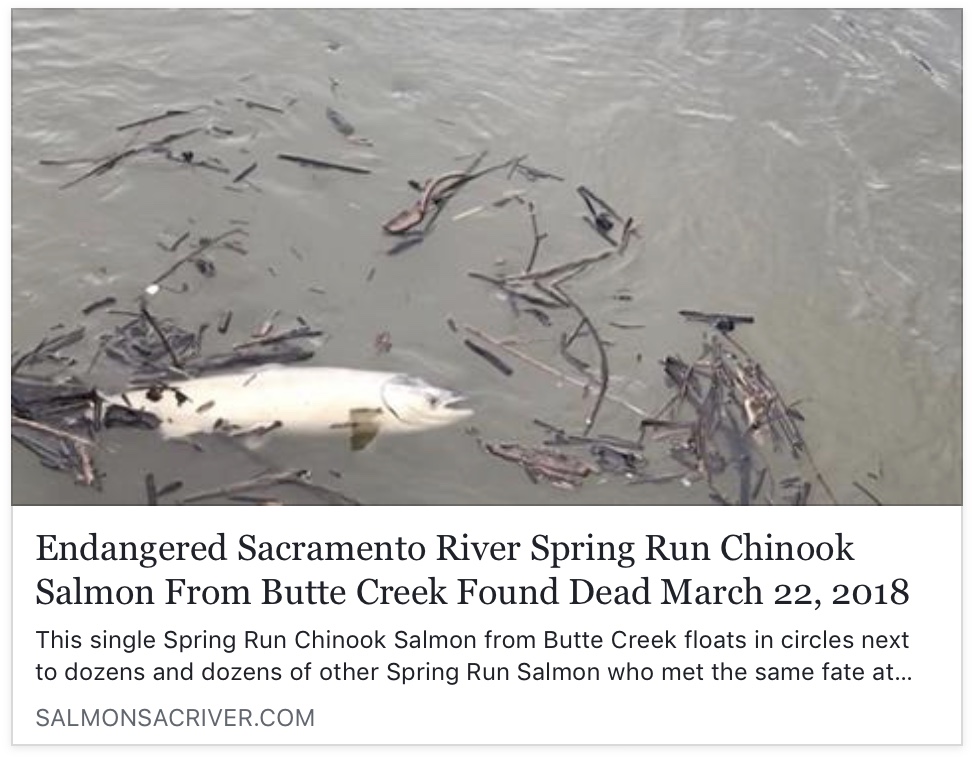
Figure 5. Dead adult spring-run salmon floating at the mouth of Butte Slough Outfall in the Sacramento River in March 2018. Fish likely died from severe stress from low oxygen and heavy suspended sediment and chemical load after being attracted to stormwater flow from outfall gates.
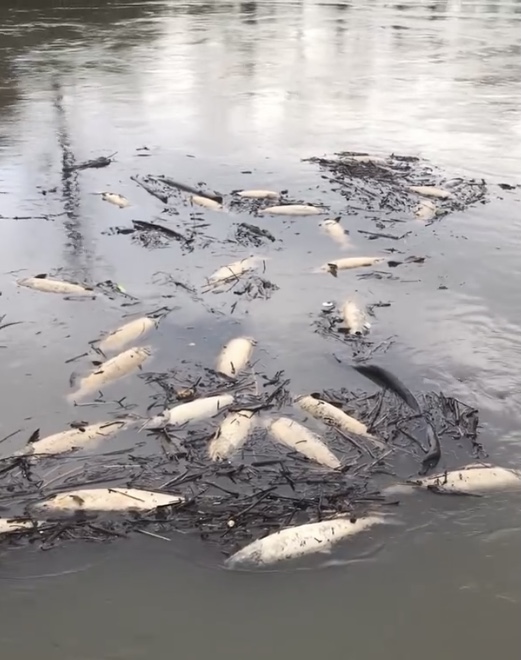
Figure 6. Dead adult spring-run salmon floating at the mouth of Butte Slough Outfall in the Sacramento River in March 2018. Fish likely died from severe stress from low oxygen and heavy suspended sediment and chemical load after being attracted to stormwater flow from outfall gates.
Source: https://youtu.be/t5oB_hWcrzU


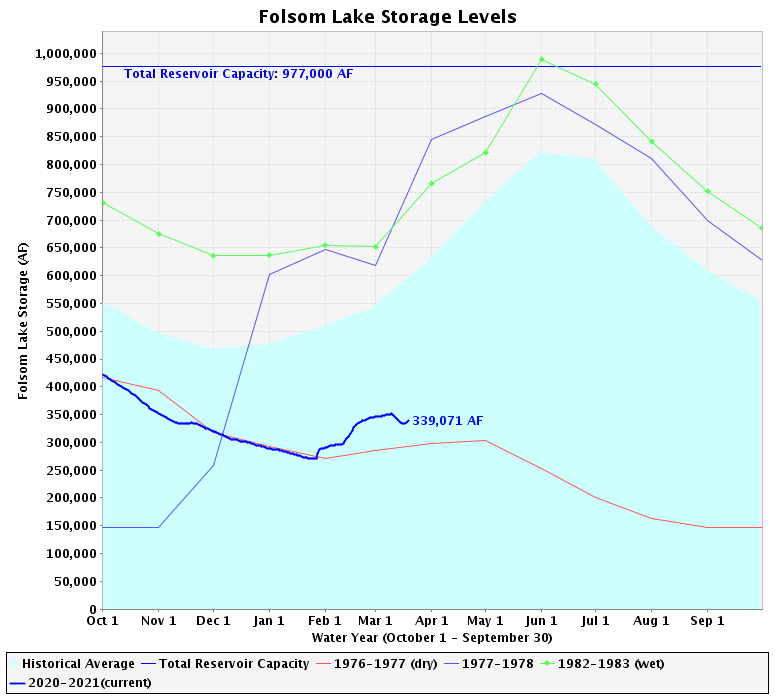
 In 2014 and nearly again in 2015, Reclamation ran out of cold water in Lake Shasta available for release to maintain downstream salmon in late summer and early fall (Figure 1). Cutting late spring and early summer water deliveries to contractors from reservoir releases in most cases would preserve cold-water pool through to fall. In critical drought years 2014 and 2015, cold-water-pool volume on June 1 was about 1.2 million acre-ft. In wetter 2016 and 2019 cold-water-pool volume on June 1 was more than double that.
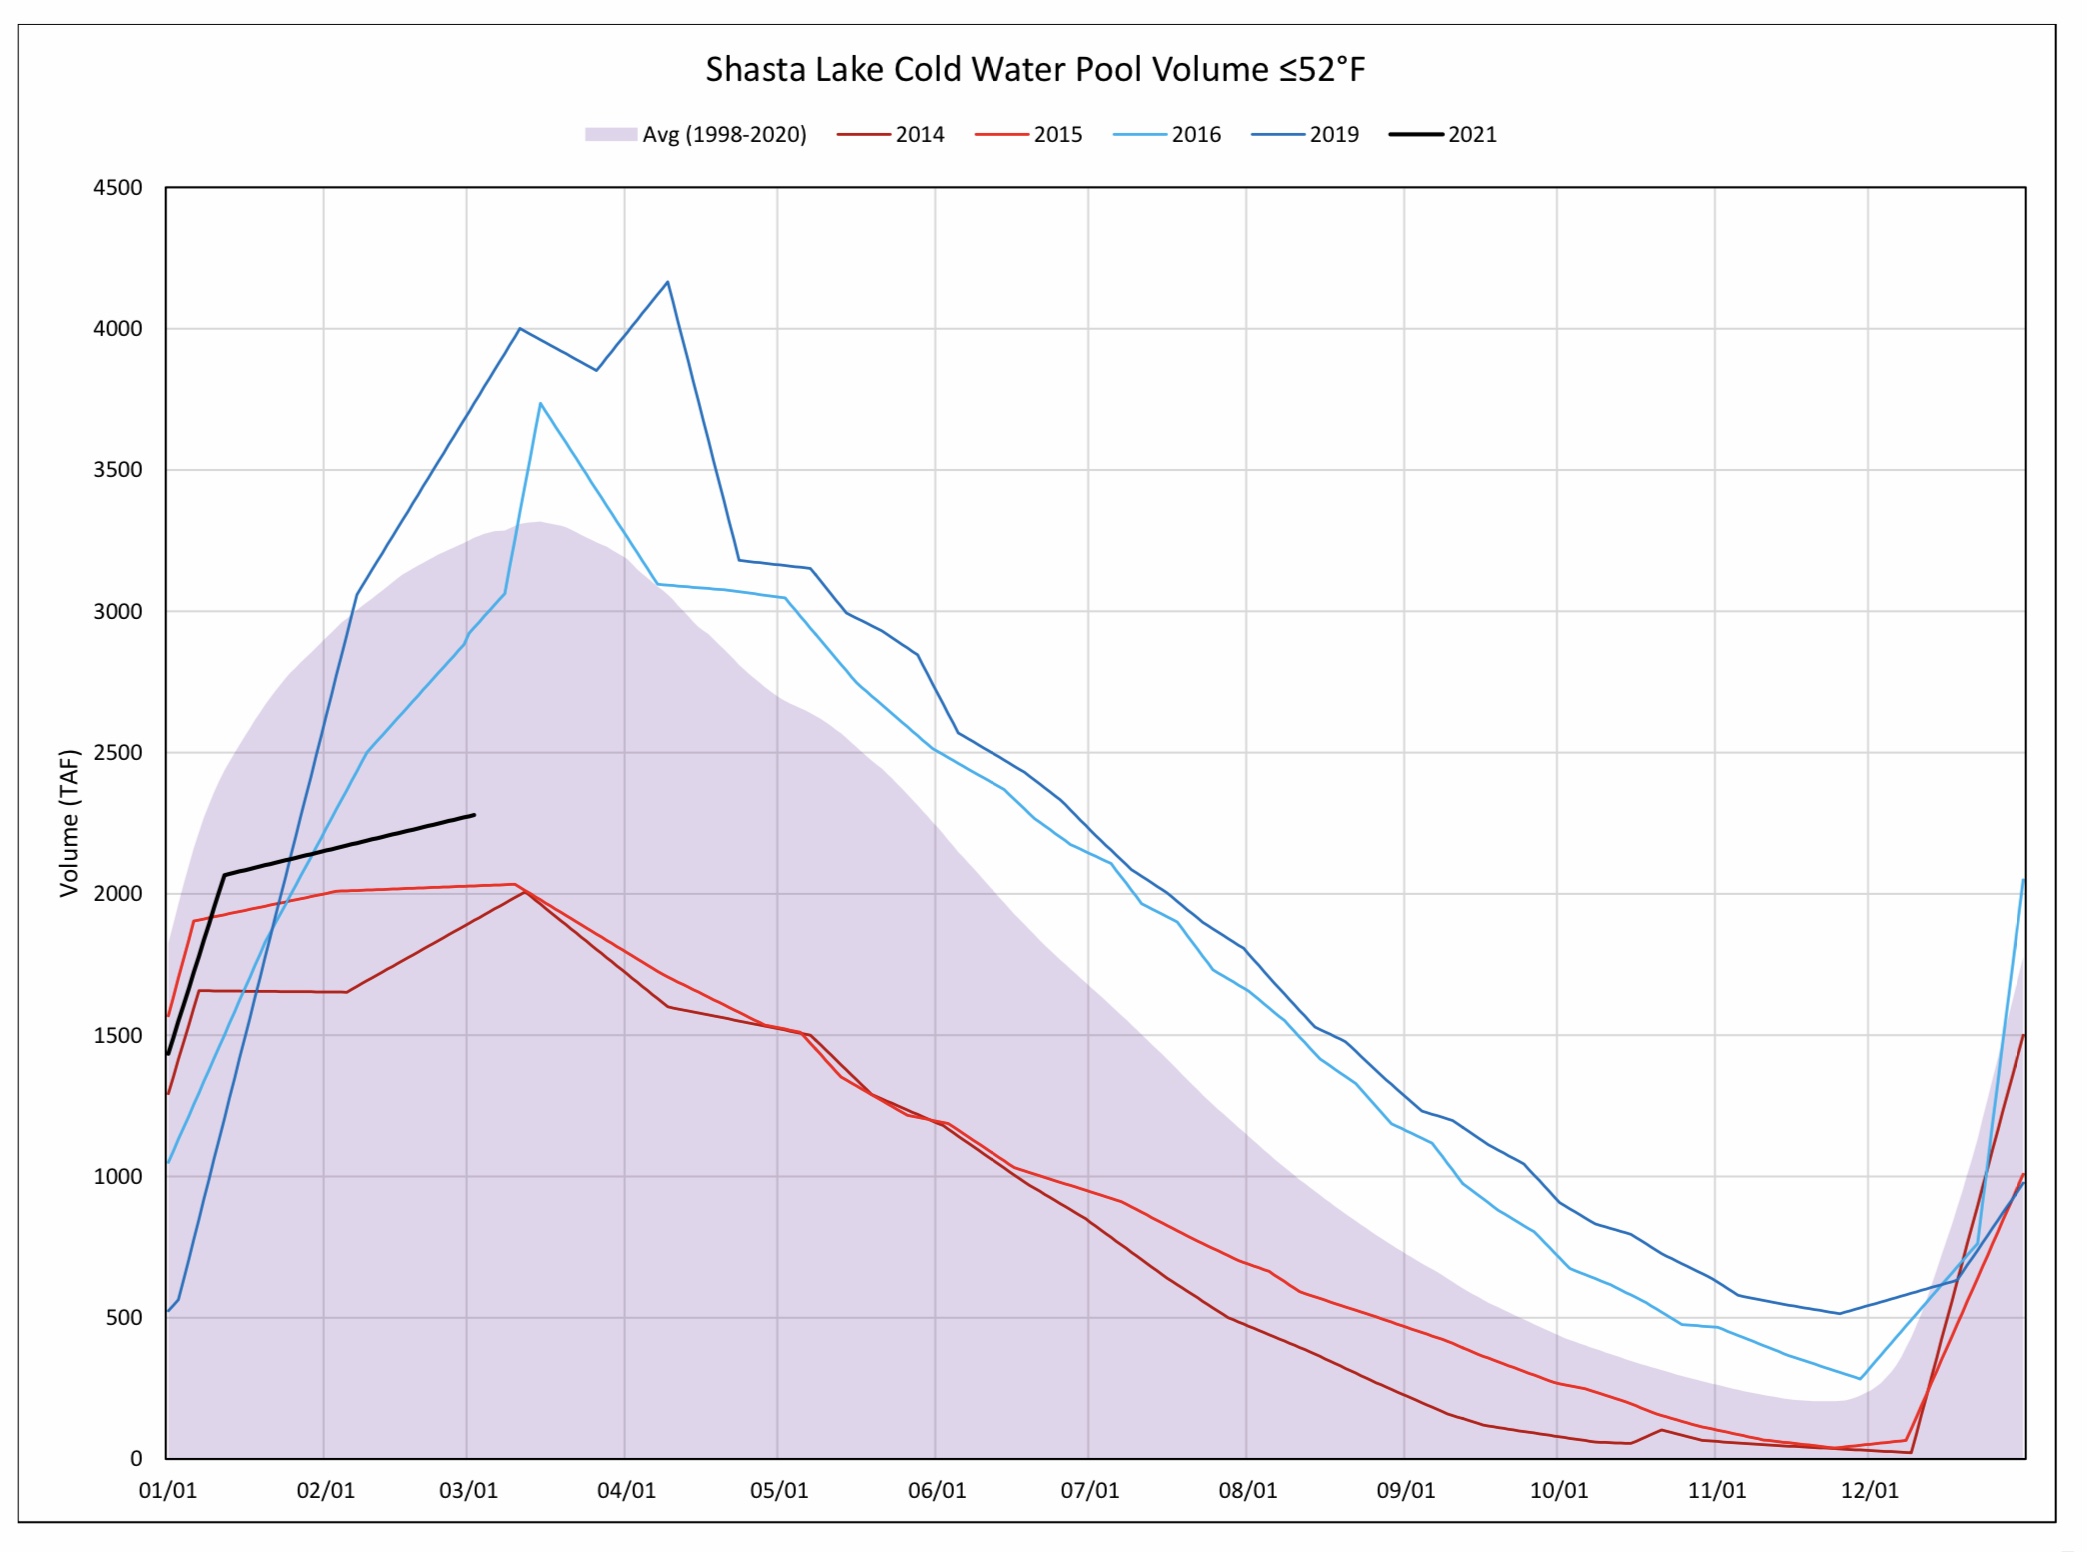


