The California Department of Water Resources (DWR) Division of Flood Management is planning a major fish passage improvement to the Sutter Bypass: a notch in the Tisdale Weir.1 The notch will extend and enhance river flows into the bypasses, thereby allowing more access for juvenile salmon to rear in the bypass and improved upstream adult salmon passage from the bypasses back into the Sacramento River. DWR plans to place an operable gate in the notch, which DWR would open when flows over the weir ceased. This would extend the duration of flows into the bypass. As planned, DWR would not open the gate until after the weir had already overflowed.
In a May 2019 post I described similar improvements to fish passage into and out of the Yolo Bypass, including notches in the Fremont Weir at the upstream end of the Yolo Bypass where high flows in the Sacramento River overflow into it.
Potential Benefits:
Improving adult upstream passage and expanding rearing access to the bypasses with notch flows is a good concept. Improving rearing habitat in the bypasses is a further potential benefit. In wet years and in even in drier years (when the bypasses receive no Sacramento River overflows (or young salmon) even from the new notches), there will new potential benefits to tributary salmon populations (e.g., salmon from Butte Creek and the Feather and Yuba rivers). Sacramento River hatcheries can also improve their contributions by out-planting fry salmon to wetlands in the bypass. Managed wetlands in the bypass (including duck clubs and rice fields) can also be used for rearing wild and hatchery fry salmon, especially in drier years.
Potential Drawbacks:
More flow and access to the bypasses has the potential to put more salmon in harm’s way. More of the populations will rear and migrate in the bypasses. Stranding and predation in the bypasses are very real risks to young and adult salmon. Such risks need to be minimized. Rearing habitats need to drain effectively. Stranded young and adults should be rescued to the extent reasonably possible. There is a tendency in project plans and operations to ignore or downplay the stranding risks.
Further Needs:
There are multiple Sacramento River flood-control weirs that at times overflow into the Sutter Bypass and Butte Basin. These other weirs also need “fixing.” However, stranding (poor draining) in Butte Basin and Sutter Bypass will remain a serious problem, because hundreds of square miles of poor habitat conditions occur from top to bottom. Drainage and stranding need to be addressed before more access is provided. Information on smolt survival and run contribution from bypass rearing and passage is largely lacking.
Further Options:
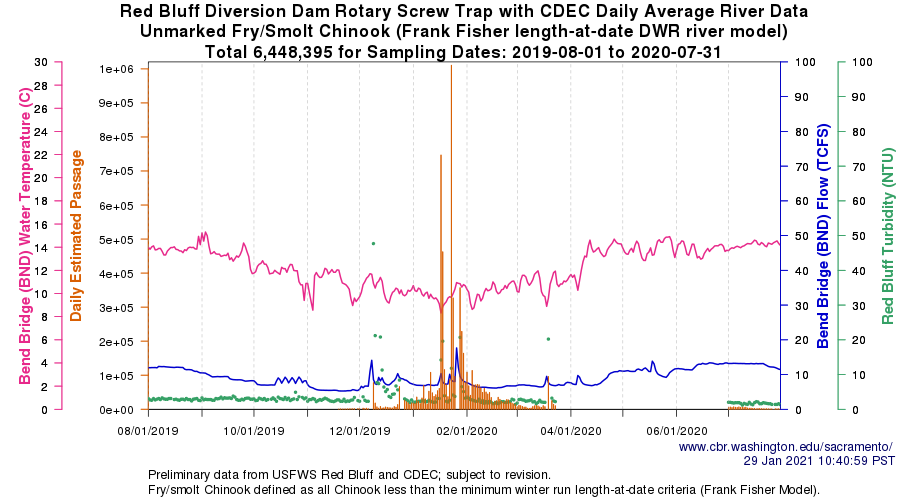
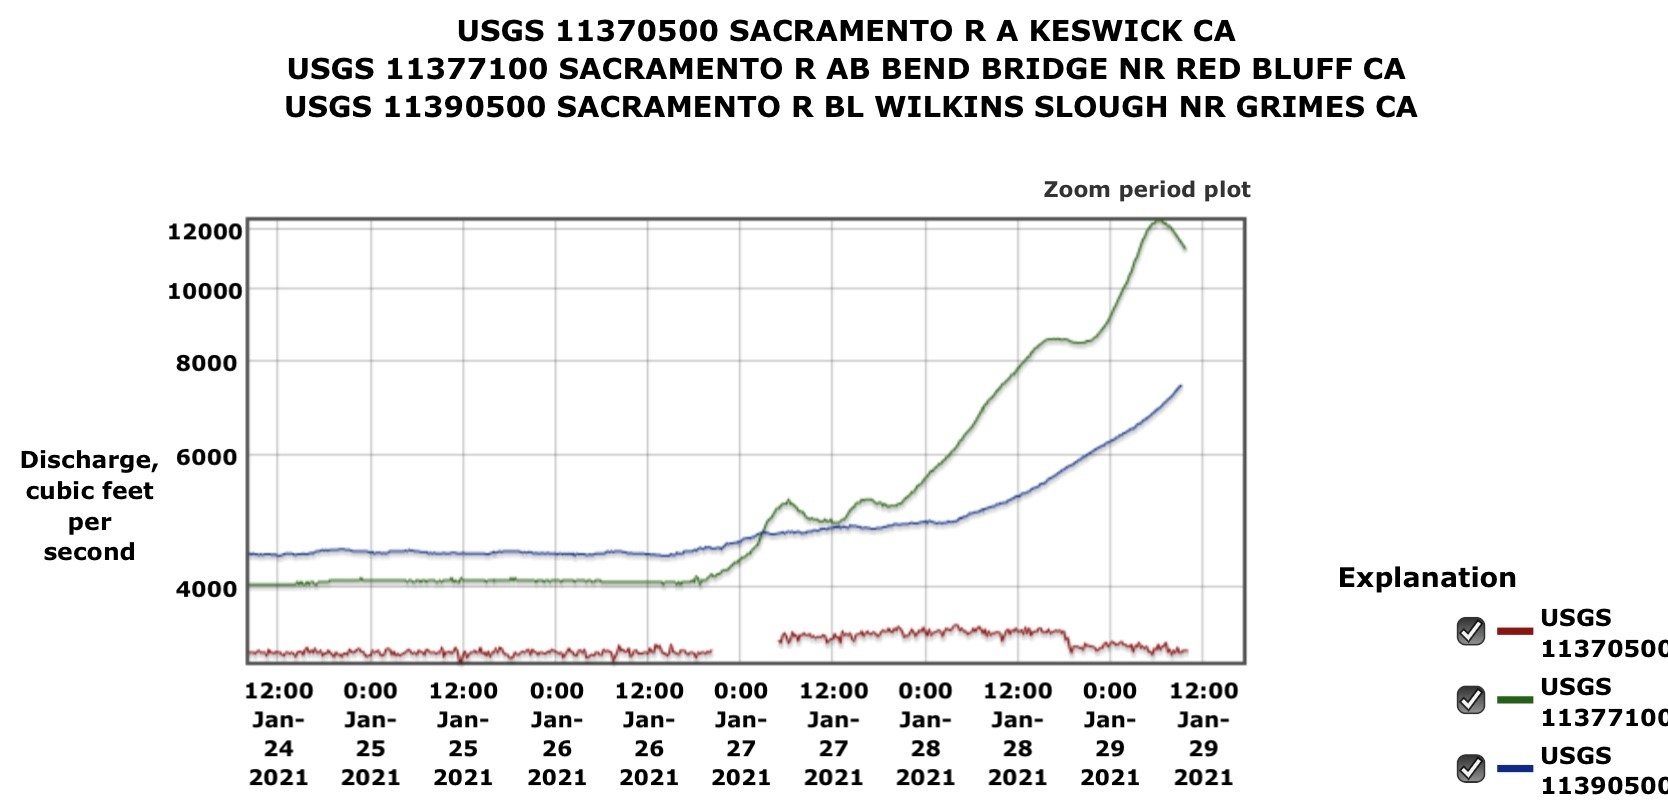
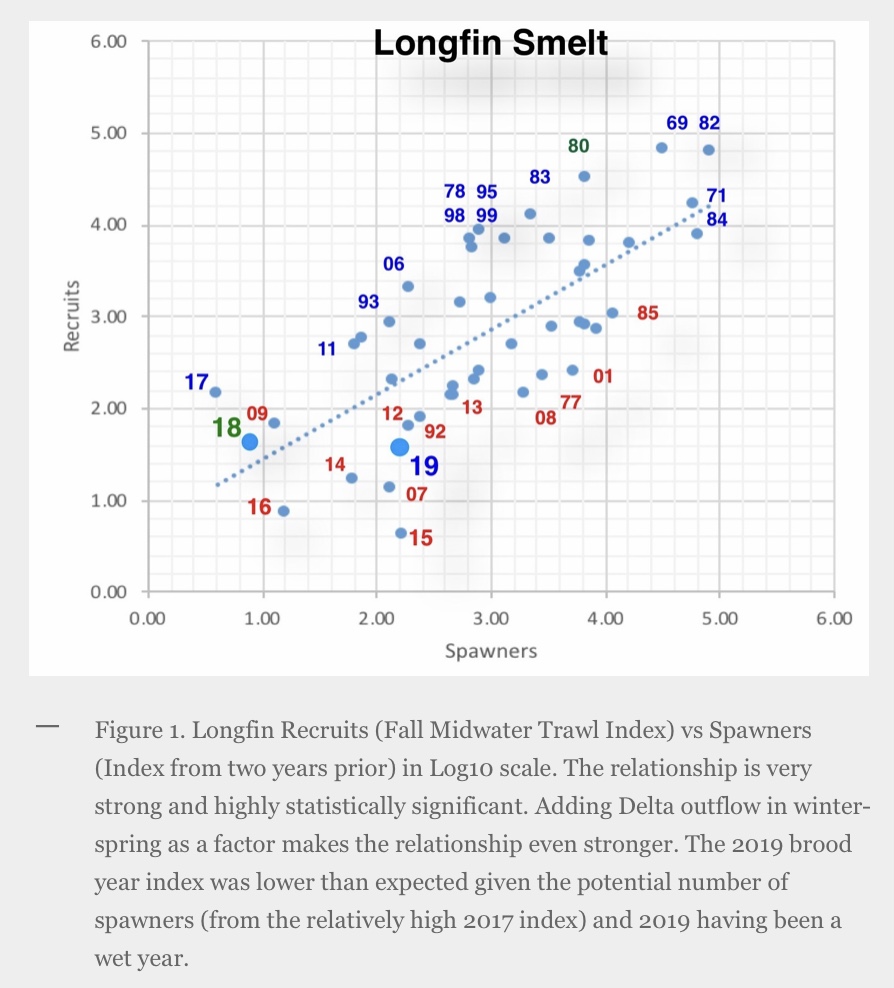
Often the first major flow pulses in the Sacramento River bring the strongest downstream movements of young salmon (Figure 1). Proposed operation of the Tisdale Weir calls for the new gates to remain closed until after the weir overflows (Figure 2). This operation does not take advantage of a significant potential project benefit. For instance, had the new facilities been in place during the peak early-January fry emigration in wet year 2019 (Figure 1), the weir gates would have remained closed (lower graph in Figure 2) when they could have been opened prior to weir overflow on about January 12. The gates could also be opened in earlier pulses and more frequently in drier years like 2018 (top graph in Figure 2). Furthermore, early openings in wet and dry years would accommodate access to floodplain habitats for juvenile winter-run salmon (Figure 3). DWR would need to develop some forecasting and decision-making protocols to evaluate opening the new gates prior to overflows. But water already in the bypass from other sources could partly mitigate the juvenile stranding potential, and adults that had strayed into the bypass would have a better opportunity to escape.
Summary and Conclusions:
The Tisdale Weir Project could provide substantial benefits to Sacramento River salmon. However, the proposed operation does not address potential risks on the one hand and may not fully take advantage of potential benefits on the other hand.
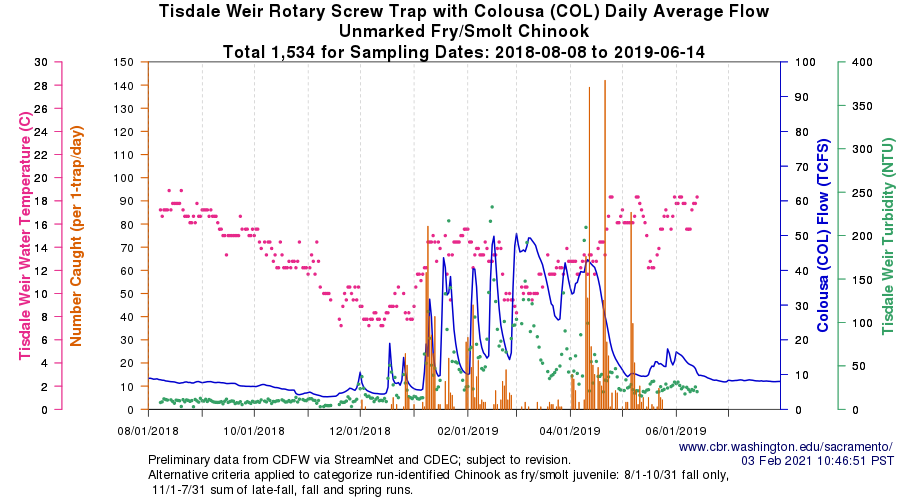
Figure 1. Catch of fall-run-sized salmon in screw traps in lower Sacramento River near the Tisdale Weir in winter-spring 2019
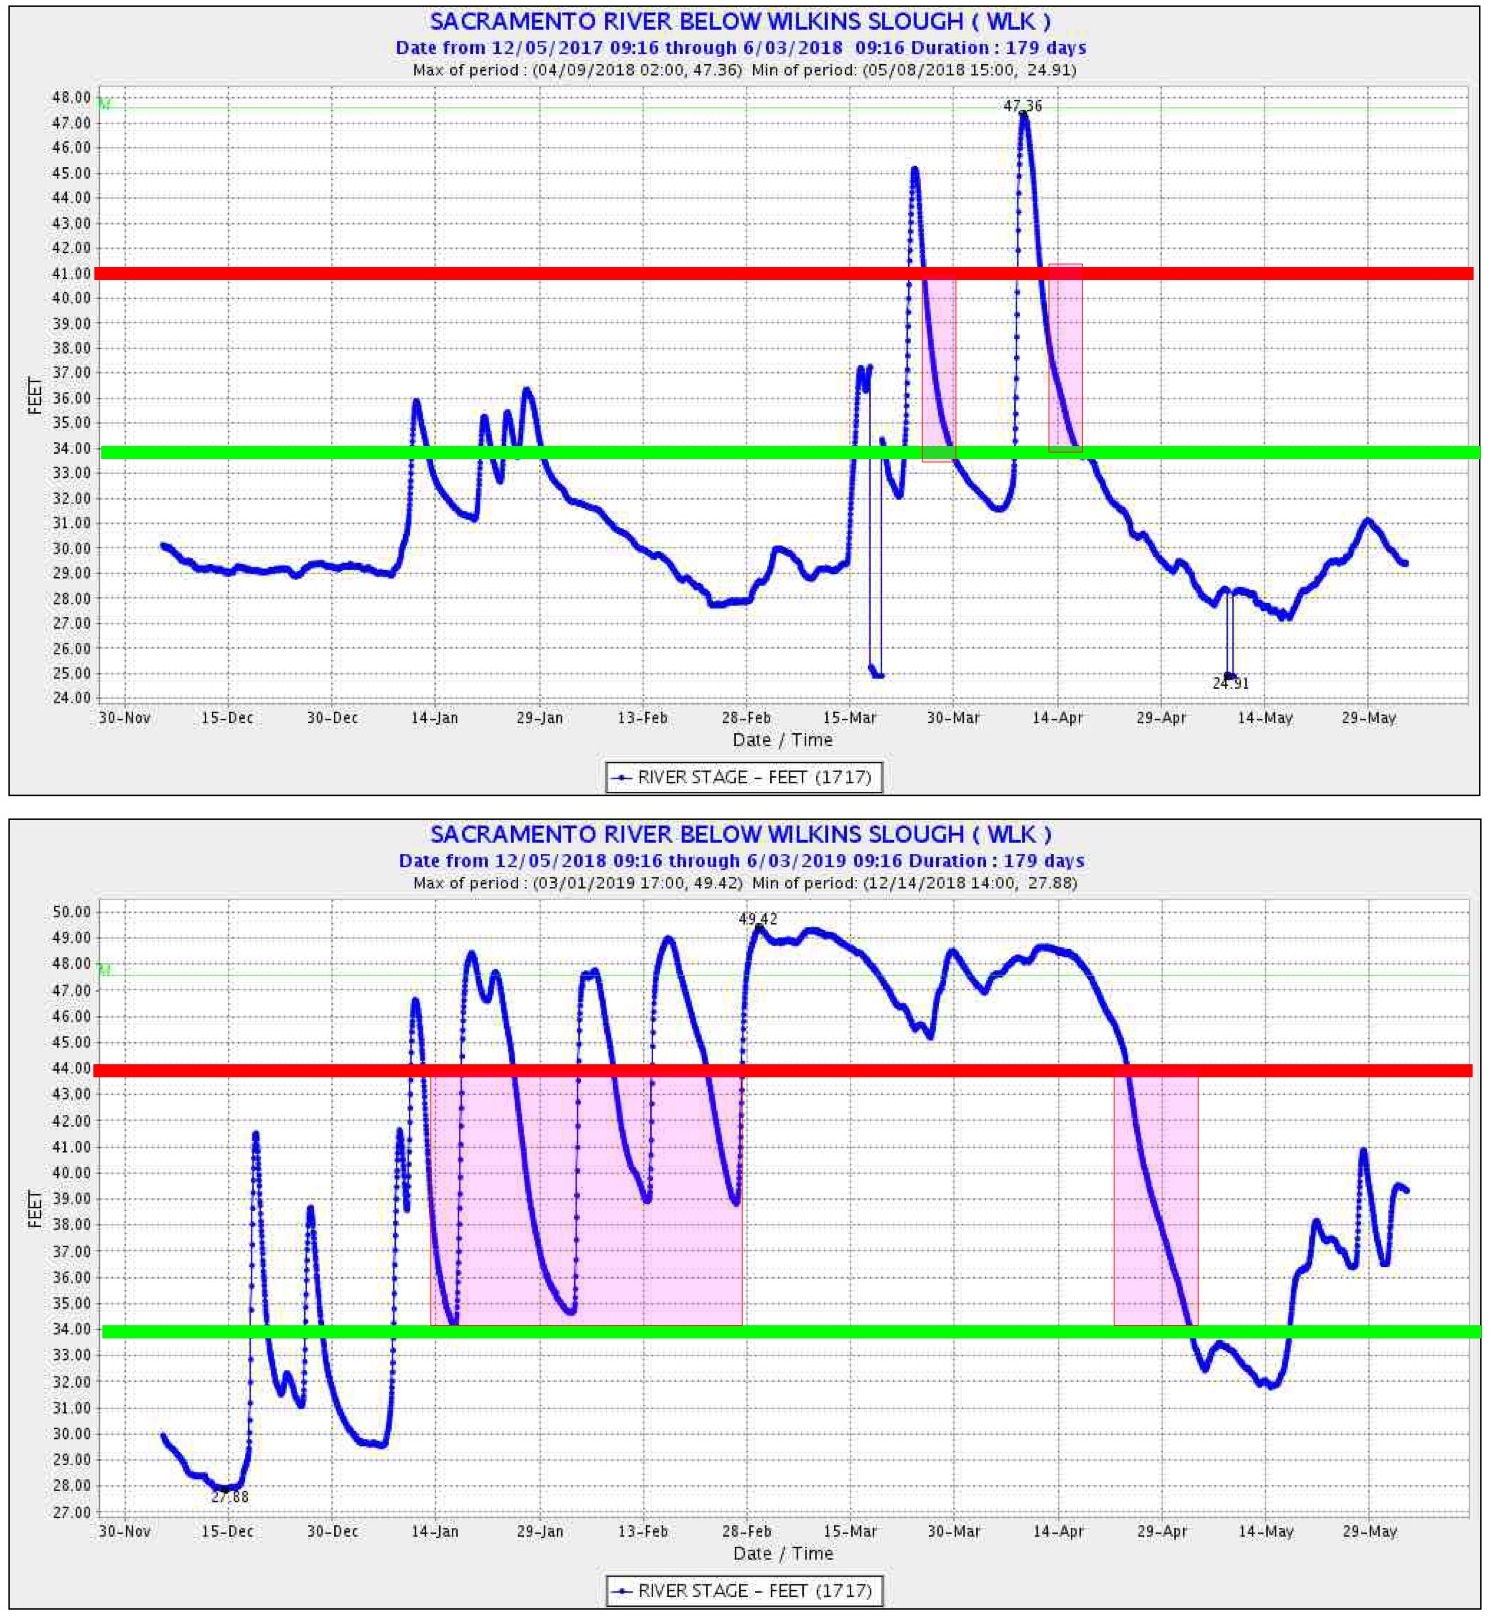
Figure 2. Proposed operation (purple shaded) of Tisdale Weir gates under dry year 2018 and wet year 2019 water level conditions. Gates could be operated at flows above the green line. The weir would normally overflow at water levels in the Sacramento River above approximately 44-ft elevation.
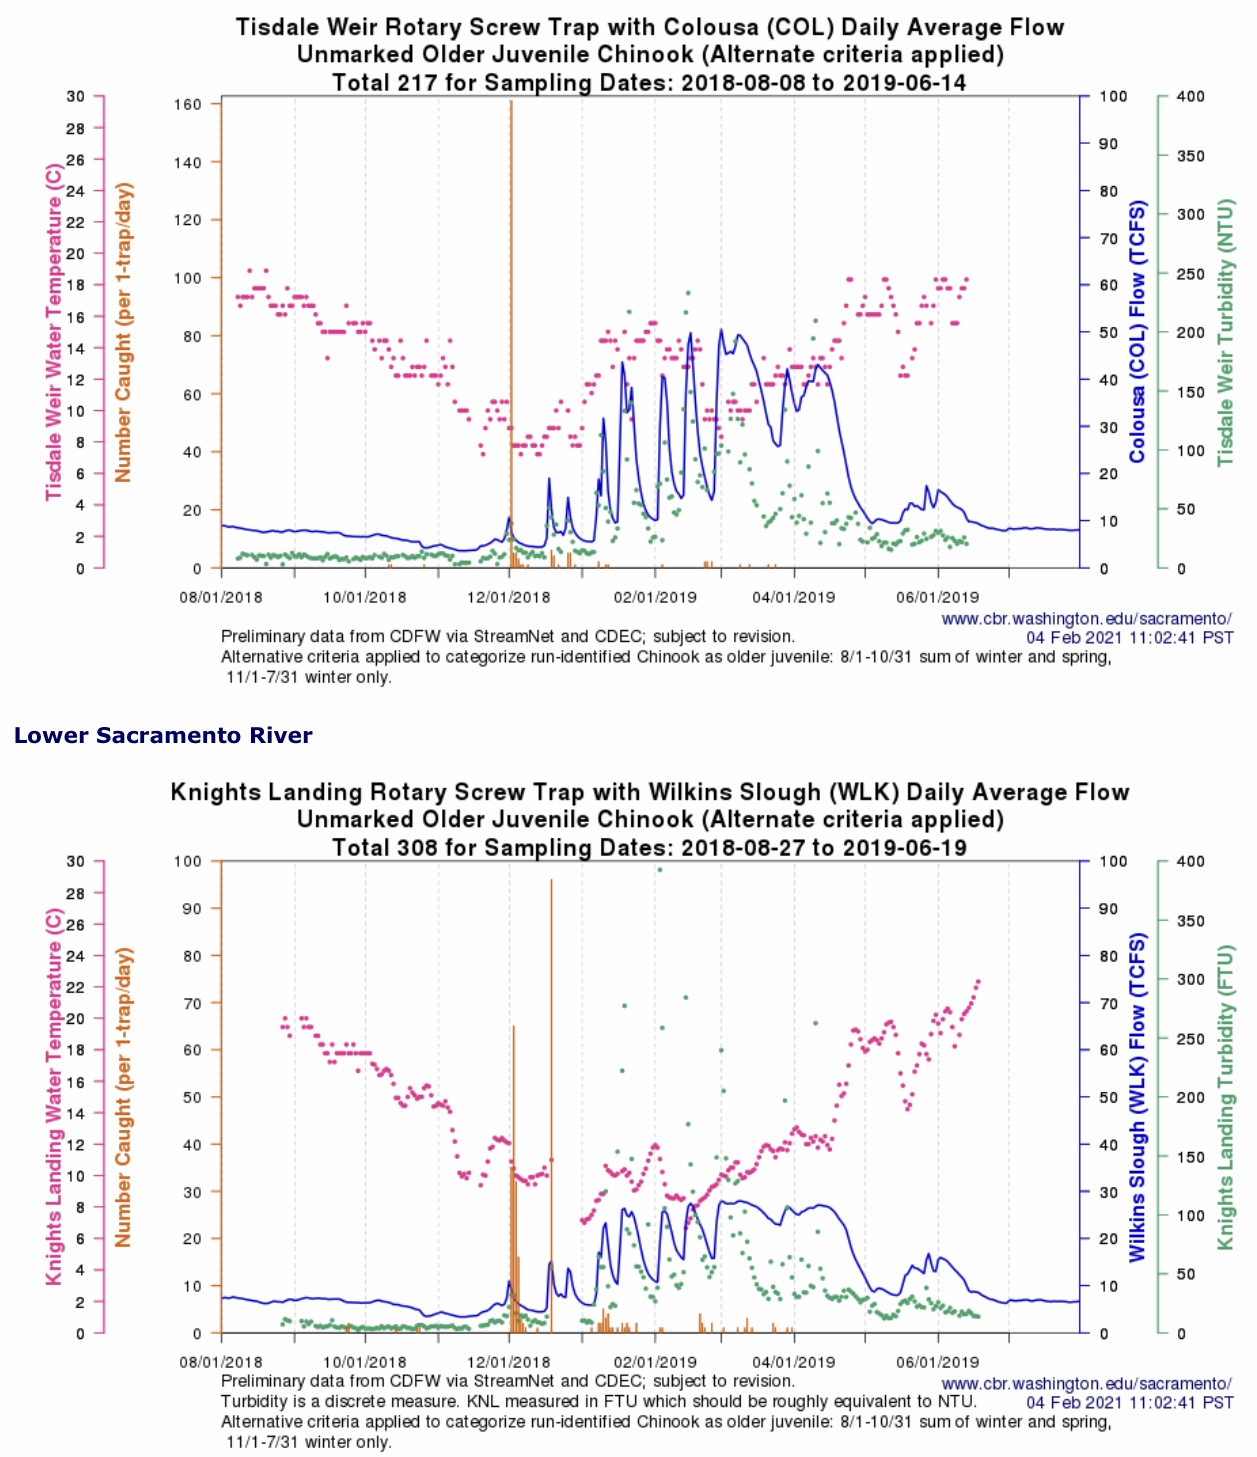
Figure 3. Pre-smolt catch of winter-run-sized salmon in screw traps in lower Sacramento River near the Tisdale Weir in winter-spring 2019.