In a 10/19/2023 post, I discussed how the lack of access to Folsom’s deep cold-water-pool results in delayed natural and hatchery spawning of American River fall-run salmon. During the 2020-2022 drought, Reclamation released water from the lower-level power bypass to provide the cold water (<55ºF) salmon need for spawning (see Figure 1). However, this fall 2024 Reclamation has chosen not to use the power bypass to release cold water (Figure 2), despite higher storage levels than during the recent drought (Figure 3). Lack of cold water delays natural spawning and hatchery egg taking, to the detriment of egg viability and fry production.
Figure 1. Water temperature of water released from Folsom Dam, Oct-Nov 2021. Late October drop in water temperature was from release of cold water from lower level outlet. Also shown is recent average for previous 7 years.
Figure 2. Water temperature of water released from Folsom Dam, Oct-Nov 2024.
Summer 2024 was an unusual summer in an unusual year for salmon in California’s Central Valley.
July 2024 was the hottest ever recorded on earth and in the Central Valley. Record high air temperatures occurred in early July throughout the Valley. A close look at July 2024 provides some valuable insights as to the future climate and salmon in the Valley.
July is an important month for Chinook salmon populations in the reaches of the rivers that are downstream of major dams. Winter-run salmon are at peak spawning in the Sacramento River near Redding (mainly the ten miles below Keswick Dam). Spring-run salmon are holding over the summer in the Trinity River below Lewiston Dam, in the Sacramento River below Keswick Dam, and in Clear Creek below Whiskeytown Dam. (Spring-run salmon are also holding in the Feather River below Oroville Dam and below falls on Butte, Deer, and Mill creeks.) Fall-run salmon have only just begun their journey from the ocean in the Sacramento and Klamath/Trinity rivers.
The goal in summer for the Shasta/Trinity Division of the federal Central Valley Project is to keep dam releases cold (around 50-52oF) for winter-run spawning and egg incubation, and for holding adult spring-run salmon. Dam releases from the stored cold-water-pool supply are prescribed to accomplish the goal. The dams also release water for hydropower, for downstream water supply deliveries, and to meet requirements for salmon habitat and other environmental purposes.
Reclamation must balance these uses in July with protecting the salmon and other fish during the rest of the water year and with maintaining adequate storage for next water year. Reclamation released its draft environmental impact statement for the future long-term operations of the Central Valley Project operating earlier this summer – comments were due in September. Reclamation’s plan is not to meet the needs of the salmon except in wetter years – simply put, to “split the baby.” Reclamation’s proposal for how it will balance the needs of water users and the salmon will lead to the extinction of at least two runs of the salmon.
In the Central Valley, Water Year 2024 turned out to be above normal, after a wet 2023. Shasta and Trinity reservoirs nearly filled during the winter-spring – a good start to end-of-spring conditions. Shasta Lake started July with 4 million acre-feet (maf) in storage (out of a 4.5 maf capacity) and ended July with storage of 3.5 maf (Figures 1 and 2). Trinity Lake began and ended July with 2 maf in storage (out of a 2.5 maf capacity), after transferring about 100 thousand acre-feet (taf) to the Sacramento River in May-June and another 100 taf in July. Water temperatures of released water from both Keswick and Lewiston dams were maintained at the target 50-52oF. The secret to this success was retention of sufficient storage and cold-water pool supplies in Shasta and Trinity reservoirs – a relatively easy task in an above normal water year after a wet year.
The challenge for Reclamation in the past, present, and future is to retain sufficient storage and cold-water-pool supplies to maintain the 50-52oF dam release targets through the fall of all water year types, especially the drier years. Reclamation tried in the 2021-2022 drought, but grievously failed to meet the needs of salmon (Figures 2-4). Now Reclamation is asking the state and federal resources agencies for permission to explicitly plan to not meet the needs of the salmon in drier years.
Absent such an agreement to fail in drier years, Reclamation will have to reduce hydropower production/revenues and, most critically, the amount of irrigation deliveries to water contractors. It will have to reduce already dry-year-constrained water deliveries to retain more stored water and the necessary cold-water-pool supply for salmon. It will have to carry over more storage supply at the end of summer, have greater amounts stored by the end of spring, and deliver less water in many years from spring through fall. There is no choice if Reclamation is to meet promises and commitments to maintain the salmon populations in the Klamath/Trinity and Central Valley.
For a more insight on what the plan entails and how better to meet the needs of salmon, see CSPA’s alternative plan submitted in 2021 to save salmon in a drought year like 2021.
Figure 1. July 2024 conditions in the Shasta-Trinity Division of the CVP. Blue numbers are streamflows (cfs) and reservoir water storage levels. Green numbers are average water temperatures (degrees F).
Figure 2. May-October Shasta Reservoir storage levels in acre-feet 2021-2024.
Figure 3. Trinity River flows and water temperatures below Lewiston Dam 2020-2024.
Figure 4. Water temperature of Sacramento River below Keswick Dam 2021-2024. Note the cold-water-pool supply in Shasta Reservoir was depleted by the send of August in drought years 2021 and 2022 despite attempts to conserve the supply in spring by releasing warmer surface waters from the reservoir.
The spring-run Chinook salmon in Butte Creek had extremely low spawning runs in 2023 and 2024 (Figure 1).
In part, this was because all Sacramento River Valley salmon populations are collapsing due to the direct and indirect effects of the 2020-2022 drought and related management actions, on top of climate change and catastrophic fires.1 Drought conditions in 2021 and 2022 in the spawning rivers, lower Sacramento River, Delta, Bay, and ocean all contributed to poor juvenile salmon survival.
The poor number of Butte Creek spawners in 2024 is also related to the high pre-spawn mortality of adult salmon in Butte Creek in 2021,2 as a result of drought conditions during the winter-spring upstream migration and summer-fall holding and spawning.
Despite the failures of brood years 2020 and 2021, there is optimism for brood year 2022 and its spawning run in 2025 (Figure 2). Water year 2023 was a wet year, with good young survival conditions for juvenile salmon. Though brood year 2022 had only about 3700 spawners, , the returning adults were able to migrate and spawn with minimal stress in a drought year.
The uncertainty that remains is the survival of brood years 2023 and 2024, because of their potential small number of returning spawners in 2026 and 2027. Water year 2024 was a above-normal water year, but it was not without its stresses.3 Early indicators suggest 2025 could be a dry year. The potential for small runs to lead to strong brood years also leaves room for doubt given that four recent years of poor spawners led to poor recruitment (four dots at lower left in Figure 2).
The poor spawner numbers in 2023 and 2024, coupled with the uncertain forecasts for runs in 2025-2027, represent a serious population threat that calls for strong actions to save the species and rebuilding the spawning stock.
Winter Actions
Winter fry-fingerling emigration down lower Butte Creek past the Parrot-Phelan Diversion Dam and the primary screw trap counting station occurs in earnest beginning in mid-December, with a peak in January. The peak in fry emigration (the main element of juvenile salmon production from Butte Creek) occurs during early winter precipitation events. The fry, often still feeding on their yolk sac, leave the cold turbid creek heading for warmer, low-velocity food-rich floodplain waters of the Butte Basin and the Sutter Bypass, and for the tidewater of the Bay-Delta.
Strong winter growth is essential for good survival (good growth rates, and lower rates of starvation and predation). Strong winter growth promotes early smoltification and entry to the ocean. The main success factors in winter are adequate transport flow, access to and from floodplain habitats in the Butte Basin and Sutter Bypass, and low predation rates.
Spring Actions
Pre-smolt, sub-yearling smolts, and yearling smolts emigrate in modest numbers from Butte Creek in spring. These late migrants contribute to population numbers and genetic diversity. Success of these late migrants depends on high transport rates, low water temperatures, minimal diversion to often excessively warm floodplain habitats, minimal entrainment into unscreened water diversions, and minimum flow-through rates from river to floodplain habitats.
Adult spring-run salmon migrate from the Bay to upper Butte Creek in spring. They require adequate flows and water temperatures often not available in drought years, especially in late spring.
Specific Winter and Spring Actions to Consider:
Minimize water diversions at Parrot-Phelan Diversion Dam (and other creek diversions). In early winter, prioritize flow in Butte Creek over diversions for waterfowl pond flood-up and rice field decomposition (Figure 3), except in high runoff conditions. In spring, maintain flow in Butte Creek at the highest levels possible for attraction and holding except in early spring flood conditions.
Minimize the flow split into Sanborn Slough at bifurcation weir. Do not force more than 30% of Butte Creek flow into Sanborn Slough, which reduces important benefits of floodplain access and inundation.
Minimize diversions in Butte Basin and Sutter Bypass.
Keep Butte Slough Outfall closed except under Butte Creek flood relief conditions; instead, maximize flow through Butte Basin and Sutter Bypass.
In the event of dry-drought conditions, capture juvenile salmon at screw trap locations and Parrot Phelan Screen Bypass, and transport them to the mouth of Butte Creek, Verona, a conservation hatchery, downstream floodplain habitat, or a Bay-Delta location.
Maintain adequate transport flows in the lower Yolo Bypass and lower Sacramento River, and into and out of the Delta in winter, to maximize survival to the Bay and ocean.
Figure 1. Butte Creek spring-run salmon population (escapement or spawning run size) from 1975 to 2024. Red circle highlights dramatic decline in 2023 and 2024.Figure 2. Spawner/recruit relationship for Butte Creek spring-run salmon with three-year lag between spawners and recruits. Numbers shown in chart are return years (recruits). Blue is a wet year two years prior to spawning run when salmon were rearing and migrating to the ocean. Green are normal water years. Red are dry and critically dry years. Year labeled 25 is expected return run in 2025. Purple line is potential range of runs in 2026 and 2027 depending on success of brood years 2023 and 2024.Figure 3. Water diversion rate at Parrot-Phelan Diversion Dam fall 2023 to fall 2024 (water year 2024).
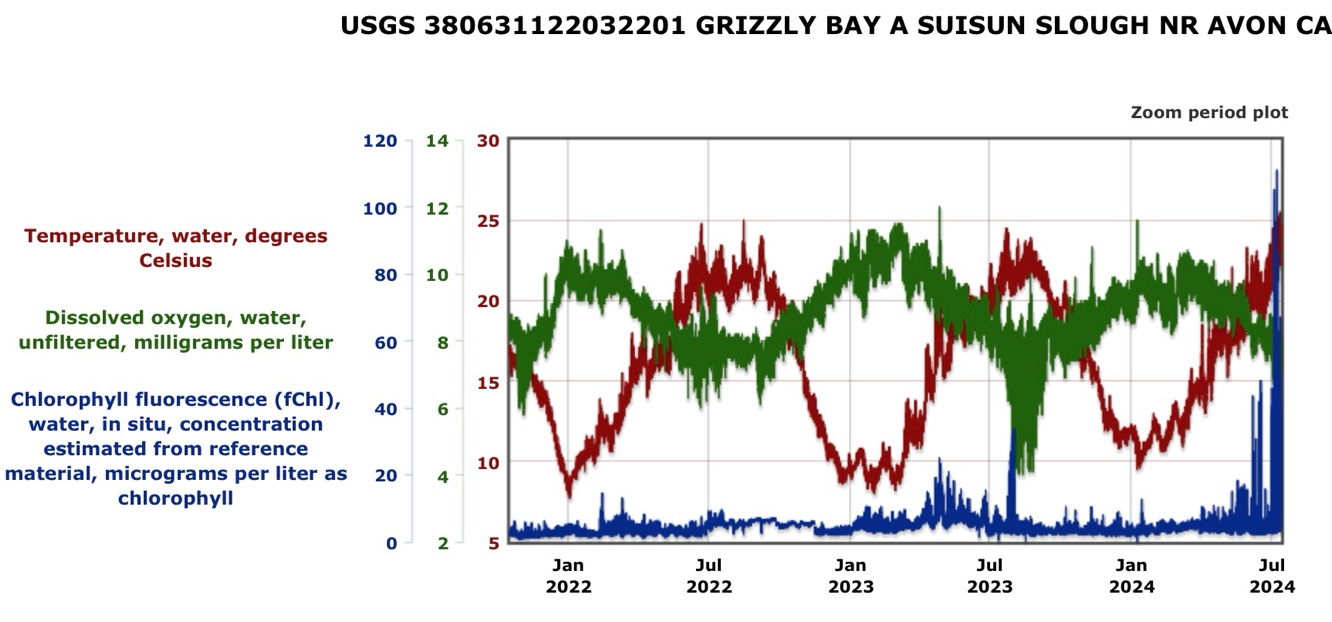
This is a follow-up to a July 8 post on summer 2024 aquatic habitat conditions in the Bay-Delta Estuary. In this post, I focus on mid-July conditions after yet another summer heat wave. I am concerned that conditions are building for yet another sturgeon die-off this summer. Sturgeon mortality is caused by excessively warm water and algae blooms that eventually lead to rapid algae die-off and associated extremely low dissolved oxygen levels (<5 mg/l) throughout the Bay. Such conditions became acute in summer of drought year 2022 and led to the deaths of thousands of adult sturgeon and other Bay fishes.
Conditions in the Bay are already worse this year at the beginning of summer than in 2022 or 2023 (Figure 1). Water temperatures and chlorophyll concentrations are higher, with dissolved oxygen concentrations falling.
Figure 1. Water temperature (C), dissolved oxygen (mg/l), and chlorophyll concentration (micrograms per liter) in Grizzly Bay 2022-2024.
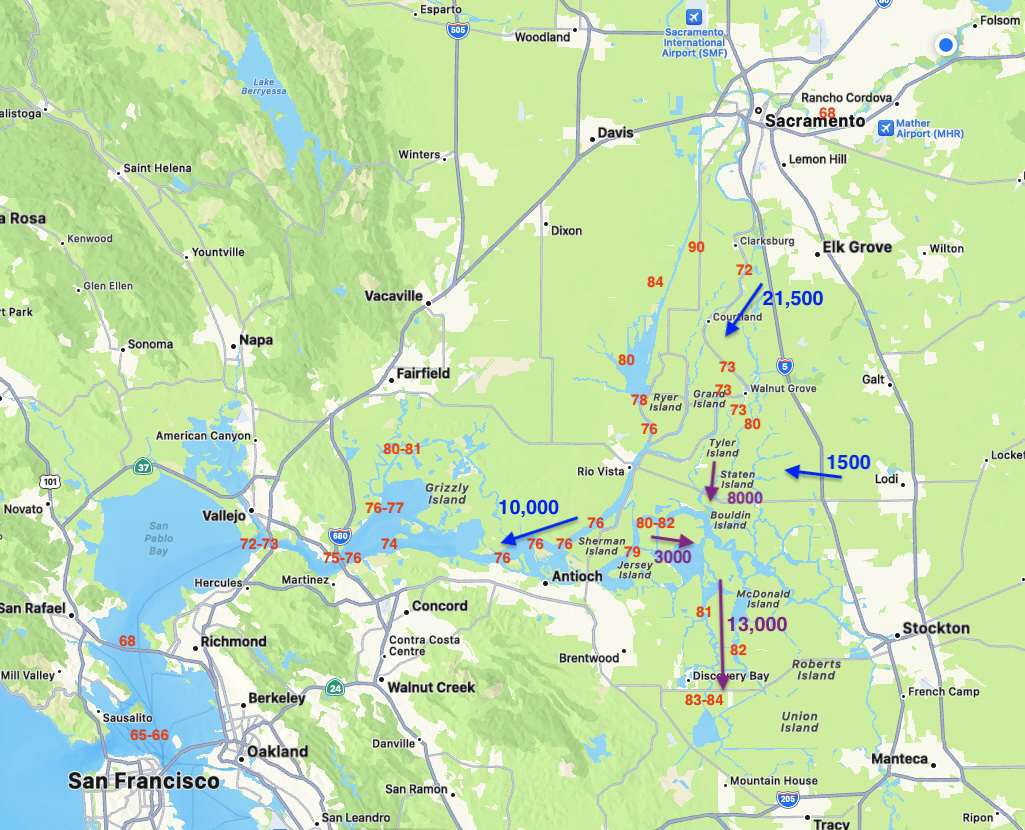
Of greatest concern is the already warm water temperatures in parts of the Bay-Delta despite a relatively high Delta inflow with cooler than normal water temperatures (Figure 2). Water temperatures have exceeded 75oF in the west Delta and east Bay low-salinity zone of the estuary (the prime summer habitat of endangered Delta smelt). Water temperatures of 75-77oF (24-25oC) are lethal to Delta smelt.1
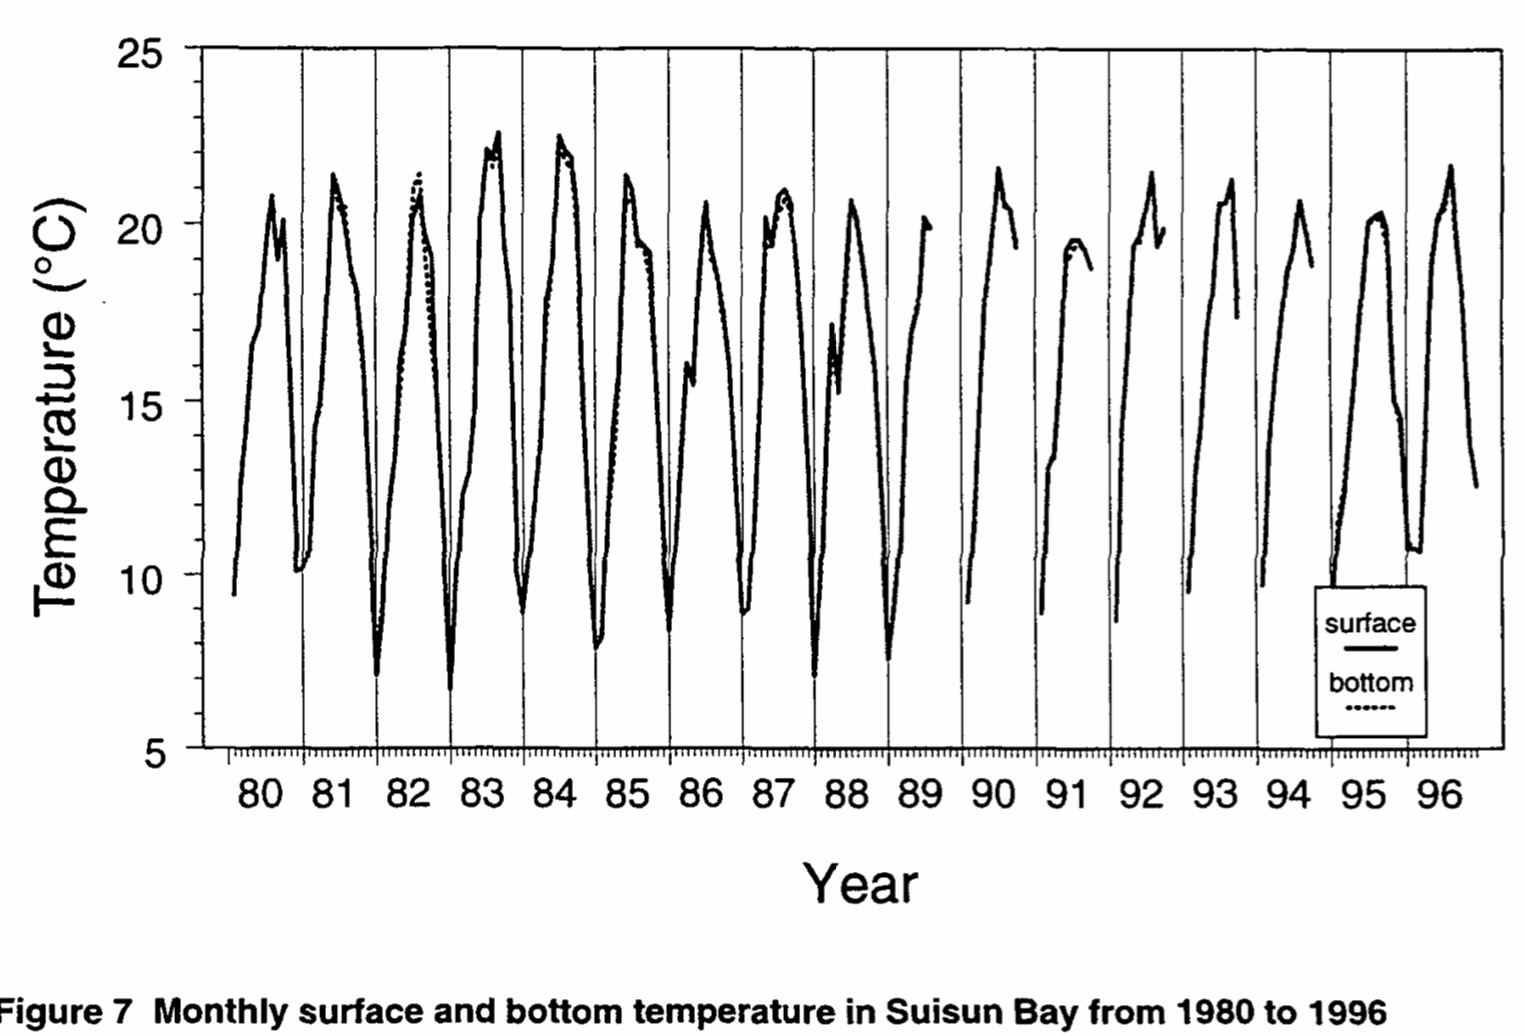
In the decades of the 80’s and 90’s, Delta smelt were still relatively abundant although suffering severely in drought years. Water temperatures rarely exceeded 70oF in Suisun Bay (Figure 3). The reason for the difference is likely a combination of higher air temperatures, lower Delta outflows, and higher Delta water diversions in recent decades. In some years lower, warmer Delta inflows aggravate the problem, but not this year (2024) when inflows were kept high to sustain high Delta water diversions.
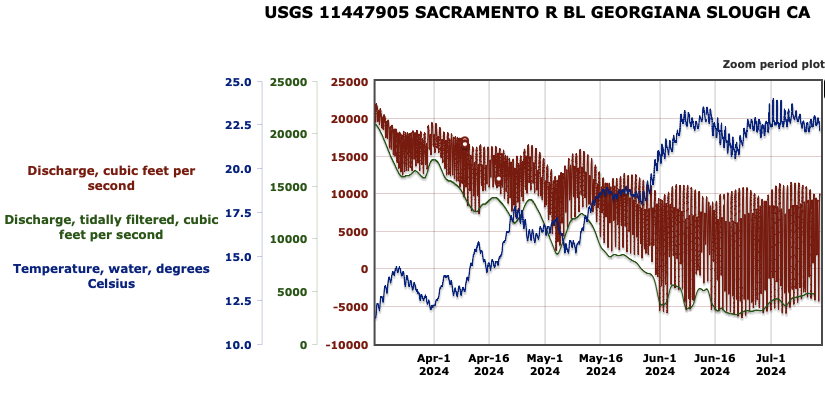
One area of warming of the lower Sacramento River channel that deserves special attention is the north Delta below the Delta Cross Channel and Georgianna Slough bifurcation. Much of the water destined for south Delta exports is diverted from the Sacramento River through these channels. In the reach below the diversion channels the river temperature increased several degrees (73 to 76oF) in early July. One explanation is that of the 21,000 cfs Delta inflow at Freeport only 5000 cfs remained below the entrance to Georgianna Slough (Figure 4). The missing flow passed into Georgianna Slough, the Delta Cross Channel, and Miners/Steamboat Sloughs, all reaches where the flow warmed to even a greater degree. At Rio Vista and the west Delta, where the water exits the Delta for the Bay, water temperatures reached 76oF as total outflow increased to 10,000 cfs from the 5000 cfs in the lower Sacramento River channel and 5000 cfs returning warmer water from the Cache Slough complex and San Joaquin River channel. Waters in the wide, large, open channel at Rio Vista also slowed, with a stronger influence of the tides, especially during the recent heat waves (Figure 5).
I contend that the high rate of Delta water diversion at Georgianna Slough and the Delta Cross Channel contributed to the warming by forcing cooler water from the Sacramento River Delta inflow into the central Delta where it warmed or was diverted.
I recommend closing the DCC and reducing Delta water diversions in July and August to reduce Bay-Delta water temperatures and minimize the potential for excessive algae blooms, low dissolved oxygen, and sturgeon die-offs in the Bay this summer. I further recommend that Delta inflows be sufficient to maintain water quality standards for water temperatures in the lower Sacramento River above the Delta.
Figure 2. Bay-Delta conditions showing daily average flows in blue and purple, maximum daily water temperatures in red on or about July 12, 2024.Figure 3. From Baxter et al 1999 Figure 7.Figure 4. Sacramento River flow and water temperature downstream of the entrance to Georgianna Slough, April-July 2024. Note the effect of two closures of DCC in early June that forced more water down the Sacramento River channel cooling the river below slightly. Opening of the DCC at the beginning of June reduced flow and increased water temperature in the river below Georgianna Slough. Note also that at the lower net flows, the effect of the tides was greater, slowing transit net flow rate, which likely increased the rate of warming.Figure 5. Air and water temperature at Rio Vista Bridge June 1 to July 1, 2024. Note the 1 to 2.5oF influence of heat waves on water temperature. The heat wave at the beginning of July with an average daily temperature of 90oF is exceptional for Rio Vista.
It is unlikely Delta smelt would survive extended periods above 72oF; they would not do well in water temperatures above 68oF. ↩
This is an update on my last several posts on spring habitat conditions in the Bay-Delta in this Above Normal water year. After a wet winter-spring with good Delta and Bay conditions in Above Normal water year 2024, June 2024 water project operations returned the river, Delta, and Bay to drought-year conditions. I warned in late June that habitat conditions (flows and water temperatures) were getting bad and that a forecasted heat wave could make conditions even worse. It’s happened.
The State Water Project (SWP) and the Central Valley Project (CVP) started moving water south in earnest at the beginning of July. Shasta, Oroville, and Folsom reservoir releases increased, raising Delta inflow at Freeport to 20,000 cfs (Figure 1). SWP south Delta exports are at maximum at 6,000 cfs (Figure 2). CVP south Delta exports were already maxed out at 4,000 cfs. The Sacramento River contractors also removed their portion of the Shasta pie (6,000 cfs, Figure 3), to make the total water project haul from the Sacramento Valley 16,000+ cfs. Note this total does not include water diverted upstream of the Delta from Sacramento tributaries or from the San Joaquin River and its tributaries.
Impact to Freeport Water Temperature
On the positive side, the increased Delta inflow at Freeport dropped water temperatures slightly at Freeport as the heat wave commenced (Figure 4). I contend that the water temperature would have increased significantly with heat wave if the flow had not increased.
Impact to Rio Vista Water Temperature
On the negative side, the main problem from the state action was increased water temperature at Rio Vista (to 75oF) due to the combination of higher south Delta exports, high air temperatures, and lower Delta outflow (Figure 5). I contend that slightly higher Delta inflows and lower south Delta exports (thus, higher Delta outflow and higher net Rio Vista flows) could have kept Rio Vista water temperatures closer to 72oF.
Impact to Lower Sacramento River Water Temperature
On the positive side, the increased flow in the lower Sacramento River from the Shasta Reservoir releases (see Figure 1) kept lower Sacramento River water temperatures from increasing during the heat wave (Figure 6). That experiment proved the potential benefit of such an action on its own
Impact to Bay Water Temperature
Bay water temperature during the early July heat wave also increased to 74-75oF during ebb tides, as warm Delta (Rio Vista) water entered the eastern Bay (Figures 7 and 8). On flood tides, cooler 68-70oF water returned to the eastern Bay. After several days of these conditions, the eastern Bay warmed by 2-3oF. I contend that if Delta outflow had not dropped to 8000 cfs with the higher south Delta exports, and the Delta (Rio Vista) had thus been maintained closer to 72oF, that Bay temperatures would have been several degrees cooler (likely less than 72oF).
Conclusion
The State Water Project should not have started full transfer of Sacramento Valley reservoir water to southern California via its south Delta export pumps during an early July heat wave. Such action compromised San Francisco Bay’s already-stressed environmental conditions, which could lead to fish die-offs in the Bay again this summer.
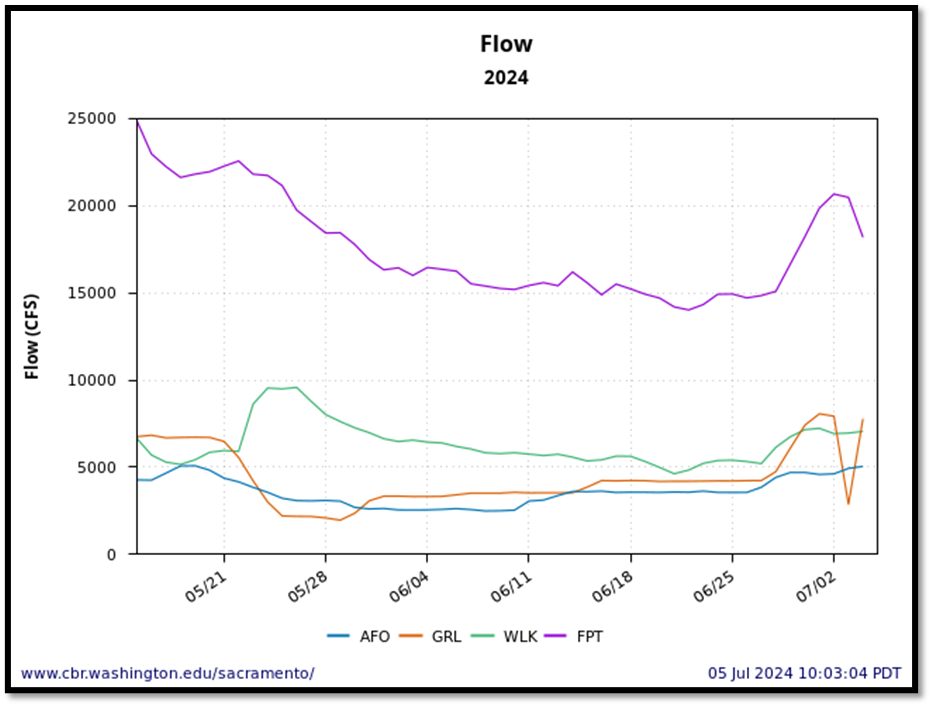
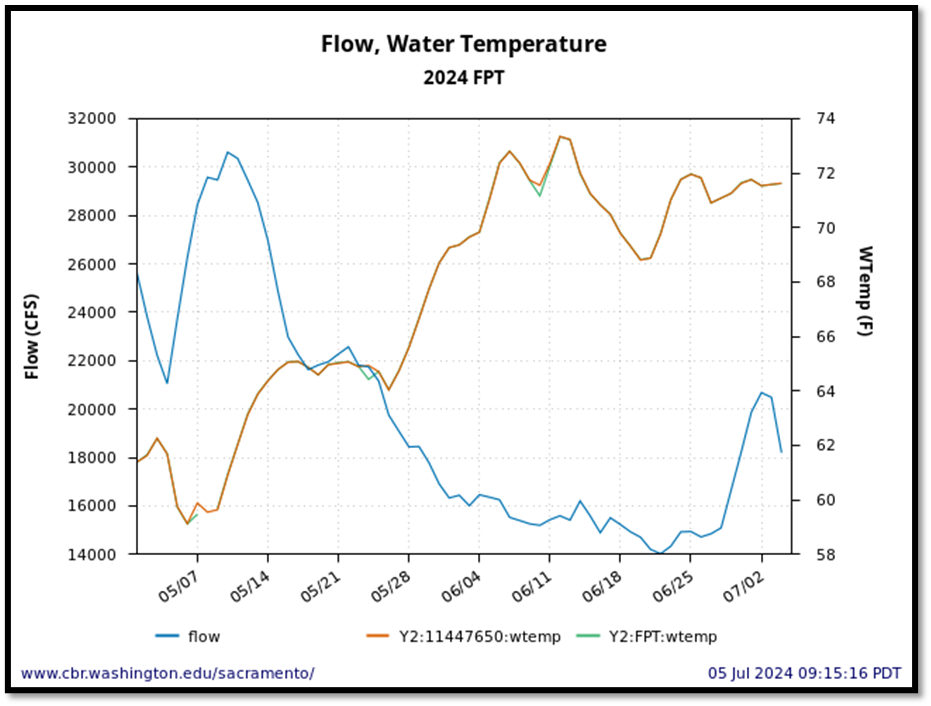
Figure 1. American (AFO), Feather (GRL), and Sacramento River (WLK) flows, making up Delta inflows at Freeport (FPT) May 15-July 5, 2024.
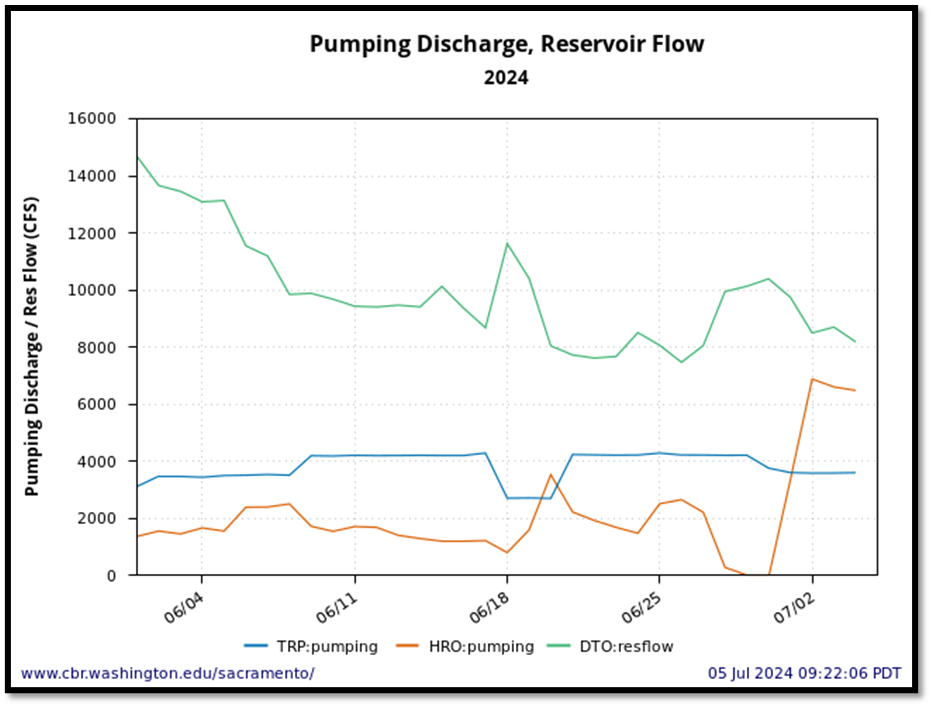
Figure 2. Delta outflow (DTO) and CVP’s Tracy (TRP) and SWP’s Harvey Banks (HRO) export rates 6/1-7/5, 2024.
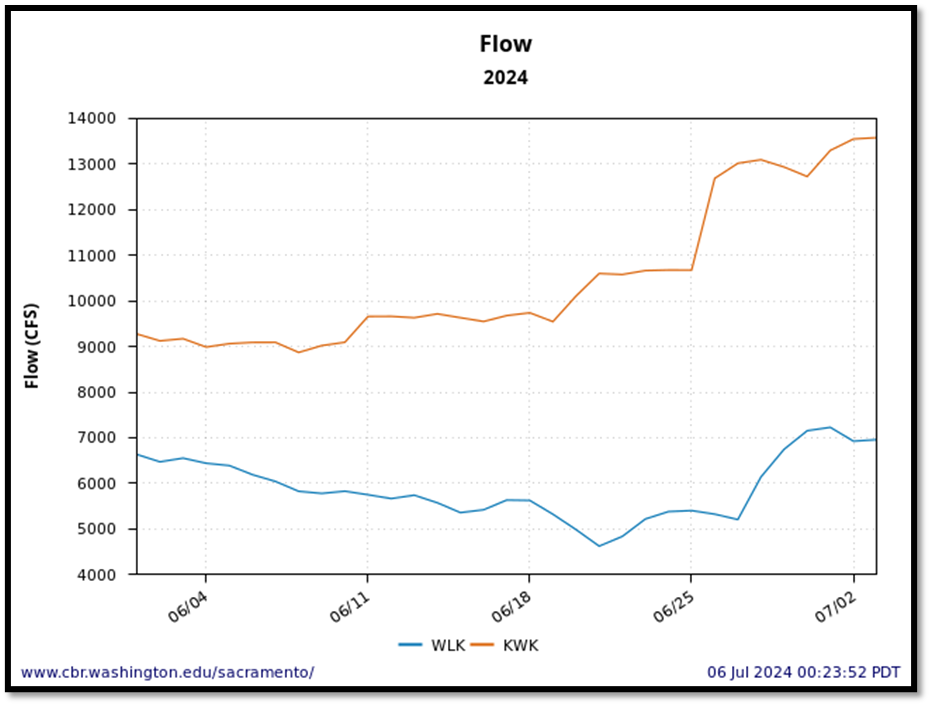
Figure 3. Sacramento River June 2024 streamflows at Keswick Dam (RM 300) and Wilkins Sough (RM 120) gages. Diversion loss equals difference plus above-Wilkins tributary inputs.
Figure 4. Sacramento River channel flow and water temperature at Freeport (FPT), 5/1-7/5 2024.
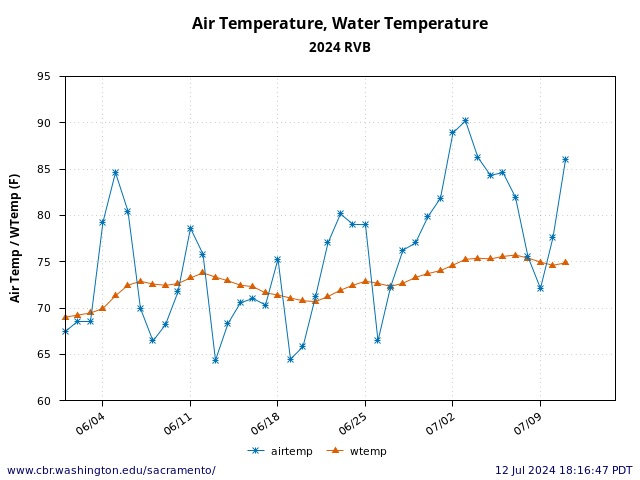
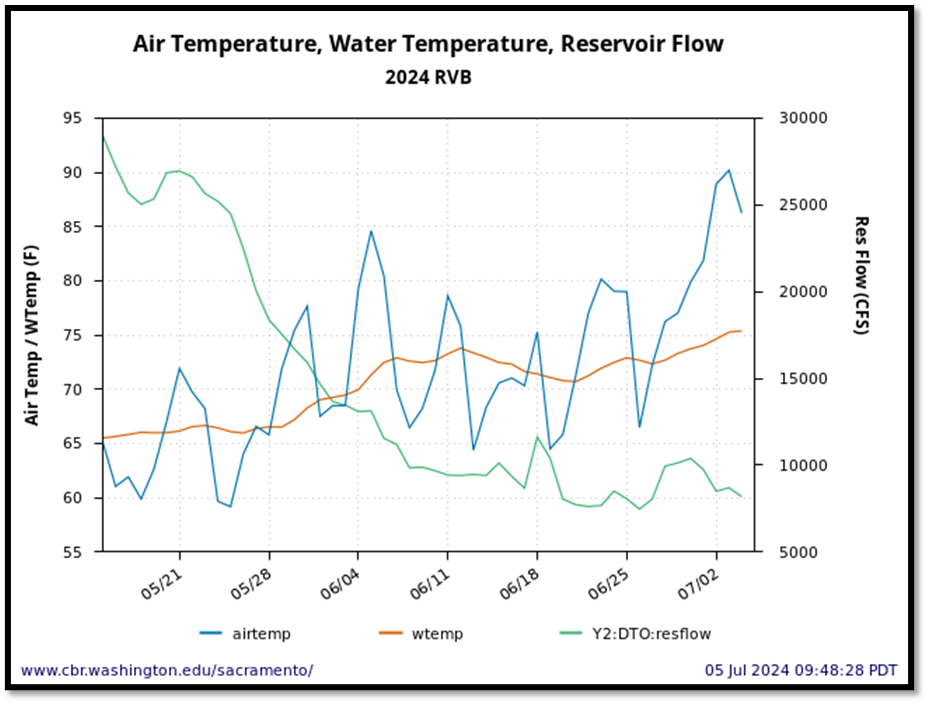
Figure 5. Water and air temperature at Rio Vista Bridge gage with Delta Outflow 5/15-7/5, 2024.
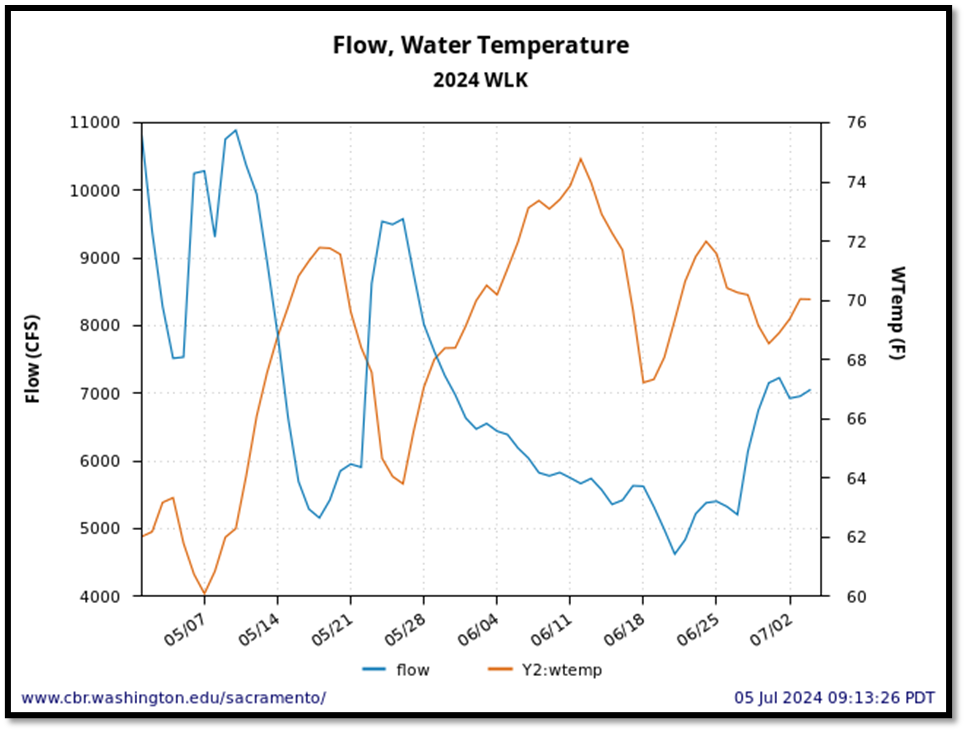
Figure 6. Sacramento River channel flow and water temperature at Wilkins Slough (WLK), 5/1-7/5 2024.
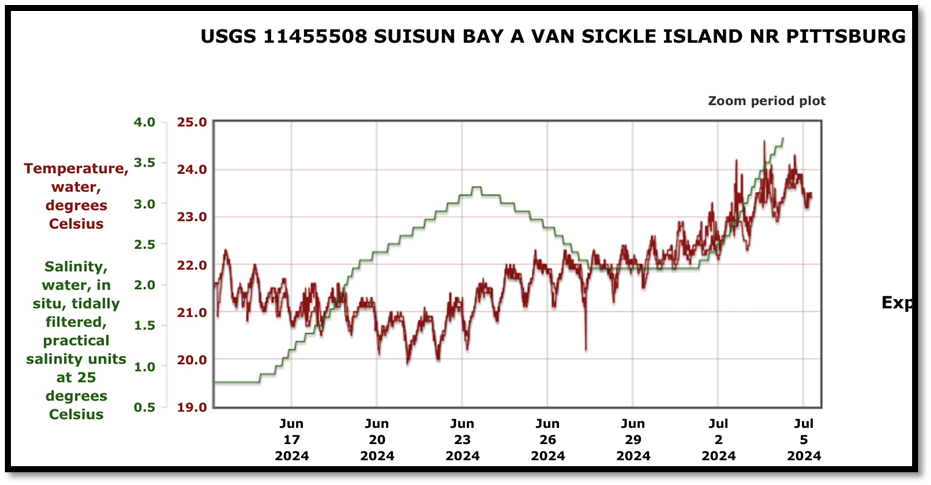
Figure 7. Tidally filtered salinity and water temperature in eastern Suisun Bay near Pittsburg, CA. 6/15-7/5, 2024.
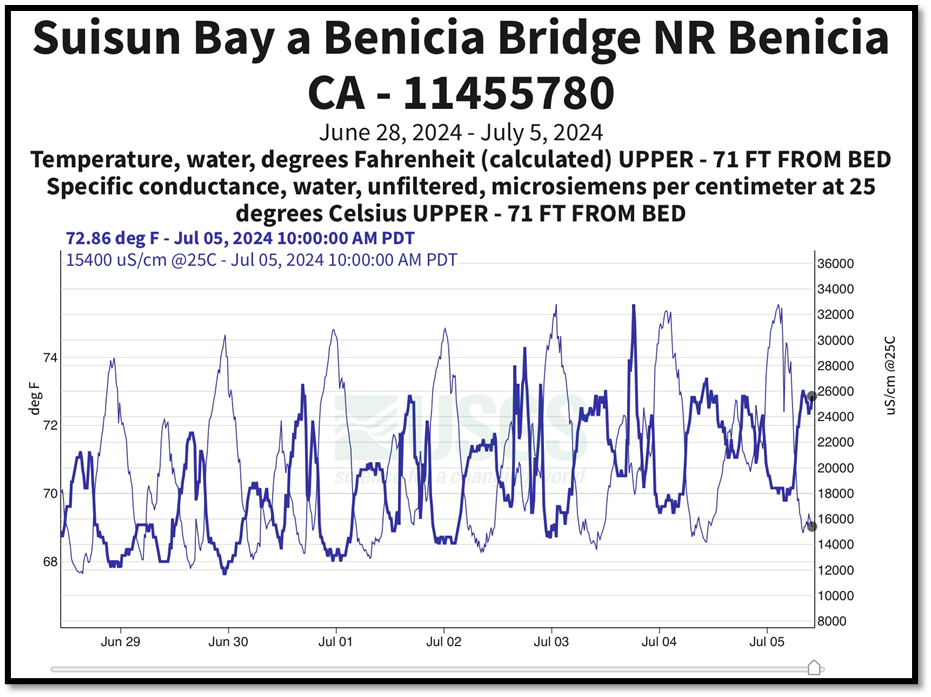
Figure 8. Salinity (EC) and water temperature in western Suisun Bay at Benicia Bridge near Benicia, CA. 6/28-7/5, 2024.