The US Bureau of Reclamation (Reclamation) is proposing a “Delta Smelt Fall Habitat Action” that would eliminate the requirement to increase outflow from the Delta in the late summer of this wet water year.1 The “Fall X2” flow increase that Reclamation has placed on the chopping block is a major provision in the 2008 Delta smelt biological opinion (BiOp). Reclamation describes the substitute proposed Action in a summary its webpage:
The Proposed Fall Habitat Action (Proposed Action) for Delta Smelt habitat in Water Year (WY) 2019 will achieve the Action 4 objective. Action 4 of the 2008 BO requires adaptive management to ensure that the implementation addresses the uncertainties about the efficiency of the action. Action 4 also states that as new information is developed and as circumstances warrant, changes by the Service to the Fall X2 action itself may be necessary. The Proposed Action is a plan to adaptively manage and modify its operation of the CVP/SWP under RPA Action 4.2
In brief, the “circumstances” that “warrant” this “adaptive management” are that getting rid of Fall X2 will allow Reclamation to export more water from the Delta this fall.
In August 2019, Reclamation issued an Environmental Assessment (EA) of the Proposed Fall Habitat Action. Though the Action will unravel a major component of the 2008 Biological Opinion for smelt, the comment period was 15 days. CSPA submitted comments; some of them are restated below, in response to citations from the “Effects Analysis,”3 an appendix to the Environmental Assessment.
The Effects Analysis quotes the BiOp to portray the Proposed Action as a scientific investigation, stating:
“[T]here is a high degree of uncertainty about the quantitative relationship between the size of the Action described above and the expected increment in Delta Smelt recruitment or production.” (p. 1).
Comment: After 2011, it has been nearly impossible to measure population response to changes in management because the smelt population has become so low. Likewise, a negative response cannot be detected at the present population level. The only certainty to be gained from harming a nearly extinct population even more is that Reclamation will increase exports from the south Delta.
The Effects Analysis selectively calls out results of the first implementation of the Fall X2 requirement in 2011:
“Abiotic habitat did increase in 2011 as predicted from the AMP, but other variables such as zooplankton abundance were too variable to draw a conclusion, and Delta Smelt growth rate comparisons remain incomplete as of 2019.” (p.2)
Comment: Following implementation of Fall X2 flows, smelt abundance increased sharply in the fall 2011 index. A quick look at zooplankton 2011 vs 2010 (Figure 1) also indicates an increase in zooplankton (key smelt food source) in Suisun Bay/Marsh in 2011.
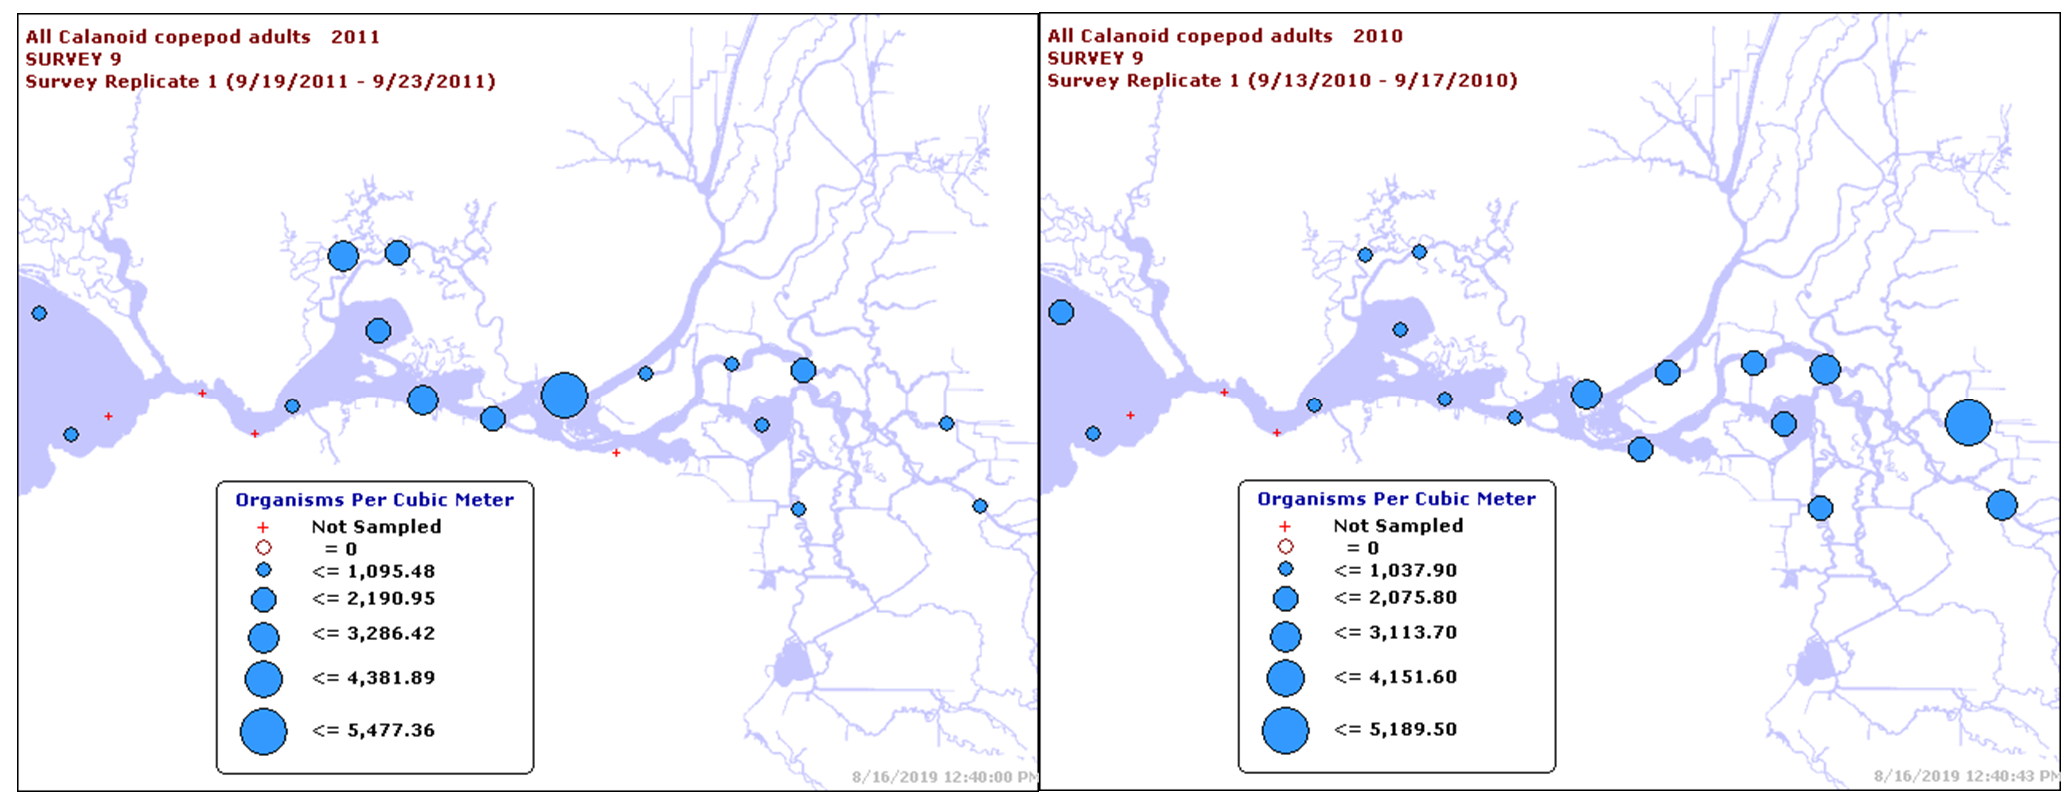
Figure 1. Zooplankton (key Delta smelt food source) in September 2011 and 2010.
Note increased abundance downstream in 2011.
The Effects Analysis tries to explain the lack of response of Delta smelt to the 2017 Fall X2 action as a function of water temperature, concluding that the action was just futile:
In 2017, a Fall X2 adaptive management action was implemented. The results of the 2017 monitoring program were evaluated in the IEP’s 2019 draft FLOAT-MAST, which concluded that summer water temperatures were a major factor in the condition of Delta Smelt in 2017, stating at p.102: Given the long periods in July and August >22C we are confident that water temperature had a major negative effect on Delta Smelt in 2017 and is likely a primary factor in the lack of response of the Delta Smelt population to the high flows. And at p. 104: Dynamic biotic components were somewhat better in 2017; however, the lack of response of the Delta Smelt population suggests that any benefits of changes in the habitat were minimal. (p. 3)
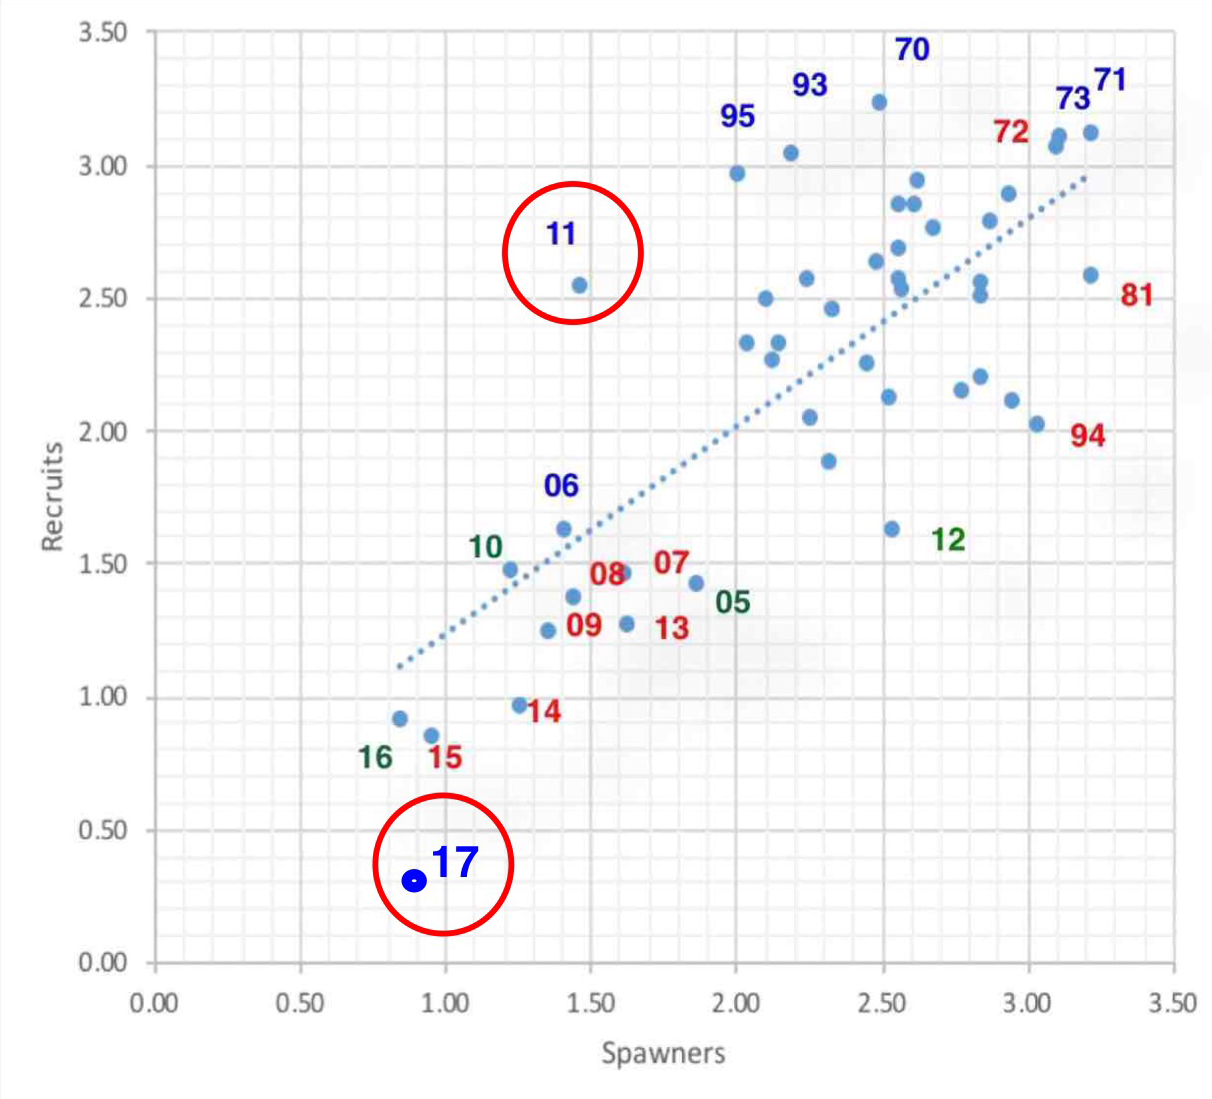
Comment: It is true that recruitment of Delta smelt in 2017 was exceptionally low, despite the Fall X2 action. This is because the number of adult spawners in 2017 was at a record low (Figure 2).
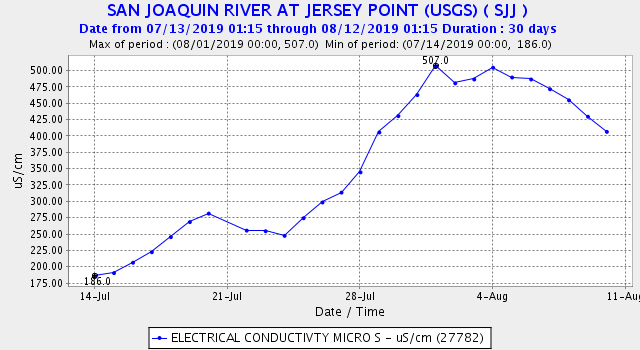
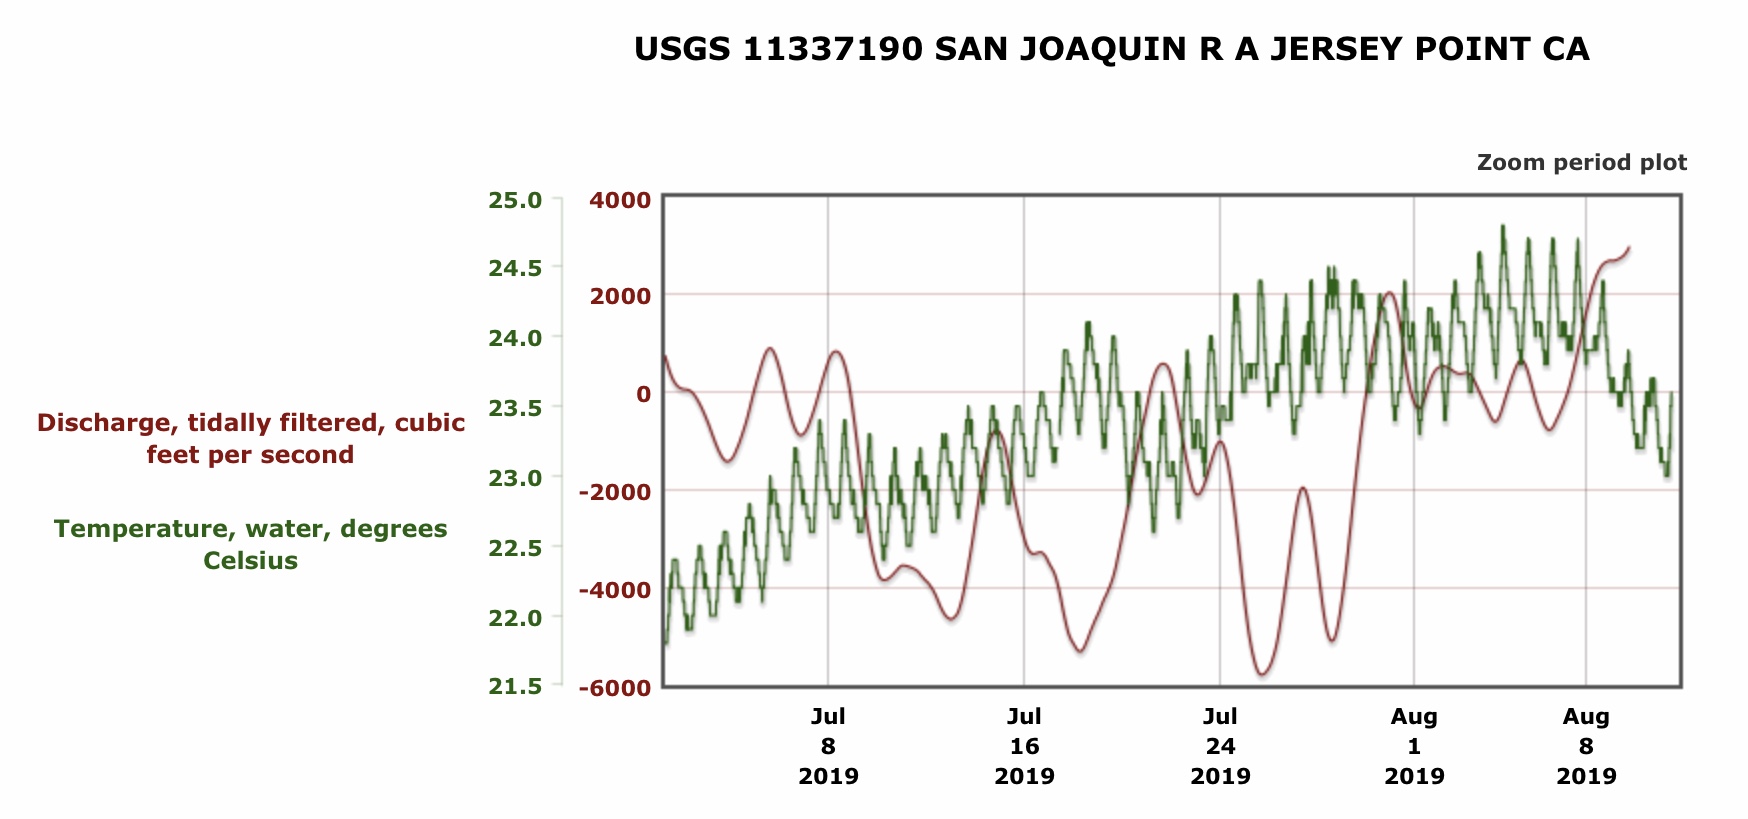
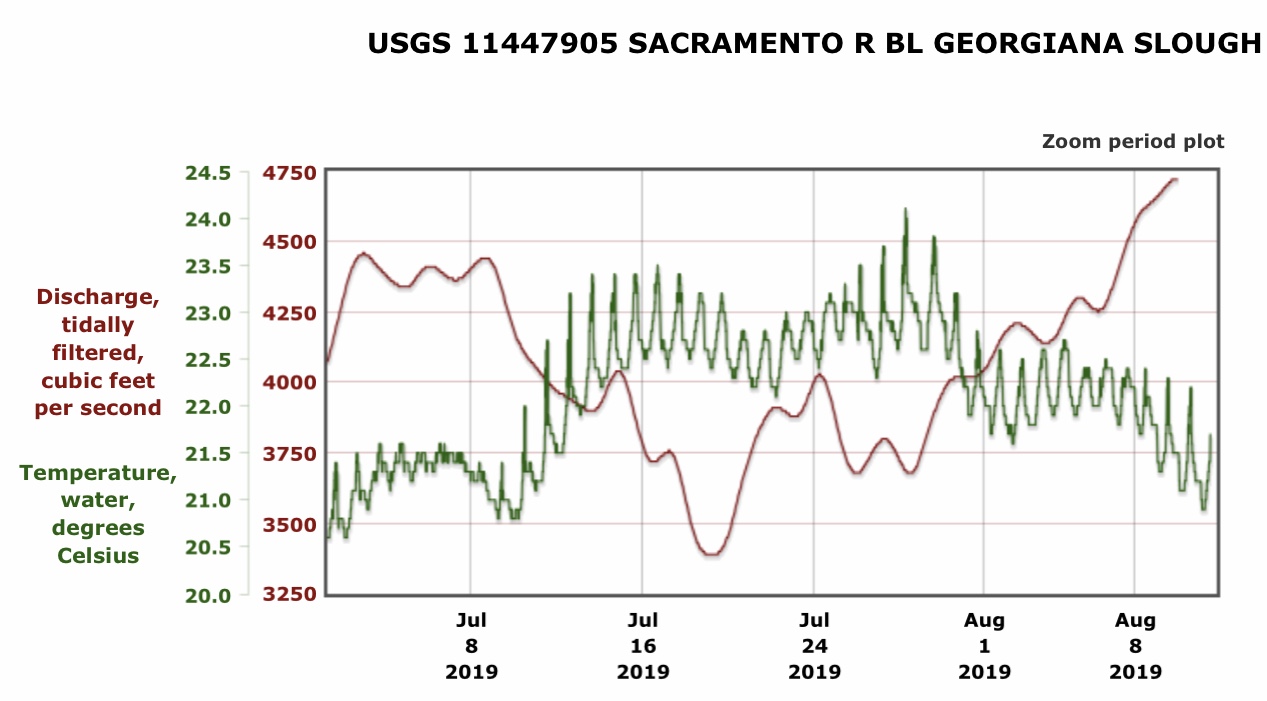
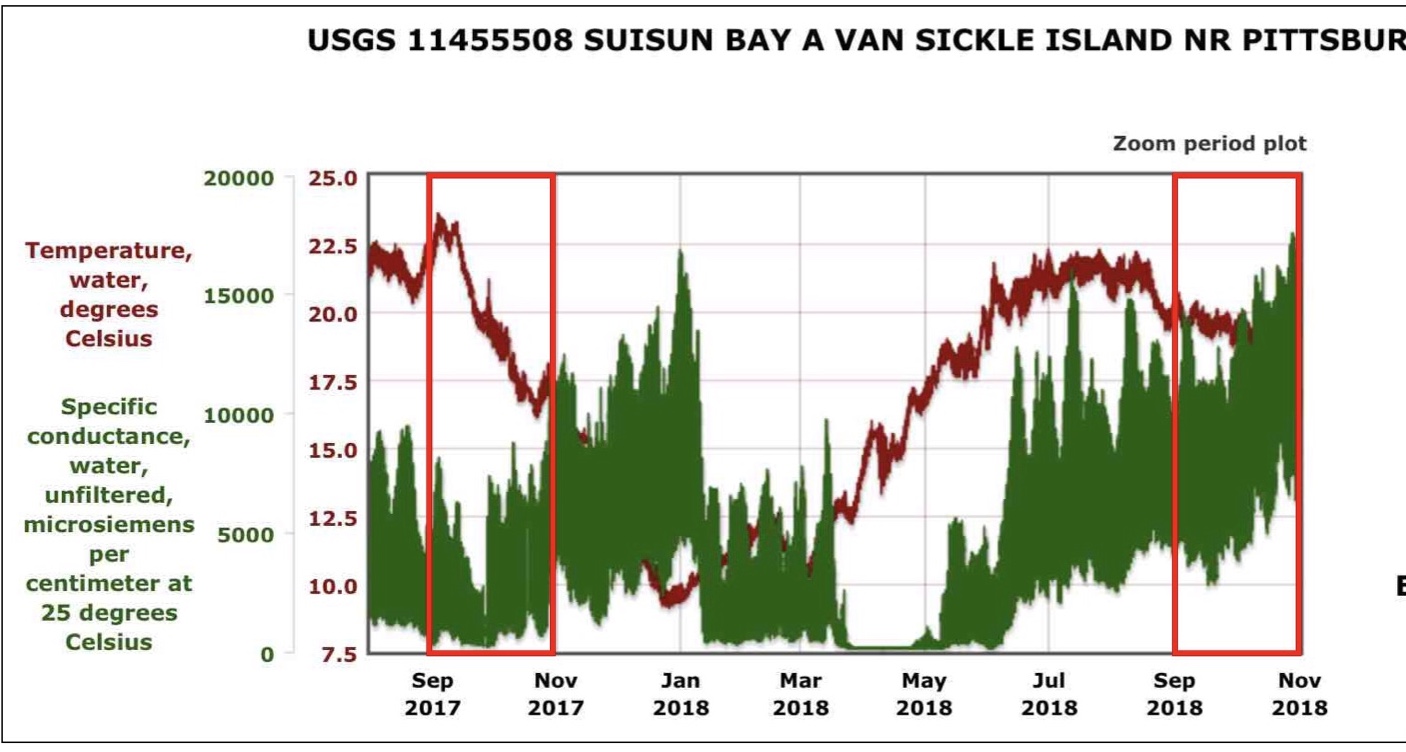
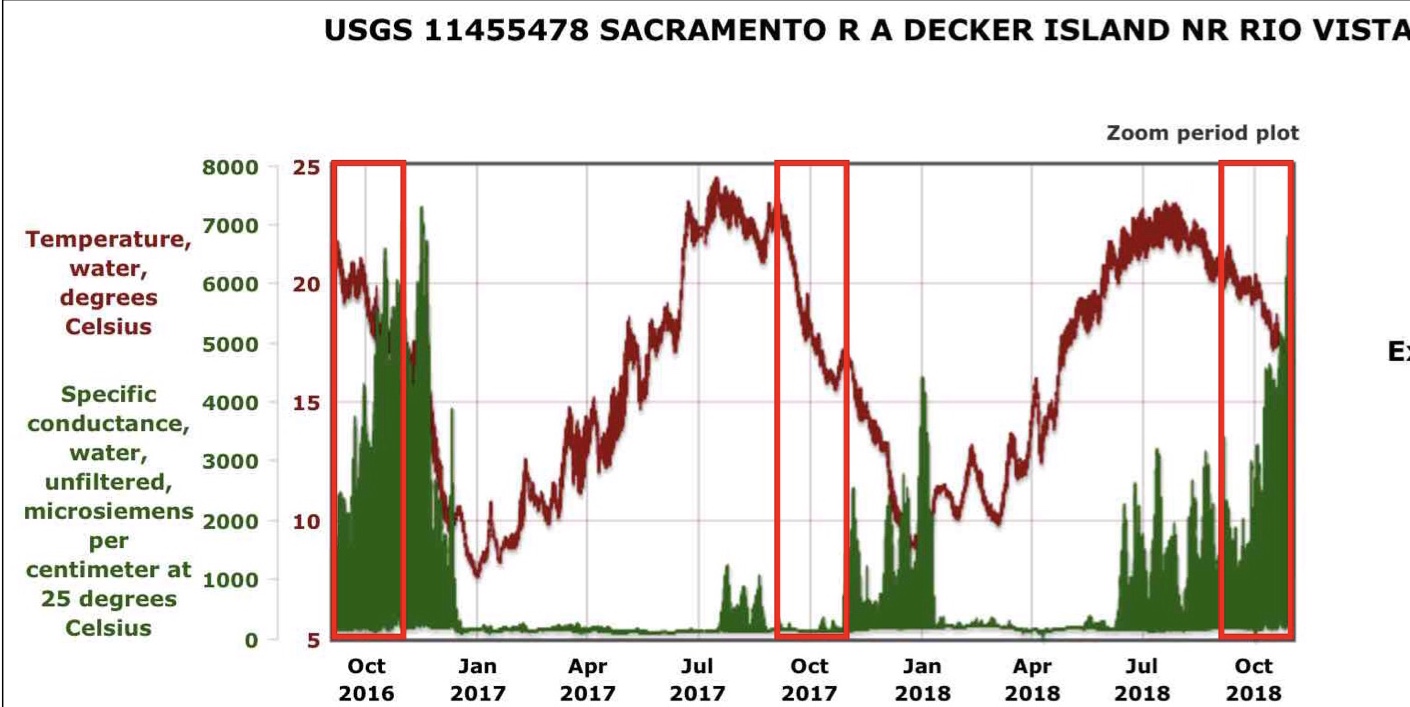
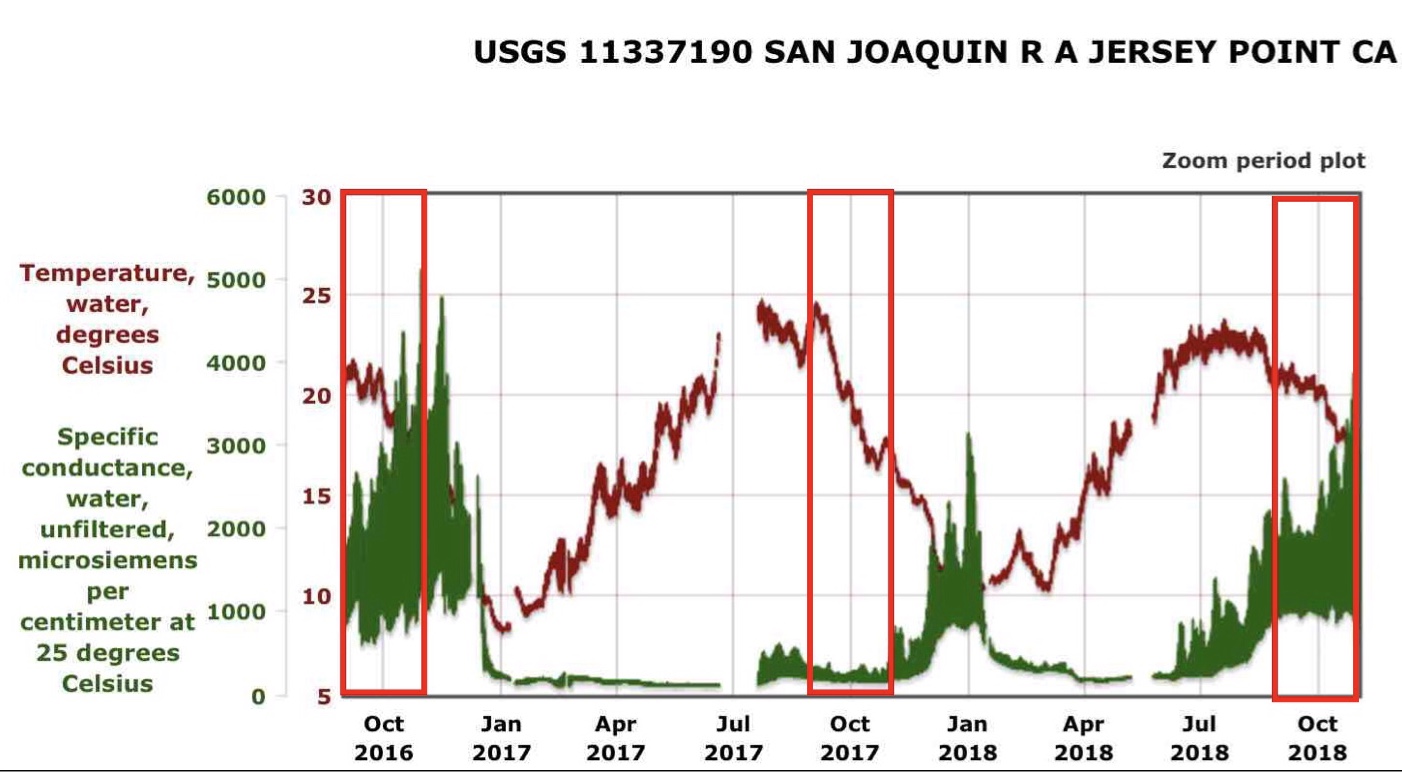
Fall 2017 water temperatures were slightly higher in the west Delta at Jersey Point compared to 2011 (Figure 3). However, fall 2017 water temperatures were not unusually high compared to fall 2011 for Freeport or for Rio Vista in the Sacramento River channel of the Delta (Figure 4). June and July Sacramento River water temperatures were substantially higher in 2017 than in 2011, because June and July Sacramento River flows were much lower in 2017 compared to 2011 (Figure 5).
In general, spring habitat conditions were poorer in 2017 than in 2011: 2017 had lower spring Delta outflows (Figure 6) and much higher south Delta exports (Figure 7).
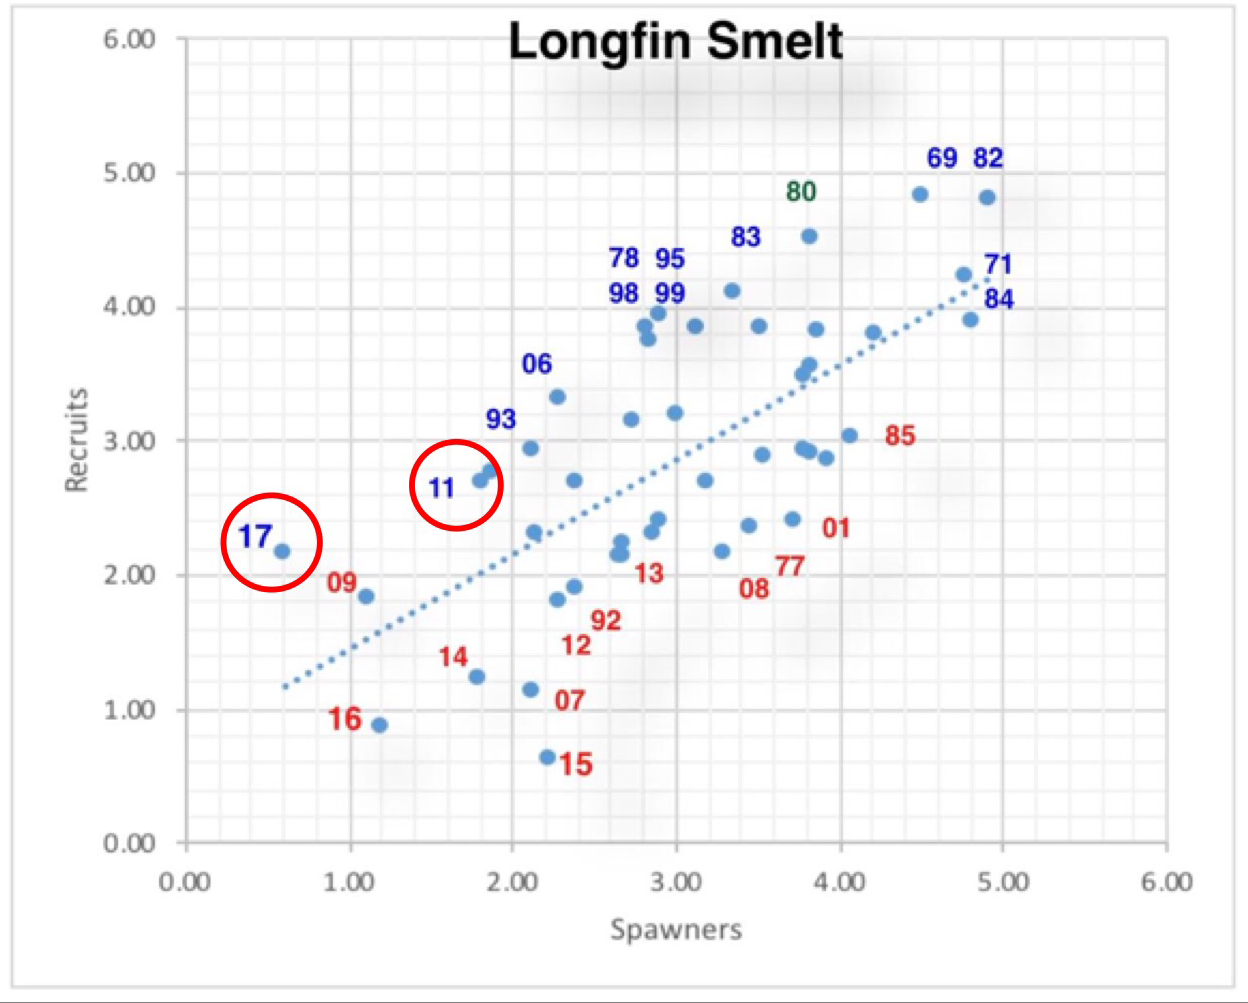
In sum, the 2017 fall index for Delta smelt was unusually poor because of poor conditions for Delta smelt in the spring and summer. However, the response of longfin smelt to the implementation of Fall X2 in 2017 had a better outcome (Figure 8). Despite poor number of spawners, the 2017 recruitment of longfin smelt per spawner was high.
These data undermine Reclamation’s conclusion that the 2017 Fall X2 action had no benefit.
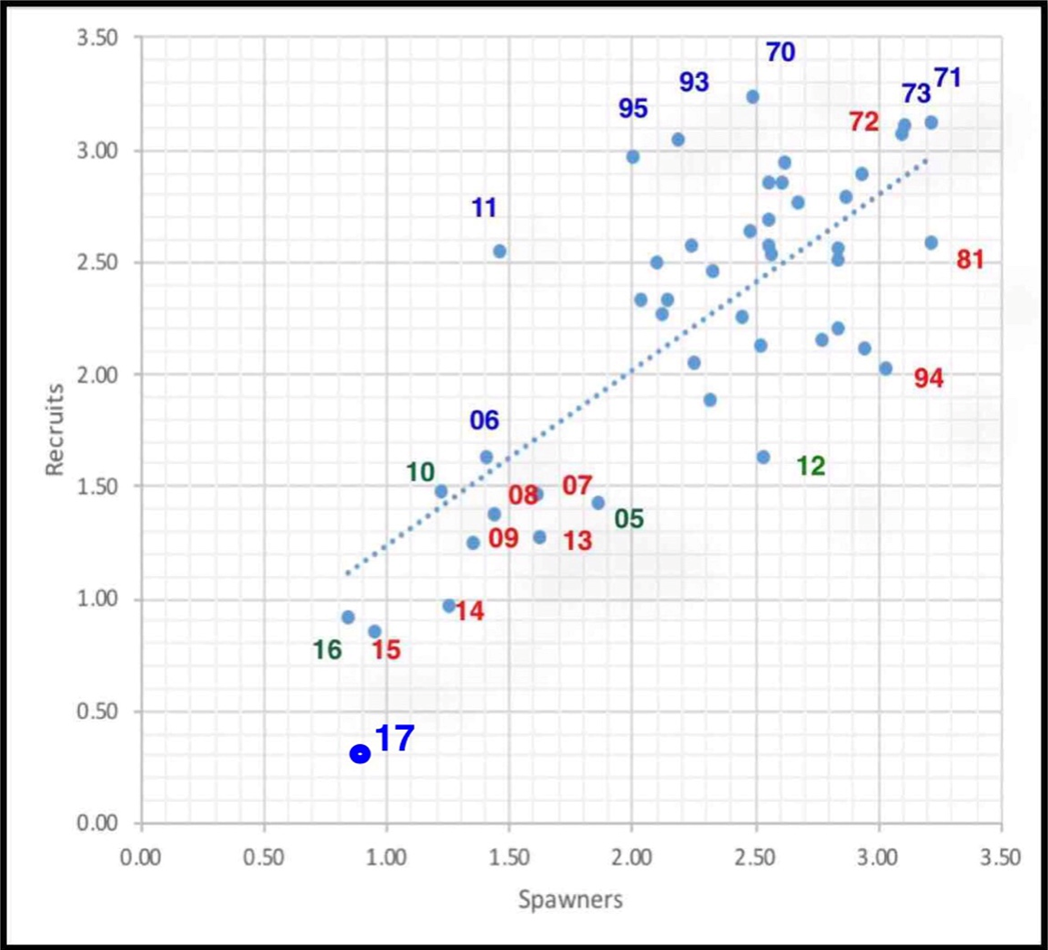
Figure 2. Log vs Log plot of fall FMWT Index of Delta smelt (recruits) vs previous fall index (spawners). Blue years are wet years. Red years are dry and critical water years. Year types are determined by the California Department of Water Resources for the Sacramento River runoff to the Bay-Delta Estuary (http://cdec.water.ca.gov/cgi-progs/iodir/WSIHIST).
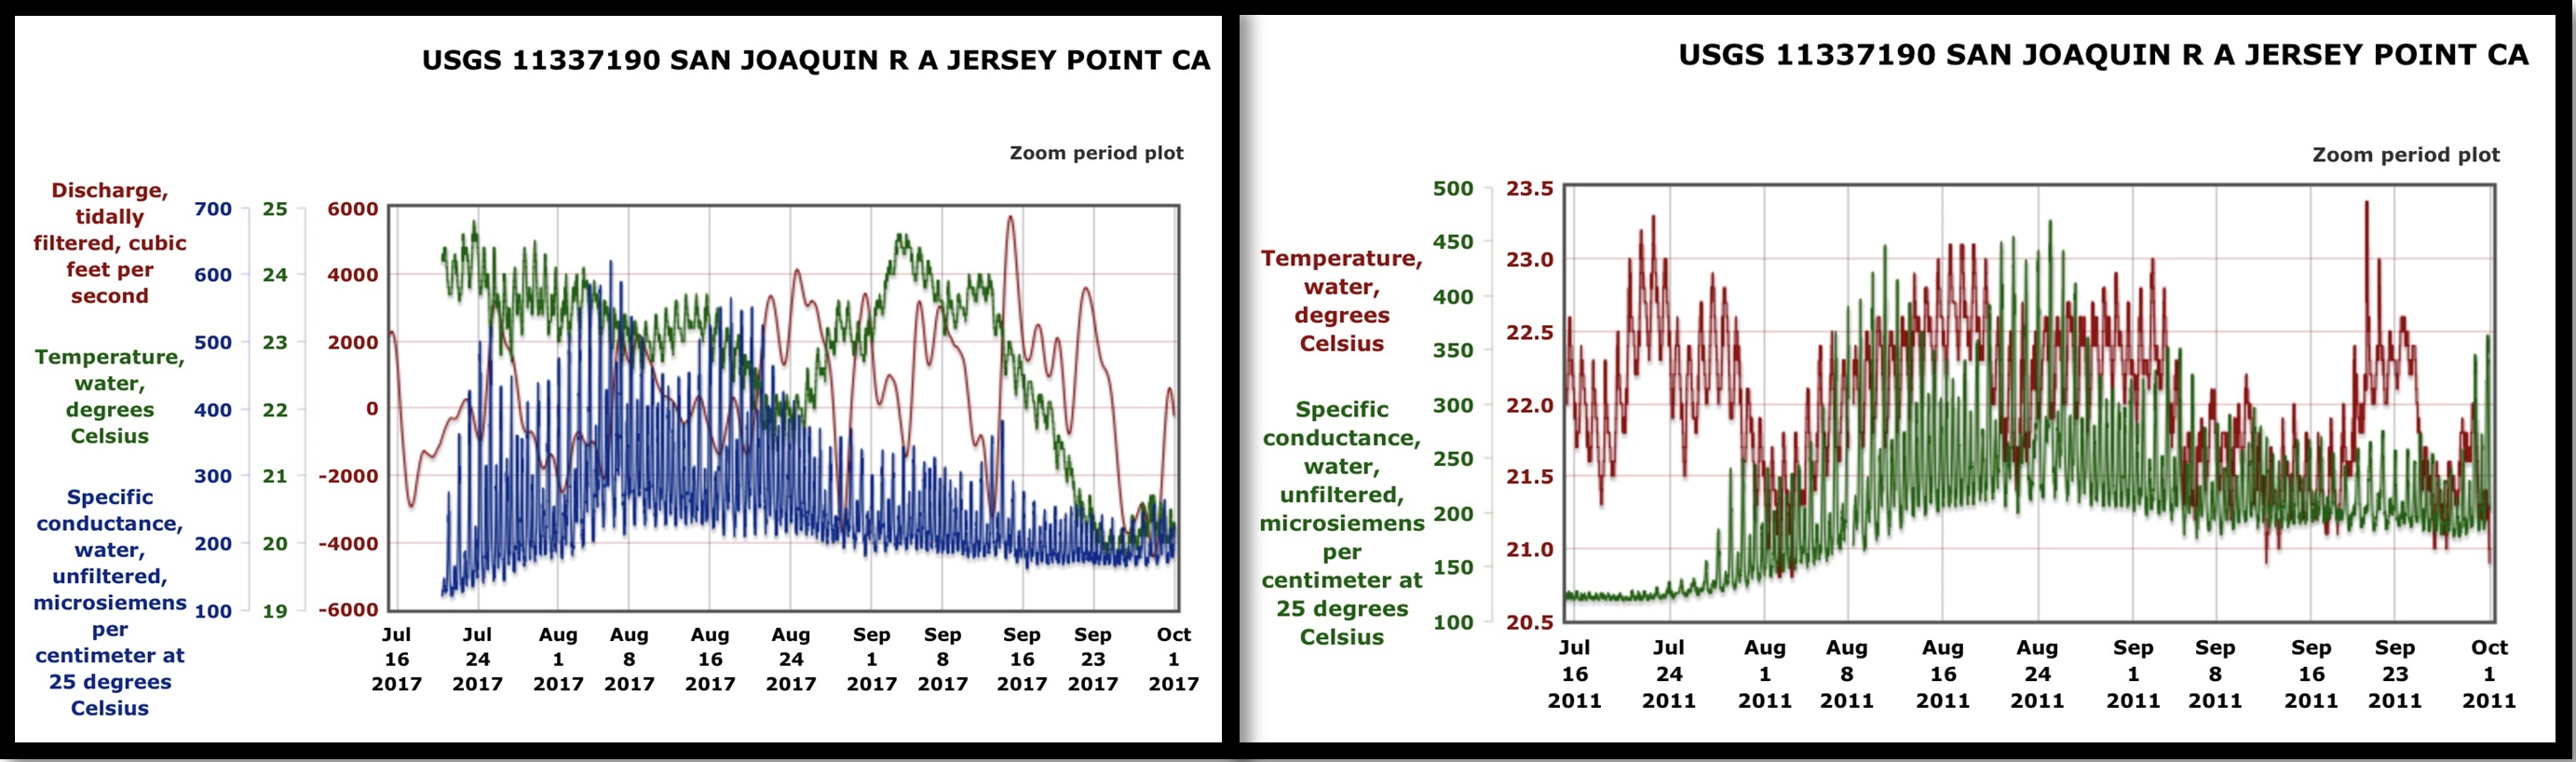
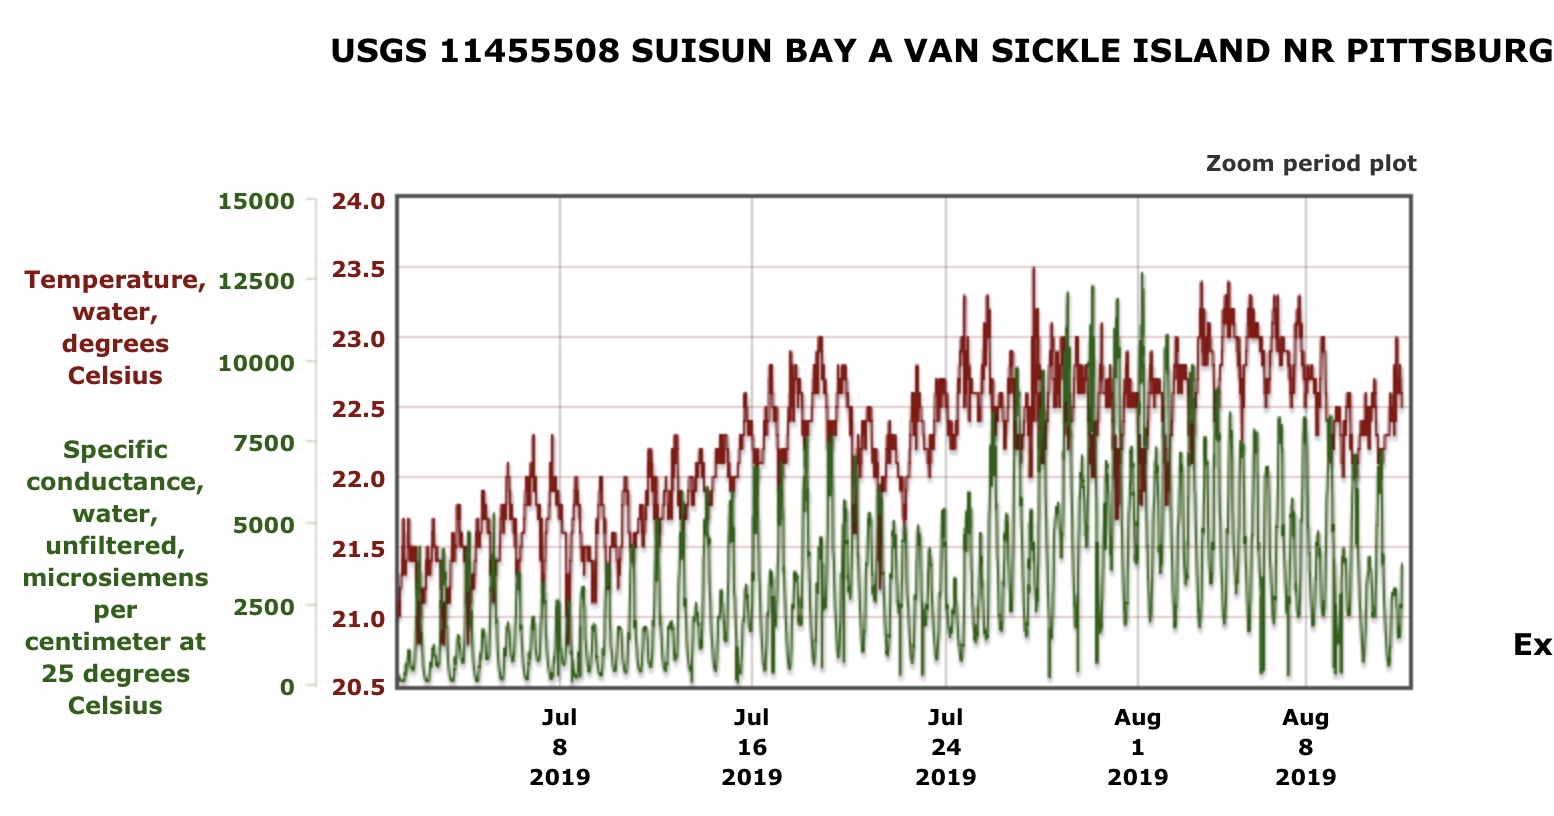
Figure 3. Comparison of Jersey Pt habitat conditions in 2017 versus 2011. Tidally filtered flow data were not available for 2011.
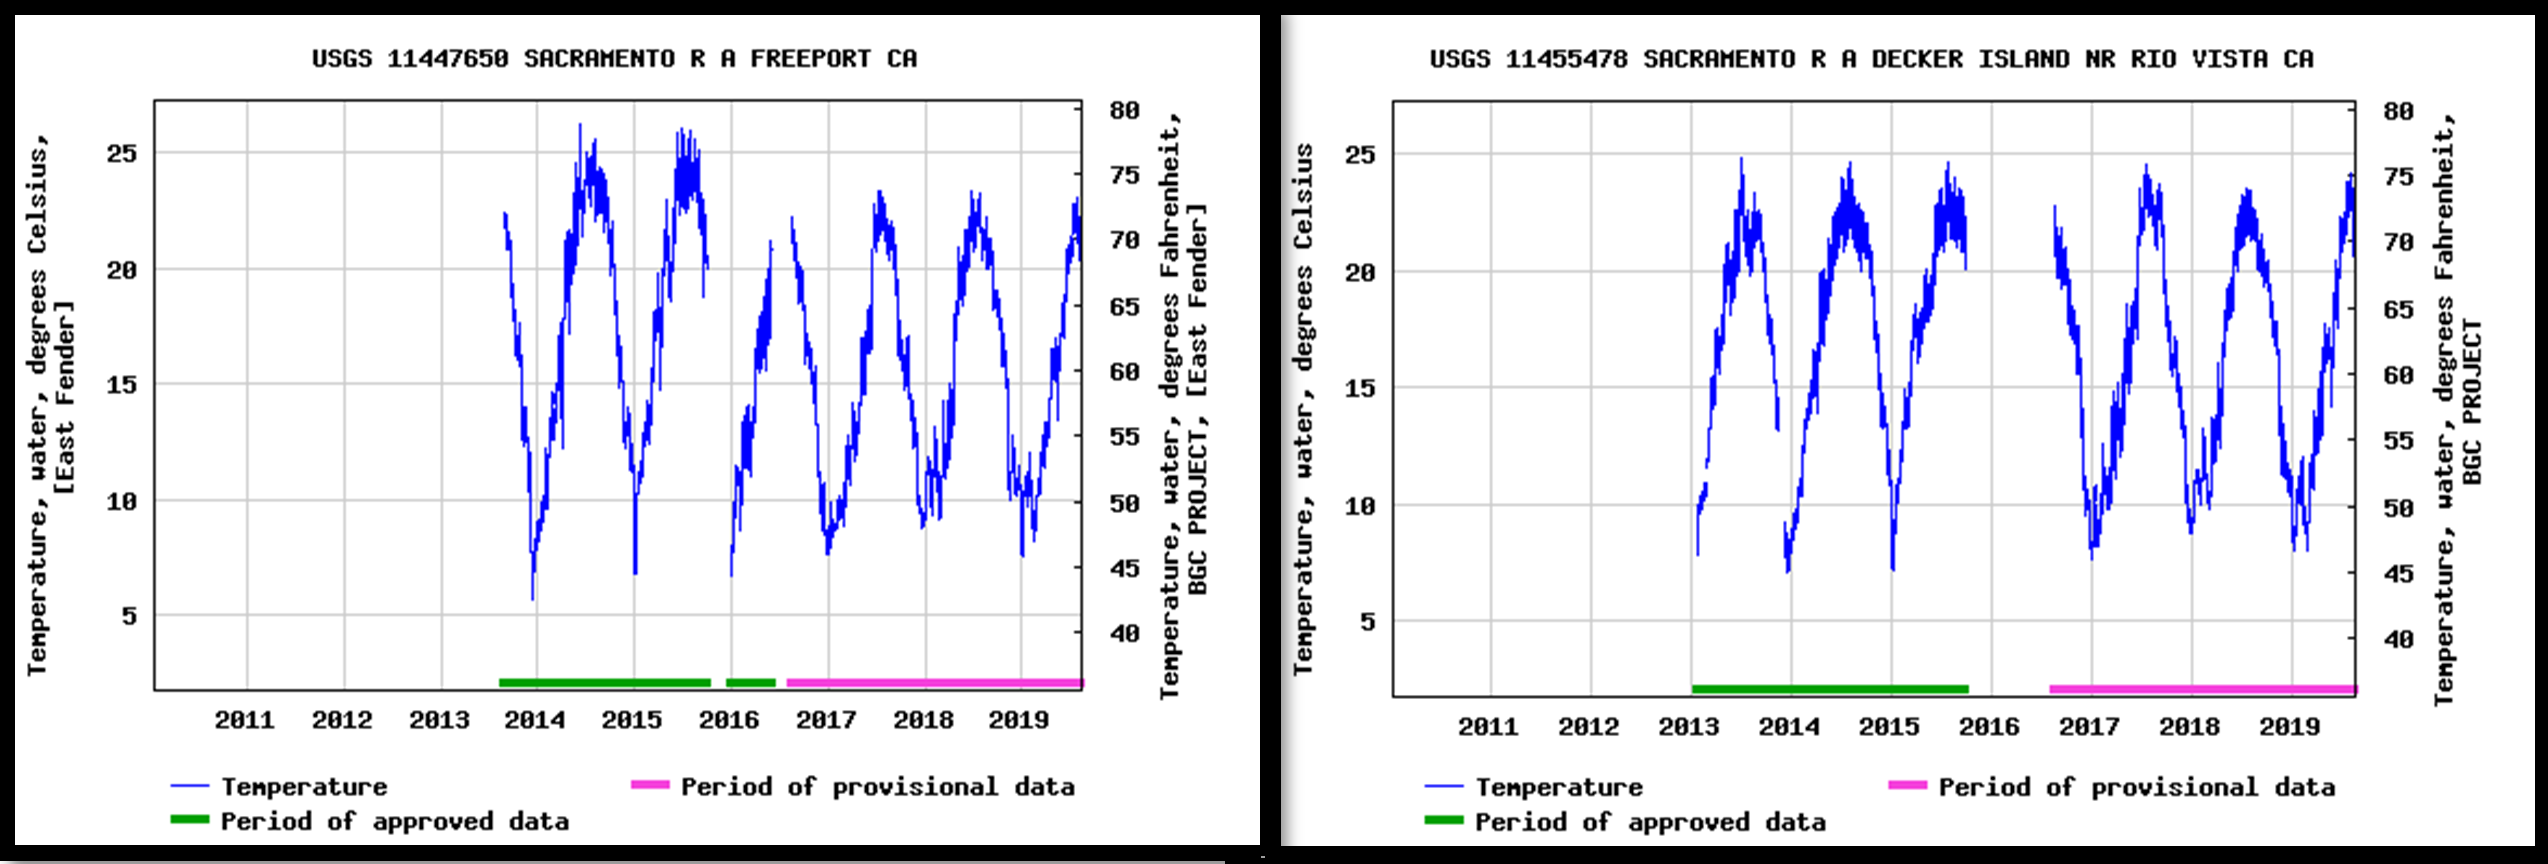
Figure 4. Freeport and Rio Vista water temperatures 2013-2019.
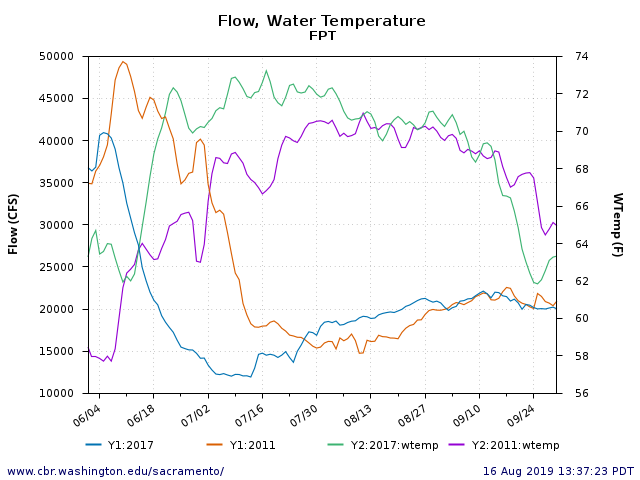
Figure 5. Freeport flow and water temperature summer 2011 and 2017.
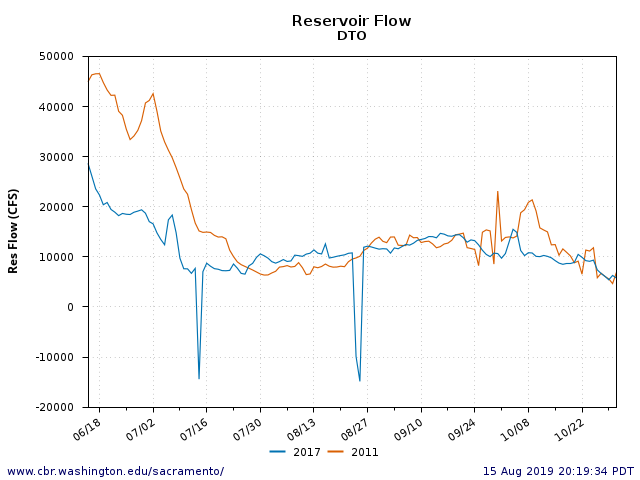
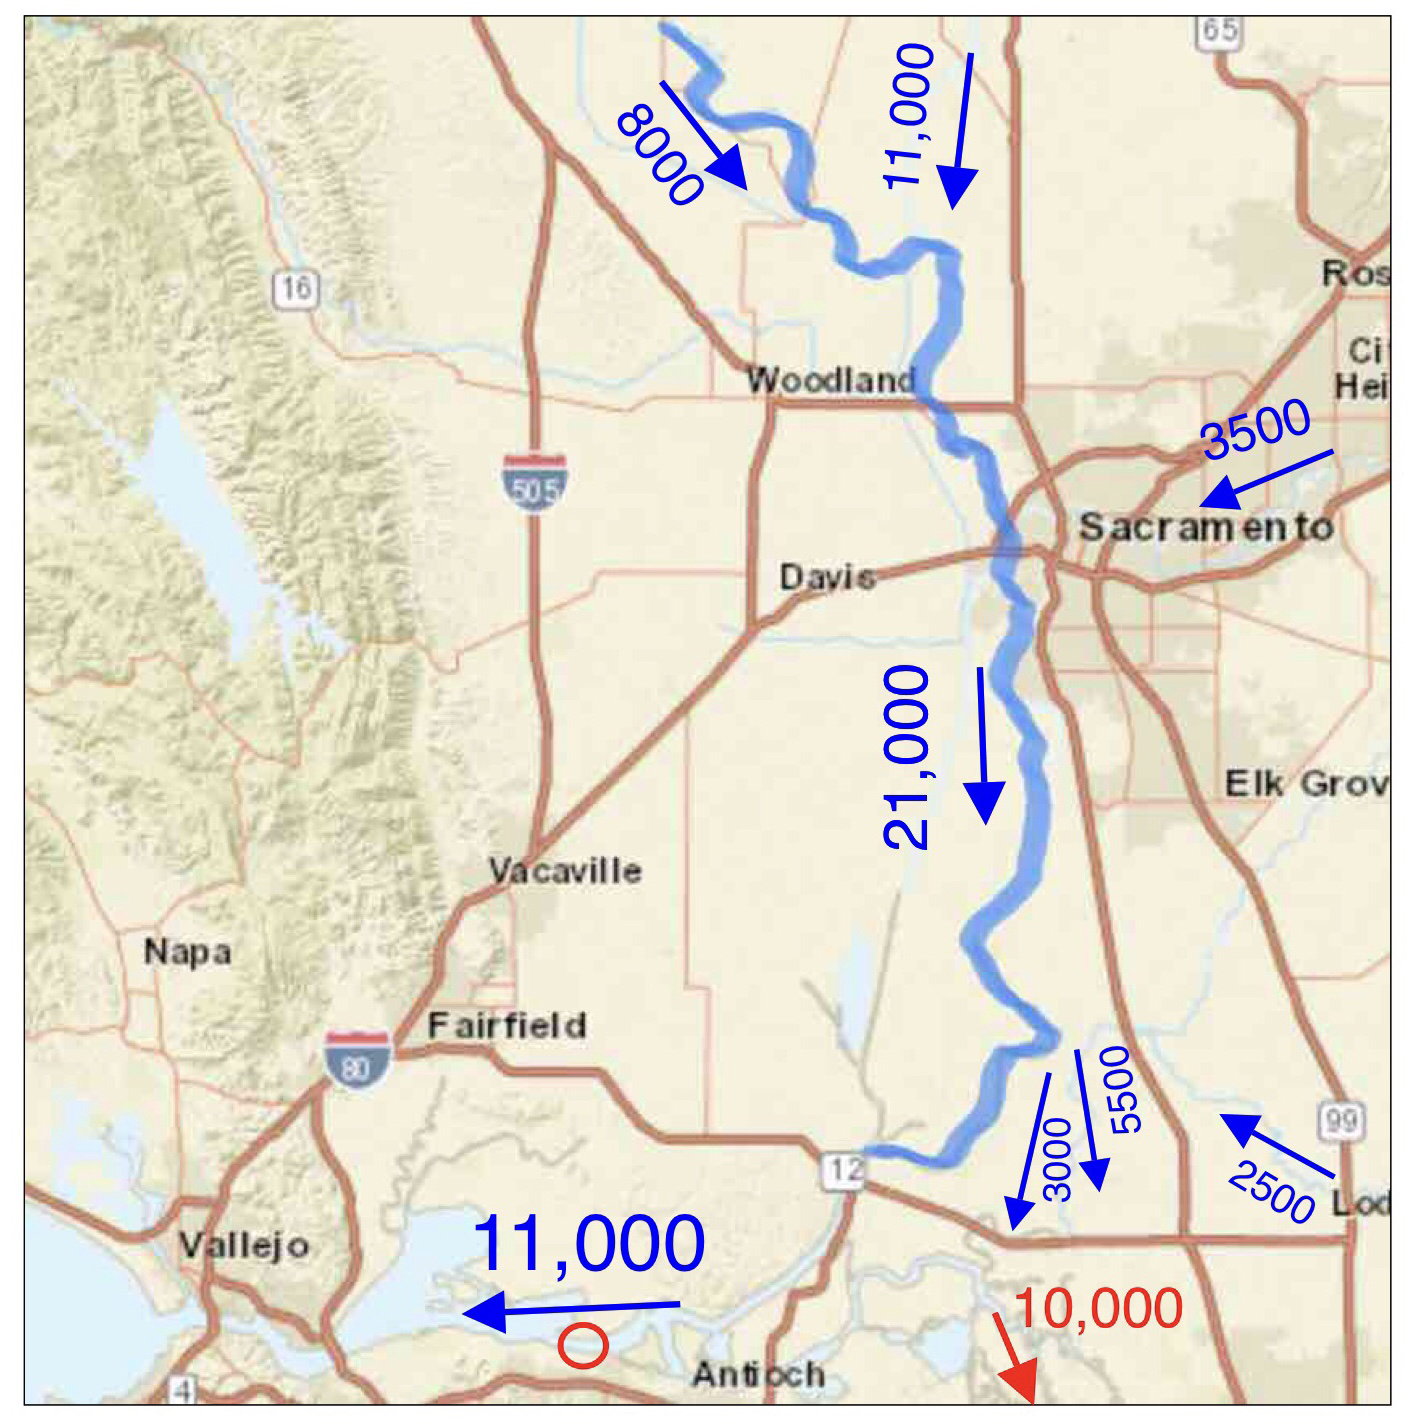
Figure 6. Summer Delta outflows in 2011 and 2017.

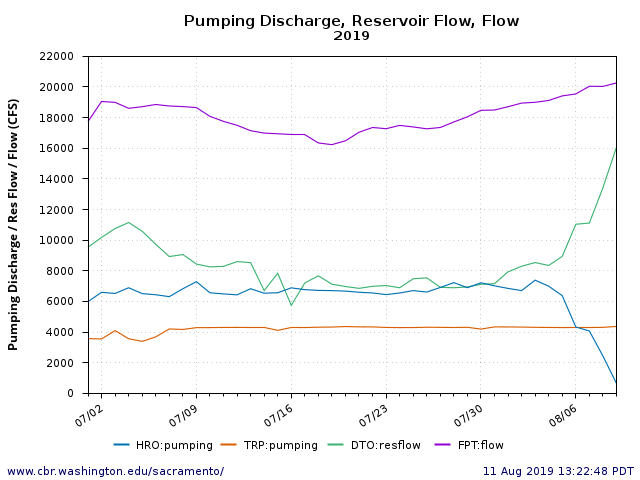
Figure 7. South Delta federal exports (TRP) and state exports (HRO) in 2011 and 2017.
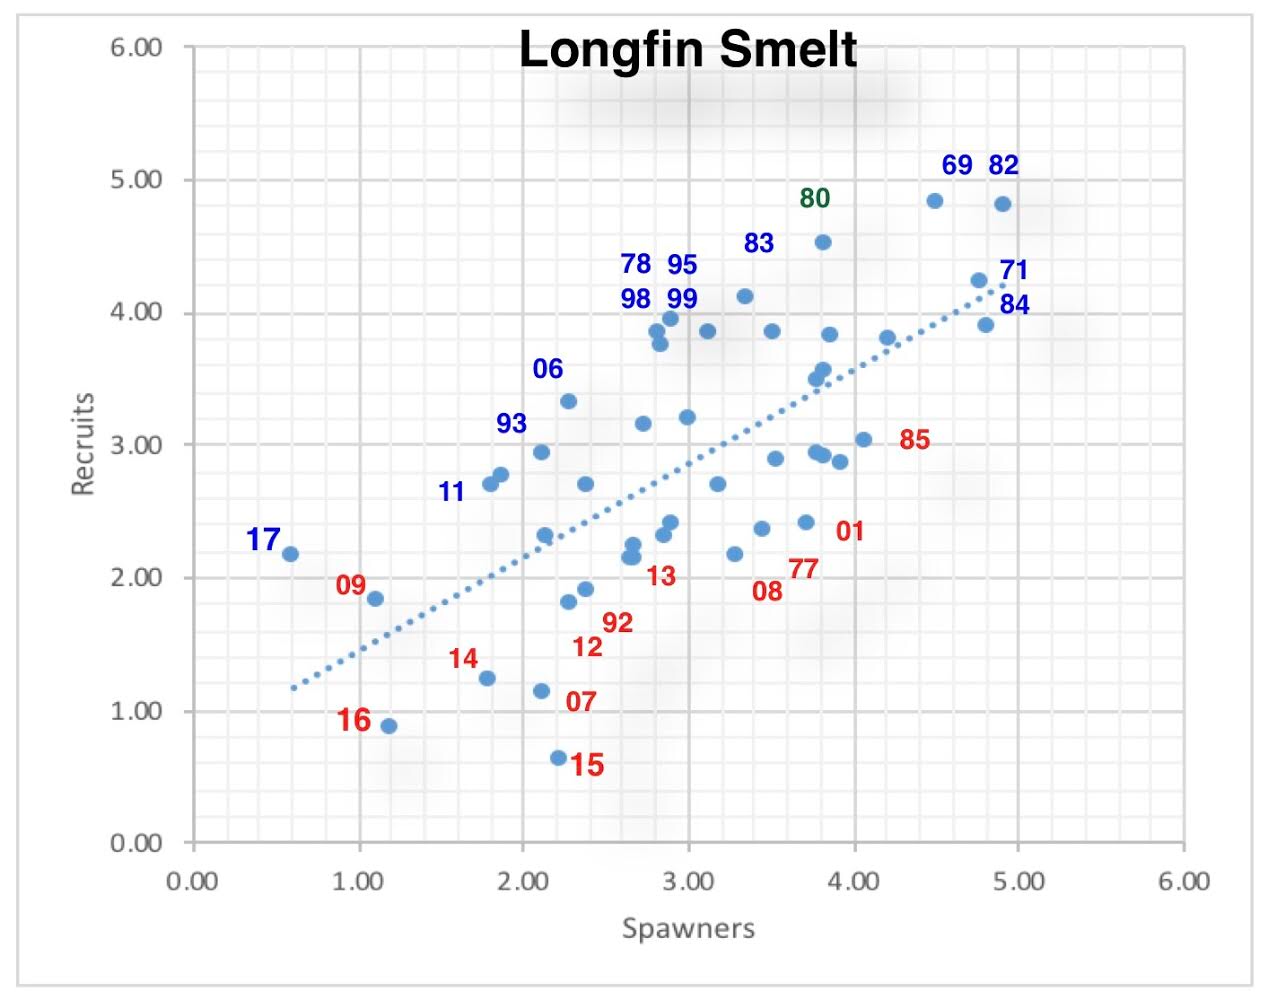
Figure 8. Longfin smelt spawner-recruit relationship, with improved recruitment in 2011 and 2017. Wet year blue, dry year red. Source: http://calsport.org/fisheriesblog/?p=2513
So, after stating inaccurate and misleading reasons why the Fall X2 action is not effective, the Effects Analysis offers inaccurate and misleading reasons why not implementing Fall X2 and instead fussing with the Suisun Marsh Salinity Control Gates (SMSCG) will be a positive switch.
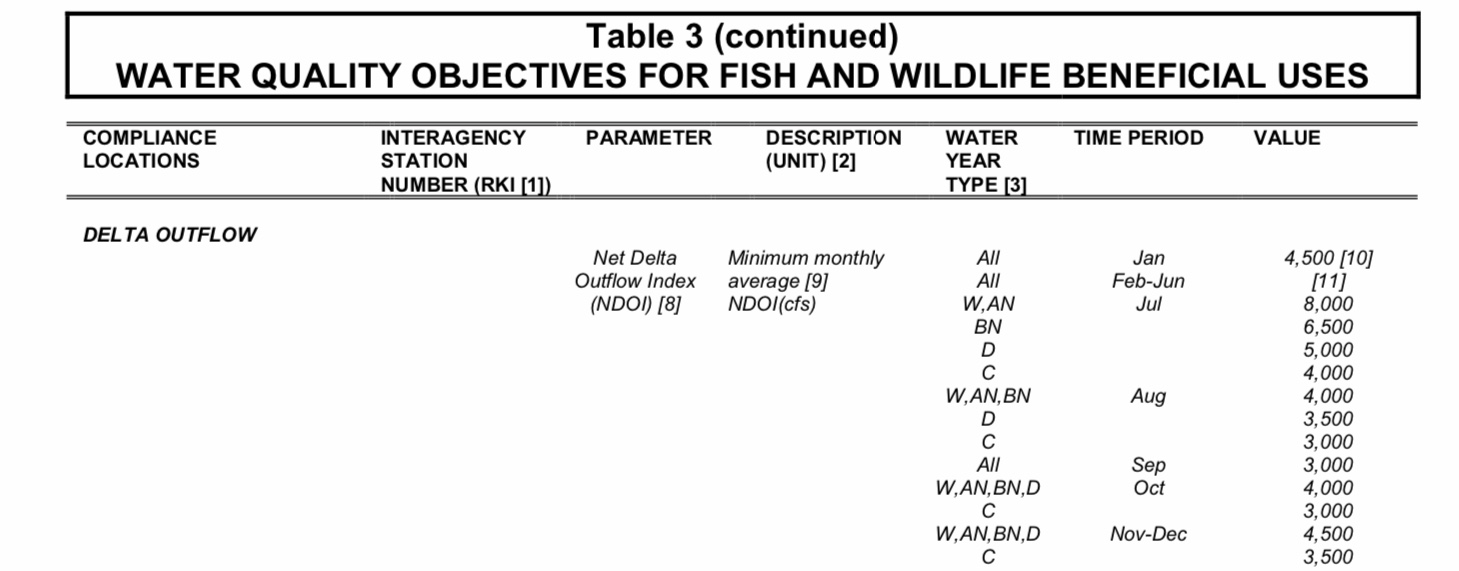
“Forecast of salinity conditions in the Delta indicate that operating to an X2 of 80 km along with SMSCG operations in September and October would result in suitable salinity conditions (< 11,000 uS/cm) in the western Delta including Suisun Marsh, Grizzly Bay, and Honker Bay during these two months.” (p. 17)
Comment: Operating the SMSCG tide gates, while not implementing Fall X2, will push more Delta outflow into Suisun Marsh, with less outflow reaching eastern Suisun Bay. Both actions would potentially negatively affect Delta smelt compared to implementing the Fall X2 Action per the existing BiOp.
“However, as explained above, this estimate of abiotic habitat index does not account for the habitat created in Suisun Marsh through the operation of the SMSGC, which would increase the index.” (p. 31)
Comment: moving outflow through SMSGC reduces habitat in eastern Suisun Bay, and subsequently traps any Delta smelt in Suisun Marsh once the gates are again closed.
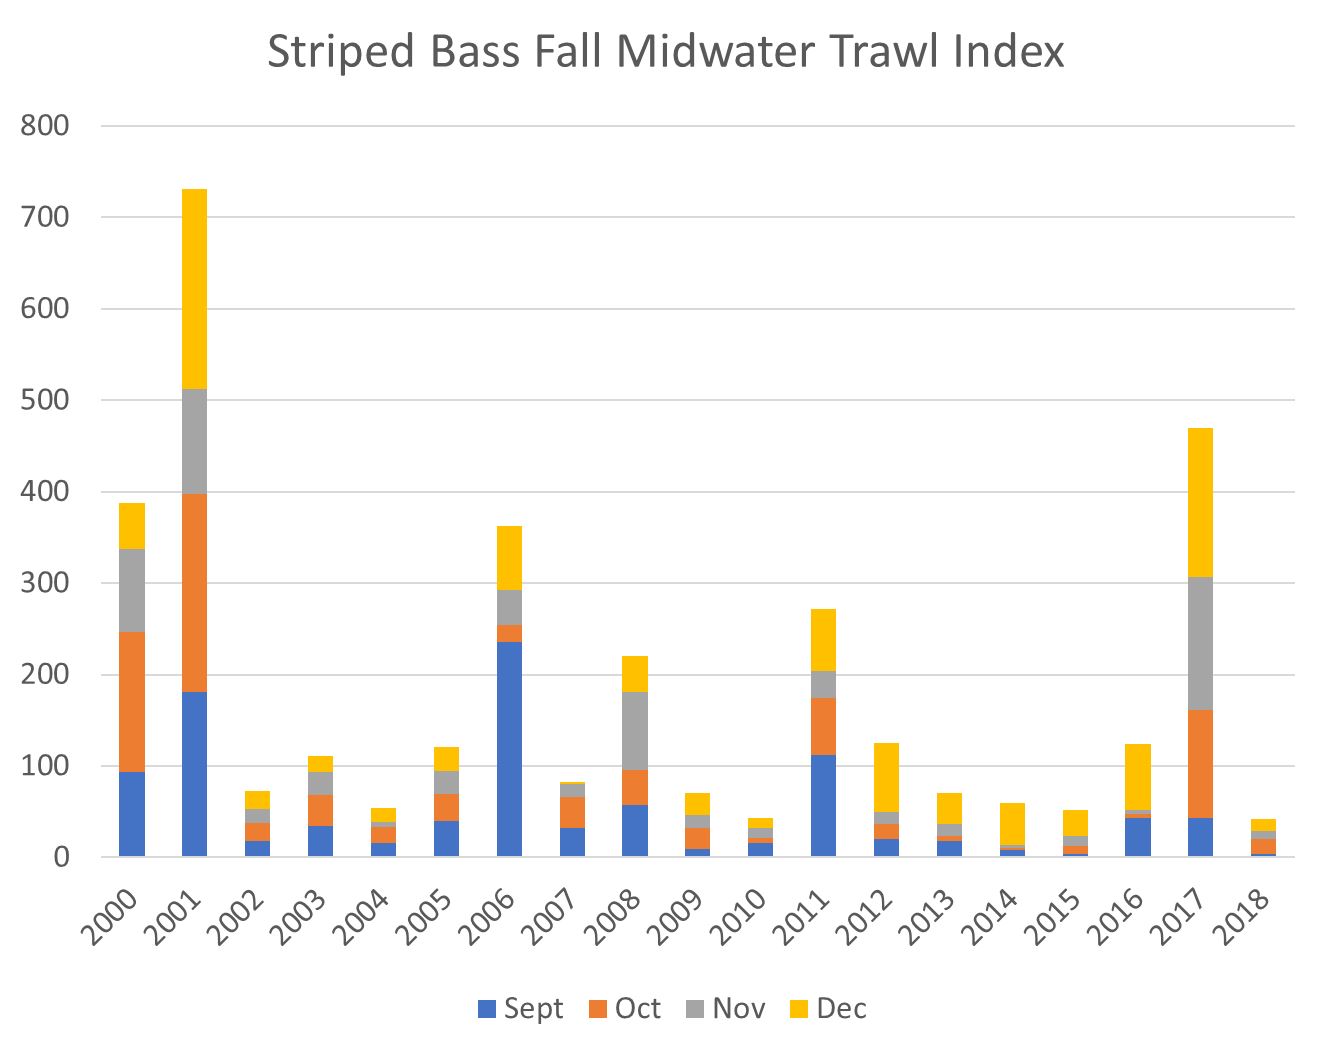
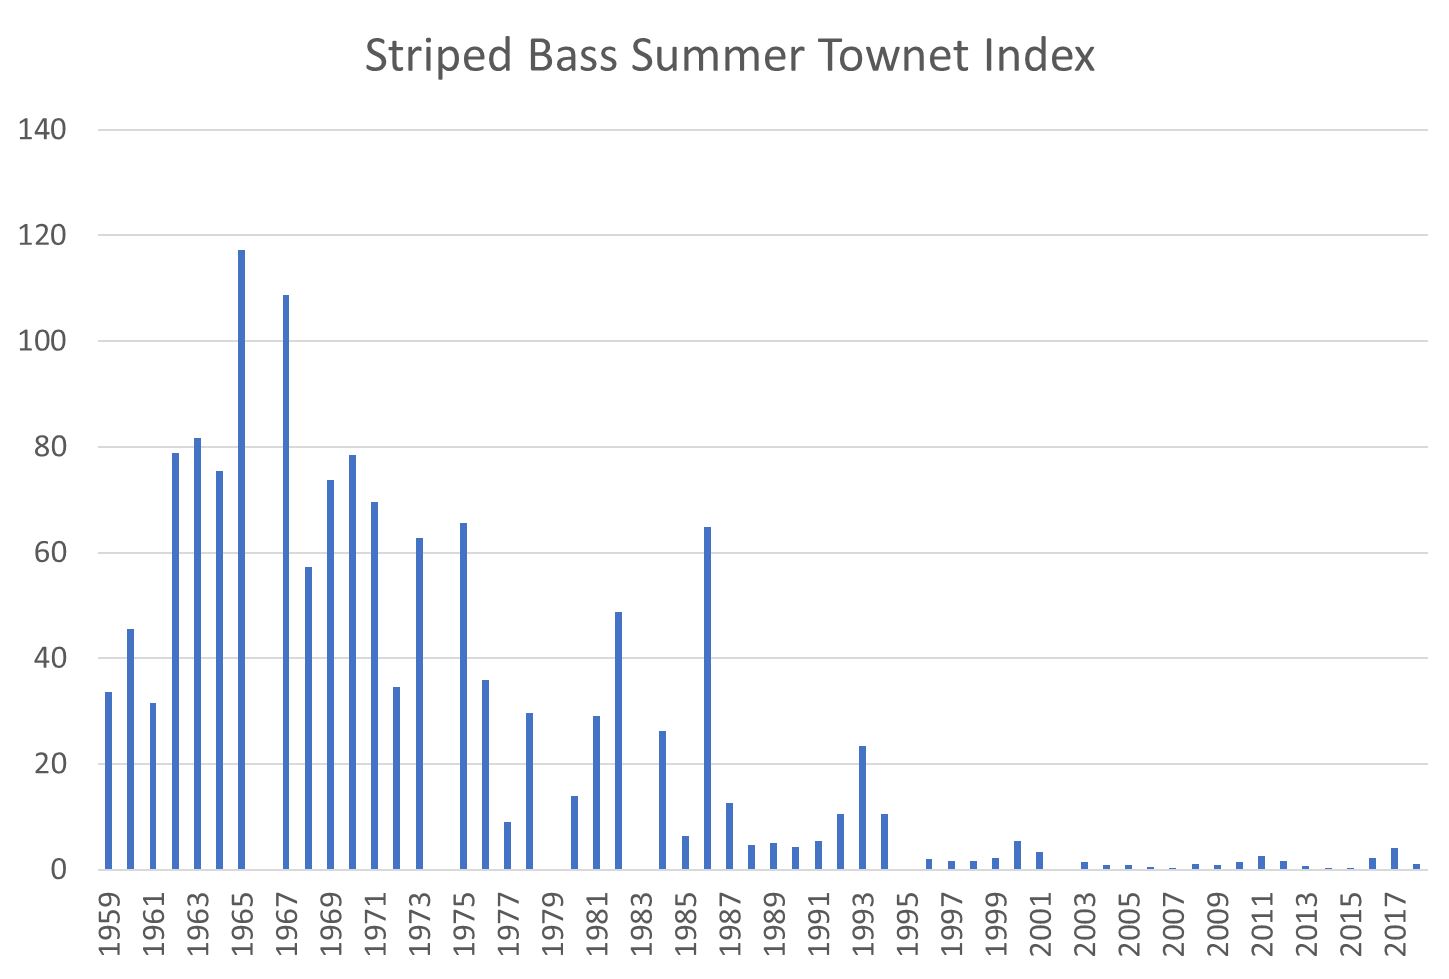
Conclusion: Stock-recruitment models show a strong positive population response for Delta smelt in 2011 (see Figure 2) and longfin smelt in 2017 (see Figure 8). The strong population responses in 2011 and 2017 offer a strong case for implementing the Fall X2 action in 2019. Reclamation’s only justification for eliminating the Fall X2 action in 2019 is to increase water available for export. Biology has nothing to do with it.
![Figure 3. Striped bass Fall Midwater Trawl Survey Index (log10[index+1]) versus prior Summer Townet Index (log10). Select years labeled, with color of number showing year type: blue=wet, green=normal, and red=critically dry.](http://calsport.org/fisheriesblog/wp-content/uploads/2019/08/image1-1.png)