The Interagency Ecological Program (IEP) for the Bay-Delta is about to hold its annual workshop on their science program and their plans for 20161. Science is based on hypotheses and hypothesis testing – or in other words, addressing questions. Here are some questions that would be appropriate for the Bay-Delta Science team to address, if it is not already addressing them:
- Montezuma Slough is the critical waterway connecting Suisun Marsh with Suisun Bay. It begins near the confluence of the Delta outlets of the Sacramento River and San Joaquin River near Collinsville. It ends at its outlet in west Suisun Bay near the Mothball Fleet. It is about 16 miles long, with strong tidal flows and salinity gradients. The salinity control structure (gates) installed in 1988 at the upper end opens on an ebb tide to let freshwater from the Sacramento River downstream into the Slough and Suisun Marsh, and closes on the flood tide to keep saltier water from entering at the bottom to replace the fresher water. The Slough has always been an important nursery for Bay-Delta fish including longfin and Delta smelt, as well as striped bass. In wet years it is fresh much of the year, while in drier years it is brackish. Questions: How has the Slough’s role changed as a nursery area, especially in spring and summer, with changes in the Bay-Delta water quality standards after 1994, with operation off the Salinity Control Structure, with implementation of biological opinions in 2008-09, and with changes related to the Temporary Urgency Change Petitions during the 2012-2015 drought? Have changes in and to the Slough contributed to the possible extinction of the smelts and reductions in estuary productivity?
- Cache Slough is a backwater tributary of the lower Sacramento River channel in the northern Delta. It is the outlet of the Yolo Bypass and the outlet entrance of the Deep Water Ship Channel and Port of Sacramento. It changed permanently with the breaching of adjacent Liberty Island in the late 90’s. In the past, it received freshwater inflow from the Port, but the Ship Channel gates were closed permanently several decades ago. The North Bay Aqueduct diverts freshwater from the west end of the slough complex. The Cache Slough Complex plays an important role in the north Delta ecosystem with its freshwater inputs, shallow water habitats, and large tidal exchange. In wet years, it receives large flood flows of the Yolo Bypass of the Sacramento River. It is an important spawning and nursery area of both smelts and splittail, and is an important nursery of salmon in winter-spring of both dry and wet years. Many very deep holes in the complex are known habitat areas of adult and juvenile sturgeon. The deep water of the Ship Channel appears to support a significant portion of the Delta smelt population. The Complex has more productivity and food than the adjacent Sacramento River channel. The Complex is thought to contribute significant nutrients and organic carbon sources to the northern Delta. Questions: Are plankton blooms in the Complex a function of shallow tidewaters with long residence times or high nutrients or both? Has the role and ecology of the Complex changed over the past several decades with changes in Liberty Island, operation of the Yolo Bypass, operation of the North Bay Aqueduct and Ship Channel, and changes to Delta standards (including recent TUCP’s)? Would proposed drought year barriers on Miners and Steamboat sloughs cause additional changes to lower Cache Slough? Would added streamflow through the Bypass and Ship Channel provide benefits to the ecology and fisheries dependent on Cache Slough and the northern Delta? Would more flow through the Bypass improve habitat and habitat use by young salmon moving upstream from the lower Sacramento River channel? Is there more smelt spawning in the Complex in drought years because of salt intrusion into western Delta? Can the isolated population element of Delta Smelt in the Complex survive the warm summer conditions? Would the Complex benefit from more tidal marsh and supratidal floodplain? Does the Complex benefit from nutrient inputs of local and regional treatment plants and agricultural drainage? Do water supply diversions by agriculture and the North Bay Aqueduct affect habitat benefits to the Complex and the Delta?
- The Delta Cross Channel (DCC) that connects the lower Sacramento River channel in the north Delta with the San Joaquin River channel in the central Delta via the forks of the Mokelumne River can be opened or closed to control the amount of Sacramento channel water that reaches the central and south Delta. Closing the DCC forces more water and juvenile salmon down Georgiana Slough. Questions: Would opening the DCC in spring benefit smelt and salmon? In particular, would salmon outmigrating from the San Joaquin River benefit? Would Sacramento salmon that pass into central Delta via Georgiana Slough benefit from open DCC?
- The Head of Old River Barrier (HORB) reduces the flow of the San Joaquin River into the head of Old River near Stockton. HORB keeps most juvenile salmon that are moving down the San Joaquin channel out of Old River water that is drawn to South Delta export pumps. However, while HORB keeps San Joaquin salmon moving toward the central Delta, the reduction of San Joaquin flow into the head or Old River increases flow toward the pumps from the central Delta (increasing negative OMR flows up to 1000 cfs). Questions: Would HORB function improve with installation of False River Barrier and opening of the DCC? How would the tradeoff in export potential balance with benefits to San Joaquin salmon?
- The False River Barrier blocks tidal flows from the lower San Joaquin River channel at Jersey Point into Franks Tract in the Central Delta. This reduces flow of brackish water and nursery habitat of smelt into the central and south Delta in dry years. Questions: Would placement of the False River Barrier in spring of wet years provide benefits to smelt and Delta habitats of smelt and reduce entrainment of smelt into the south Delta?
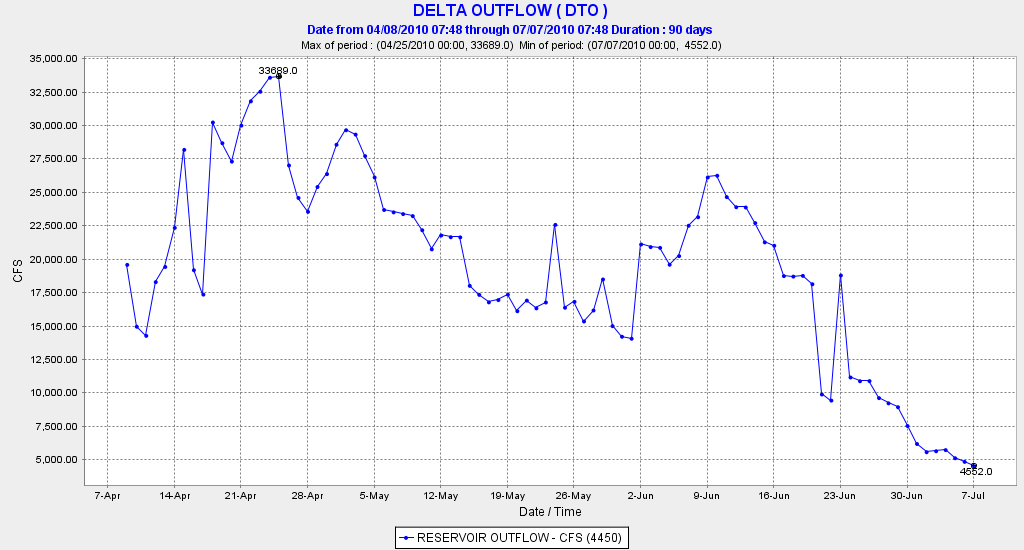
- Summer Delta Outflow and Exports are unrestricted except for salinity standards based on agricultural use. Summer exports from South Delta are generally maximized unless they are restricted by high salinities in drought years (low reservoir releases during droughts). Questions: Would higher summer outflows that keep the LSZ west of the Delta during periods of high export protect smelt and LSZ habitat? Should summer salinity standards be changed to protect LSZ from moving east into the central Delta? Would higher Delta outflow in summer be beneficial to Bay nursery of many estuary and marine fish including herring and anchovy? Would higher summer outflow improve productivity of the LSZ?
- Conditions for salmon rearing in the Delta during the Winter can likely be improved. Nearly all the salmon runs in the Central Valley spend part of their first year rearing in the Delta in the winter and migrating through the Delta to the Bay and ocean. Winter Run and Late Fall Run hatchery and wild smolts come through in December-January with the first flow pulses from the upper Sacramento River. Spring and Fall Run fry, parr, and smolts come through from January to March or even into April. The fry and parr depend on the Delta and upper Bay, rearing there during the winter before smolting. Questions: How can migration period flows be optimized to improve survival? Can optimal rearing habitats be identified and improved? How can Delta inflows from the San Joaquin River be improved during winter to enhance San Joaquin salmon survival?
- Delta Water quality standards are monthly, biweekly, or weekly. Questions: What are the upsides and downsides of moving to more frequent real-time management of Delta water quality standards, as well as management of fish and fish habitat? Have existing requirements to change operations “when fish are present” been effective? What are the ecosystem effects of shortening the time-step for management decisions and relying on short term response for changes in operations? What structural measures would allow managing agencies to better maintain their independence from conflicting pressures?
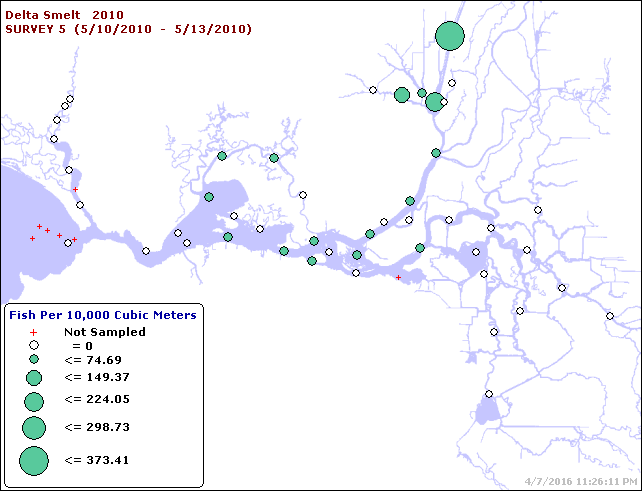
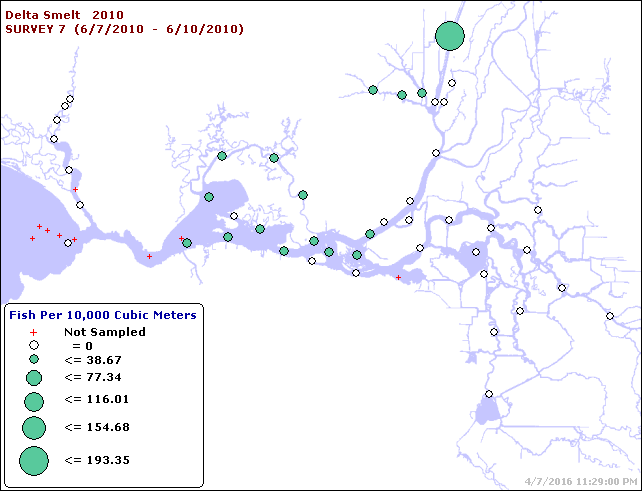
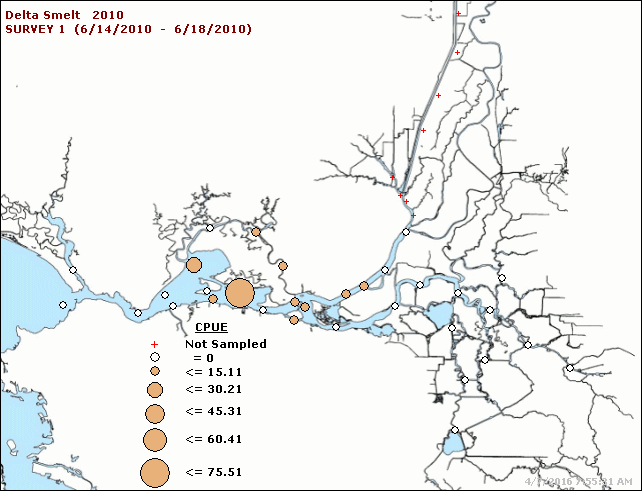
- Smelt growth and survival could be enhanced by improving pelagic habitats within and downstream of spawning areas. Water temperature, turbidity, and zooplankton production/biomass/concentrations are key factors in growth and survival. Question: Can Bay-Delta habitats be managed on a real-time basis to optimize smelt growth and survival?
- Green and White Sturgeon spawning as well as egg, larvae, and juvenile survival are dependent on flows and water temperatures in the Sacramento River between Red Bluff and the Delta. Question: How can the middle reaches of the Sacramento River be better managed to improve sturgeon survival?
- Cache Slough/Yolo Bypass salmon and sturgeon adult migrations are attracted by strong tidal exchange, but those attracted may stray into Bypass tributaries (Putah and Cache Creeks) or the Colusa Basin Drain, or become stranded below Fremont Weir at the northern end of the Bypass. Young salmon enter the Bypass during Fremont Weir spills under high river flows. Questions: How can migration conditions be enhanced without increased straying and stranding in the Bypass? How can the Bypass become a beneficial corridor for adult sturgeon and salmonids targeting upper Sacramento River spawning grounds? How can more flow and young salmon be routed through the Bypass to improve growth and survival of the overall populations?
- San Joaquin salmon and steelhead migrations through Delta are disrupted by the nearly total loss of San Joaquin River water to exports in drier years. Questions: Does placement of the Head of Old River Barrier enhance the signature of the River reaching the Bay? Would enhanced San Joaquin River flow and reduced exports at key times of the year benefit migrating San Joaquin River salmon and steelhead?
- Delta primary and secondary productivity has declined over the past several decades. Questions: Do exports remove nutrients, planktonic habitat, or adversely disrupt the Low Salinity Zone by entraining pelagic habitat from the west and central Delta via Dutch Slough, Threemile Slough, False River, and the mouth of Old River? Is the replacement of an entrained LSZ and freshwater pelagic habitat by unproductive, warmer reservoir water detrimental to Delta pelagic habitat productivity? Has the invasion of rooted and floating aquatic plants reduced pelagic habitat productivity? Is the invasion of non-native plants related to shorter residence time and continued replacement of entrained pelagic habitat and replacement of reservoir water? Has the invasion of aquatic plants been aided by reduced phytoplankton productivity and influx of low turbidity reservoir water?
- Dutch Slough and other Central Delta habitat restoration projects would expand intertidal and subtidal habitats. Questions: Would such projects expand habitats of non-native fish and aquatic plants? Would the new pelagic habitats be subject to entrainment by south Delta exports?
- Survival of salmon and steelhead juveniles in the Delta and lower rivers upstream of the Delta is poor because of degraded habitat, poor flows, poor water quality, and predators. Questions: Would barging hatchery and wild salmon to the Bay particularly in drier years when flows are low improve survival and minimize straying? Would out-planting wild and hatchery salmon to more optimal Bay-Delta floodplain rearing habitats improve overall production?