Early Winter in Bay-Delta: Storms, Tides, Exports, Salmon, and Smelt

The beginning of this water year (early winter 2015-2016) may mark the last viable spawning migration of Delta Smelt in the San Francisco Bay-Delta Estuary. Remnants of the Winter Run salmon population below Shasta are also passing downstream through the Delta to the Bay and Pacific Ocean. Two moderate storm periods in the Central Valley so far this winter have driven Bay-Delta hydrology, Low Salinity Zone dynamics, salmon emigration, and the remnant Delta and Longfin smelt spawning runs. Moderate exports (4000-6000 cfs) from the South Delta pumps have also had to their effects, as has the annual winter closure of the Delta Cross Channel. Together these “forces” provide a picture of a key dynamic period of the Bay-Delta Estuary ecosystem as well as to how to better manage the system for the benefit of everyone including the endangered smelt and salmon.

The winter started with drought conditions exemplified by low freshwater inflow and outflow in the Delta, and the Low Salinity Zone sitting far upstream in the Delta. Exports from the South Delta were minimal. Then came two major storm periods of moderate freshwater inflow that changed everything. The first peaked around Christmas and the second on January 9th (Figure 1). With the Delta Cross Channel closed, most of the storm water passes down the Sacramento River channel to the eastern Bay (Figure 2).

Freeport Flow Graph Winter 2016

Figure 1. Sacramento River flow entering Delta in early winter of water-year 2016.

Map of Sacramento River inflow entering Delta during early winter storms

Figure 2. Sacramento River inflow entering Delta during early winter storms is split between Sacramento River channel (20,000 cfs) and Georgiana Slough (5000 cfs). The Central Delta also receives approximately 2,000 cfs net freshwater inflow from Three Mile Slough. San Joaquin River inflow from southeast (not shown) is less than 1000 cfs. South Delta exports reached approximately 6,000 cfs during storms (red arrow).

Salmon Smolts Emigrate through Delta

Salvage of Winter Run sized salmon smolts1 has increased with the storms and higher exports from the two South Delta pumping plants (SWP and CVP) (Figure 3). These salvaged Sacramento River salmon likely enter the Central Delta via Georgiana Slough and then follow net negative flows to the south Delta export pumps (red arrow in Figure 2). These negative flows are monitored as Old-Middle-River or OMR flows (Figure 4).

Graph of Salvage of salmon smolts Early Winter 2016

Figure 3. Salvage of salmon smolts at South Delta SWP and CVP pumping plants in early winter of water-year 2016.

Graph of Net OMR flows early winter 2016

Figure 4. Net Old and Middle River (OMR) flows in Central Delta in early winter of water-year 2016.

Smelt Ride the Tides into Central Delta

Adult Delta and Longfin Smelt enter the Delta from the Bay on their spawning migration during the first winter storm, attracted by the warmer, more turbid, higher storm flows. Being poor swimmers, they ride the flood tides into the Delta, staying nearshore on ebbs and moving out into the upstream currents on flood tides2. Because much of the upstream flood tide current is into the Central Delta (with high freshwater inflow in the Sacramento River channel – Figure 5), many smelt enter the San Joaquin channel, becoming “trapped” in the Central Delta and susceptible to moving with accentuated flood tides3 to the South Delta export pumps.

“Extremely high outflow in wet years can weaken or completely overwhelm the flood tidal signal in the Sacramento River and thus preclude or impair maturation and the reproductive output of spawning individuals (Kinnison et al. 2001; Bronmark et al. 2008). In such years, fish may choose to reproduce in suboptimal habitat or migrate up the San Joaquin River which has lower outflows, but this increases potential mortality by moving fish toward the water export facilities (Grimaldo et al. 2009).” (Bennett and Burau 20142)

Map of Magnitude of flood tides

Figure 5. Magnitude of flood tides (red) during recent early winter storms. Note minimal flood tides in Sacramento River channel carrying most of storm flow (blue). South Delta flood tides are roughly doubled due to the effect of the near 6,000 cfs export. Note also the strong flood tides into Cache Slough and lower San Joaquin areas (green dots), important spawning areas of Delta Smelt.

Minimizing Loss of Salmon and Smelt

Recently the Smelt Working Group recommended reducing South Delta exports and limiting OMR to being no more negative than -2000 cfs5 to protect Delta Smelt. In its Determination Under Component 1 of the 2008 OCAP Biological Opinion based on the Working Group’s recommendation, the US Fish and Wildlife Service6 set the limit at -3500 cfs from the existing -5000 cfs limit. “This will ensure more positive OMR values during the peak of flow and turbidity from this week’s storm. The Service believes that in light of the risk to Delta Smelt, the OMR flow proposal from Reclamation and DWR is prudent.” The Service had no real justification for revising the Working Group’s recommendation.

The Working Group had no recommendation based on Longfin Smelt, despite detection of larvae in the first larval survey of the year. Larvae were detected in low numbers in the San Joaquin channel of the Central Delta7 . Such detection is remarkable given few adult Longfin were collected in the December trawl surveys. (Note: Criteria for action remain expressed as density in surveys and salvage numbers, which should not continue as criteria at the present extreme low population level.) “Exports targeting -5,000 cfs OMR will slightly increase risk of entrainment through the week as inflow declines until predicted rainfall on Wednesday causes Delta inflow to rise again about Saturday. A USFWS implemented recommendation from the SWG of -2,000 cfs OMR would be highly protective of Longfin Smelt adults and larvae.” Note again that this recommendation was not adopted.

No determination as to the NMFS 2009 OCAP Biological Opinion for salmon has been made.

The Working Group was seeking to minimize the accentuated flood tides and exports to limit pulling the higher turbidity water and smelt into the south Delta near the export pumps. With smelt and salmon already present in the central Delta because of the lack of previous precautions, the Working Group recognized the higher risk from exports. Their recommendation was more protective than the Service’s subsequent determination.

So what else can or should be done given the Services determination? At a minimum:

  1. Export only from CVP Tracy (Jones) pumping plant, which has less risk to smelt and less effect on flood tides than SWP exports from Clifton Court Forebay.
  2. Lower exports between storms to reduce export/inflow ratio and net flow from west Delta.
  3. Open the Delta Cross Channel to increase net downstream flow and lower the magnitude of the flood tides in the San Joaquin channel and increase the flood tide magnitude in the Sacramento River channel.
  4. Put in the False River Barrier to limit smelt movement into the Central Delta via this route and lessen the magnitude of the flood tides in San Joaquin River channel and Central and South Delta.

Delta Fish and Flows – Listen to our fish scientists

The Delta independent Science Board, made up mostly of non-Californians and non-fish biologists, waded into the fray on Delta issues again with their recent report:  Flows and Fishes in the Sacramento-San Joaquin Delta – Research Needs in Support of Adaptive Management 1

After 50 years of extensive research and adaptive management, the Delta water managers still believe we need the insights of outsiders before the secrets of the Delta are exposed to improve water management for fish.  Once the center of world-wide estuarine science beginning in the 60’s and 70’s, the San Francisco Bay Delta now has new advice sought from outside sources.  I came to the Bay-Delta in the late 70’s as an outsider to learn from and participate in comprehensive fish-ecosystem science going on in the Bay-Delta.  I was honored to participate in and contribute to Bay-Delta science.  Many of the young scientists who came with me then and since have contributed decades of their careers to Bay-Delta science.  Yet there is this continuing quest for more outside input fraught with non-fish science.

The Report

Delta Independant Science Board Report Cover

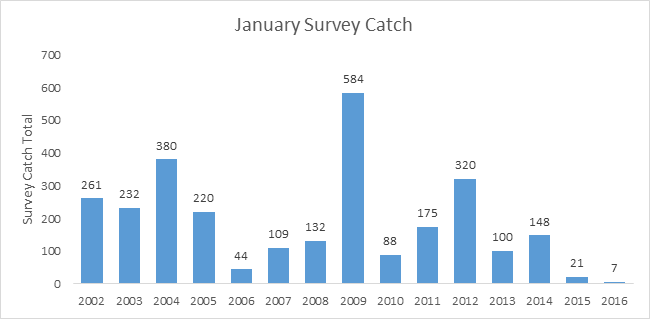
“The economic, ecological, and social costs of scientific uncertainty in water management controversies are significant – and to some degree unavoidable.  This report therefore recommends, first and foremost redoubling effects to identify causes and effects concerning fishes and flows in the Delta.”  (Page 5).  Uncertainty is not the cause of the failure in protecting the Bay-Delta ecosystem.  It is a failure to use science with its uncertainties to protect the ecosystem.  After 40-plus years of study, the answers are obvious.  Redoubling?  Why not simply recognizing the obvious?  There are no doubts that changes in flows are the cause of most of the Delta problems, and that changes designed to reduce entrainment of fish at the Delta export pumps (OMR, etc.) have proven ineffective.  There is no need to redouble efforts to understand the relationship between flows and fish.  We know why the Winter Run salmon were wiped out below Shasta in 2014 and 2015.  We know why Delta and Longfin Smelt populations have been at record lows the past two years.

“The habitat and flow needs of the native species are difficult to define in the transformed place and in a novel ecosystem.”  (Page 5).  The habitat and flow needs are well known.  The ecosystem, though “transformed,” is not novel.  Anyone who has been here awhile and studied the fish knows.

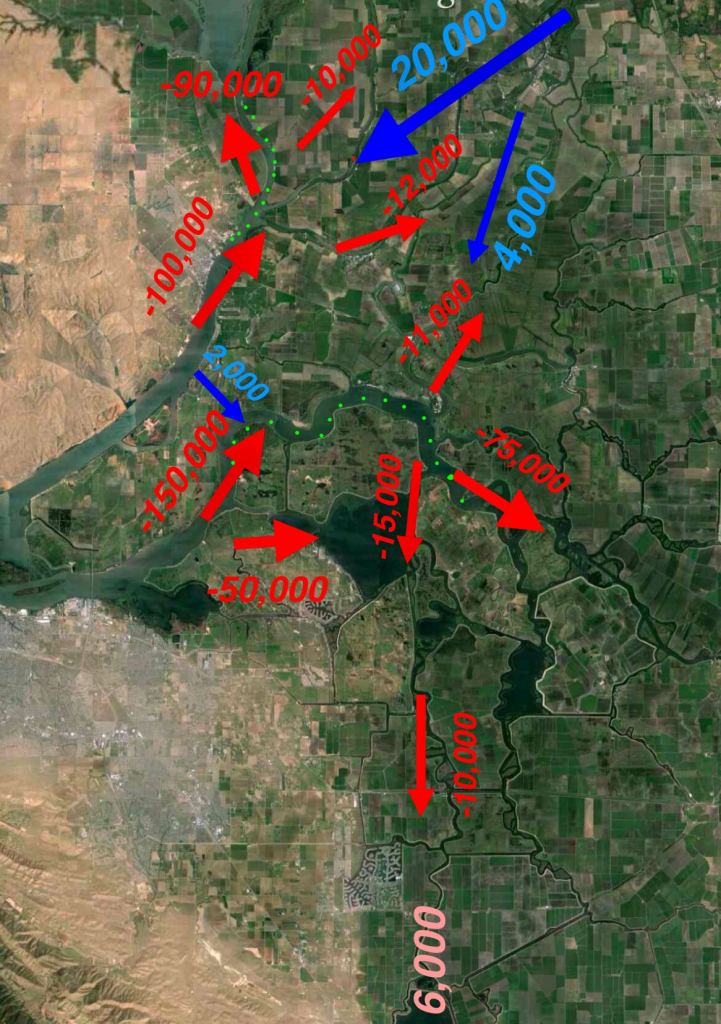
“Focus on cause and effect – the mechanisms that enable flows to affect fishes.  Deeper causal understanding is important for identifying and reducing risks to water supply and fish populations.”  (Page 5).  We’ve been through this time after time.  Overwhelmingly, finding the political will to follow the science we already have is far more critical than fine-tuning the mechanistic understanding of how fish respond to flow.  The problem in the Delta is systemic: water management has turned the hydrograph on its head and deprived the estuary of half of its flow (in dry year sequences, more than half).  The State Water Board’s 2010 Delta Flow Criteria Report 2 got this fundamentally right: on a mass and systemic basis, Delta inflow and outflow need to be radically increased to provide basic system functions, including variability.   Not every effect is a direct effect.  Focusing only on direct effects – the “causal mechanisms” – is overwhelmingly about “risks to water supply.”  Beneath the surface of hunting for mechanisms is an engineering-style belief that one can surgically provide water to produce this or that benefit at the exact moment it’s needed.  Sure, better understanding is good, and different specific actions can help.  But the need isn’t met by adding up specific actions.  We need to restore underlying ecosystem function that serves as a foundation for targeted improvements.  Right now we aren’t even close.

“Understanding the dependencies of fishes on water flows is central to understanding the Delta ecosystem.  Relationships between fishes and flows drive state and federal policy and related regulatory and management decisions, and consequently have been central to legal arguments and decisions.”  (Page 9).  Delta water quality control plans, and water rights orders since the 1960s (mainly D-1485 and D-1641), have recognized (and focused) on the relationship between flows and fishes.  Earlier, the focus was on striped bass and flows (D-1485), but more recently the focus has been on smelt-salmon and flows (D-1641).  There have been changes in summer standards that hurt striped bass while strengthening winter-spring standards have helped smelt and salmon.  But after decades of management under the standards and an array of biological opinions, it is obvious to most that the level of protections has been inadequate.  The problem is not a lack of science and understanding; it is a lack of commitment to them.

 “A comprehensive, integrative, and well-planned scientific approach focused on processes, drivers, and predictions is needed to aid near-term and long-term adaptive management and to predict how future changes might affect fishes.”  (Page 21). The Bay-Delta has had this for 50 years.  The science, data, and adaptive management are well documented, as well as reflected in water rights, water quality standards, biological opinions, and management and recovery plans.  But most important of all, they are carried in the minds of hundreds of Bay-Delta scientists who have dedicated their careers to this purpose.

 “The development of a generalized fish model portable for different fish species and for different water management decisions is needed to forecast  expected consequences and timelines for adaptive  management strategies.”  (Page 23). Such models already exist in many forms that reflect and carry the knowledge of what has been learned over the past 50 years.  Models developed in the 60’s for striped bass still work today.

Follow-up Workshop

At the follow-up Delta Independent Science Board workshop in December, Dr. Lund, chairman of the Science Board, discussed the major findings of the report, the first being that connecting flows and fishes is central to achieving the state’s coequal goals. “The modern Delta is not a native ecosystem but is dominated by non-native species with some natives, and that’s a particular challenge for some of the ecosystem goals for the Delta,” he said.  “Statistical analyses show that flows do affect fish, but decisions need a little bit more causal understanding of how flows involve fishes, especially as we try to manage the Delta and make some larger changes over time. Where larger changes occur in the Delta that we have to respond to, we need a more causal understanding of how these relationships work.3  In my experience, when correlations that support science theory continue becoming more statistically significant with each added year of data, it is time to accept the theories and start doing something.  Using the same excuses for inaction and continuing to promote more science will not save the Bay-Delta ecosystem.

In Conclusion

What has been missing for decades is this:  our locally grown fisheries scientists have no access to what are often called the “knobs” of management in the Delta.  Instead of scientists, resource agency managers and water purveyors constrict the range of adaptation to protect water supply at the expense of fishes and their habitats.  Adaptive management is driven by managers.  Our Smelt and Salmon Working Groups are stymied by senior management and by political oversight and control.  Adaptive management in the Delta has become a synonym for how far fisheries agency managers will agree to weaken resource protection.  Examples include weakening water quality standards in droughts; allowing unrestricted water transfers through the Delta; and closing the Delta Cross Channel gates in summer.

It is time to listen to our home-grown fish scientists and let them turn the knobs in the right direction.

Status of Smelt at end of 2015

Well the final tallies came in for the 2015 Fall Midwater Trawl Survey.  Indices for two smelt were again record lows as expected.  Not quite zero, but close.  The Smelt Working Group continues to track Endangered Species Act incidental take permit limits set in the 2008 federal biological opinion based on South Delta salvage: December – No salvage, no concern, so pump like hell.

Delta Smelt

It hard to tell from Figure 1, but 2015 came in with an index of 7, compared to the record low 9 in 2014. No fanfare this year from CDFW as back when 2011 index came out.  No articles in the SacBee.  Just another nail in the coffin.

Graph Smelt Trawl

Figure 1. Delta Smelt Fall Midwater Trawl catch for September-December 1967-2015 (no survey in 74, 79). Yearly index is total catch of four monthly surveys.

Longfin Smelt

It is even harder to tell from Figure 2 that the index for Longfin Smelt came in at 3 compared to last year’s record low of 16.

Graph of Longfin

Figure 2. Longfin Smelt Fall Midwater Trawl catch for September-December 1967-2015 (no survey in 74, 79). Yearly index is total catch of four monthly surveys.

Smelt Working Group

The Smelt Working Group met weekly in December after a 6 month hiatus.1  A couple of the low points:

“The WY 2016 adult Delta Smelt incidental take (IT) is 56, as is stated in the Service’s December 23, 2015 memo to the Bureau of Reclamation. The method to calculate the IT is that which is described on p 386 of the 2008 BiOp, with a correction (as discussed in the memo). The alternative approach that the Service presented to the 2015 independent review panel at the Long-term Operation Biological Opinions annual science review will be piloted this year.”  Thus the Working Group continues to use the old take limits from 2008 and has adopted the new more liberal method of calculation.  Given the remnant population level, allowing the take of  56 Delta smelt in salvage is indefensible.  For every fish taken in salvage, a hundred are lost in Clifton Court Forebay.

“The Working Group reviewed Delta Smelt distribution and salvage data, and current Delta conditions and provided no recommendation as yet for a change in water operations for either Delta Smelt or Longfin Smelt. However, members of the Working Group did conclude that entrainment risk is increasing and the group will meet again December 30 to further discuss a potential recommendation to the Service.”  Indeed, Delta Smelt had been detected in the central Delta at Jersey Point and Prisoners Point, and exports had increased from 800 to 6700 cfs.  Yet the Working Group prescribed no change in water operations. 

The Smelt Working Group planned to meet on December 30.  I cannot wait to see their notes from that meeting.

Cease and Desist DWR! – January 7, 2016

DWR – It just started raining and you already ramped up Delta exports again despite all the salt water and the risks to endangered Winter Run salmon and Delta Smelt. I recently suggested “Whoa,”1 as did Smelt Working Group. At least wait until the runoff from the storm hits the Delta.

The Smelt Working Group concluded on December 30: “The Working Group reviewed Delta Smelt distribution conditions. The working group concluded that entrainment risk has increased. This is based on fish distribution combined with increased water exports, but the group provided no recommendation for a change in water export reduction for either Delta Smelt or Longfin Smelt. This decision was based on the projected decrease in OMR flows from -5600cfs today to -2100cfs on Monday, 1/4. The group will be monitoring conditions closely over the next several days.” But no sooner had January 4 arrived than exports jumped sharply to even higher than the late December level (Figure 1), despite all the early warning signals brought up by the Working Group2.

Graph of Clifron Court Exports

Figure 1. State Water Project Delta exports at Clifton Court Forebay in past month.

The higher exports, in combination with spring tides, have pushed the Low Salinity Zone further east and south into the Delta (Figure 2). (Note: the ten-day charts readily depict recent increased salinity.)

Aerial map of salinity in Delta

Figure 2. Aerial photo with salinity levels (charts of EC), freshwater inflow (blue arrow), negative net inflows of brackish water (red arrows), and route taken by juvenile Winter Run salmon (yellow arrows). Clifton Court at bottom center.

Perhaps more ominous is the increase in salvage of Winter Run salmon (Figures 3 and 4). Twenty-seven were salvaged on 1/6. Given poor salvage efficiency (near 10 % in forebay alone) and the likely presence of many Winter Run trapped in the central and south Delta, as well as the desperate state of the Winter Run population, this is no time to be increasing exports. Where is the Salmon Working Group? This is serious “take”; authorized or not, NMFS should be doing something.

Graph of Salvage of Winter Run

Figure 3. Salvage of Winter Run at south Delta fish facilities. (Missing from this graph is 1/6 salvage that is depicted in Figure 4.) Source: http://www.dfg.ca.gov/delta/apps/salvage/SalvageExportChart.aspx?Species=1&SampleDate=1%2f2%2f2016&Facility=1

Table showing the Salvage of Winter Run

Figure 4. Salvage of Winter Run salmon at south Delta fish facilities 1/1-1/6 2016. Source: http://www.usbr.gov/mp/cvo/vungvari/salmondly.pdf

Whoa on the Delta Exports DWR

The California Department of Water Resources (DWR) and the US Bureau of Reclamation (USBR) recently raised south Delta exports from 800 cfs (12/15) to 6,700 cfs (12/29). Delta outflow of freshwater has declined from 27,000 cfs (12/25) to 5,300 cfs (12/29) in just four days. Though these conditions are allowed in Delta standards, the standards must be changed.

Under these conditions, with the Delta Cross Channel gates closed (per standards), water is pulled from the central and west Delta toward the south Delta export pumps (Figure 1). The problem is that remnants of the Delta smelt population have moved into the west and central Delta on their annual winter spawning migration, as shown in early warning surveys at Jersey Point (Figure 2). Negative net flows (Figures 3-6) draw fish to the pumps and disrupt the salinity field and Low Salinity Zone. Exports also continue to take brackish water (Figure 7) – not good for fish, crops, or humans. They also take juvenile salmon emigrating through the Delta (Figure 8).

Map of Delta Flows Dec 2015

Figure 1. Delta net flow patterns in late December 2015 – positive (blue arrow) and negative (red arrows).

Graph of False River Flows

Figure 3. False River (middle left red arrow in Figure 1) net flows have turned negative with lower Delta outflow and higher exports.

Graph of Three Mile Slough flows

Figure 4. Three Mile Slough (top left red arrow in Figure 1) net flows have turned sharply negative with higher exports.

Graph of Jersey Point flows

Figure 5. Jersey Point (left end of middle left arrow in Figure 1) net flows have turned negative with higher exports.

Graph of Old and Middle River Flows


Figure 6. Net flow in Old and Middle Rivers in south Delta (large lower right arrow in Figure 1) has turned sharply negative with higher exports.

Graph of EC at Clifton Court

Figure 7. Salinity levels (EC) in Clifton Court Forebay in December 2015.

Graph of Chinook and Exports

Figure 8. Salvage of Chinook salmon and export rate at Clifton Court Forebay in December 2015. Many of these salmon are likely endangered Winter Run and Spring Run.