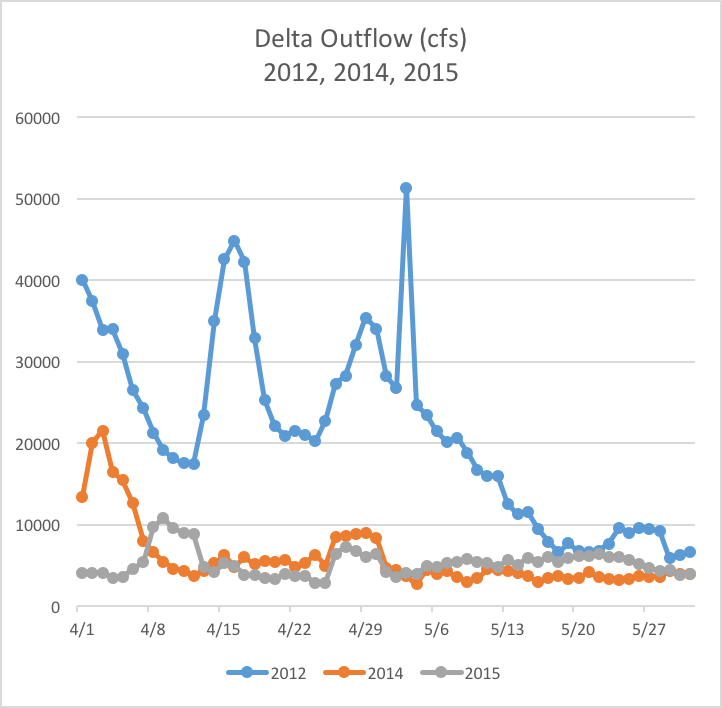
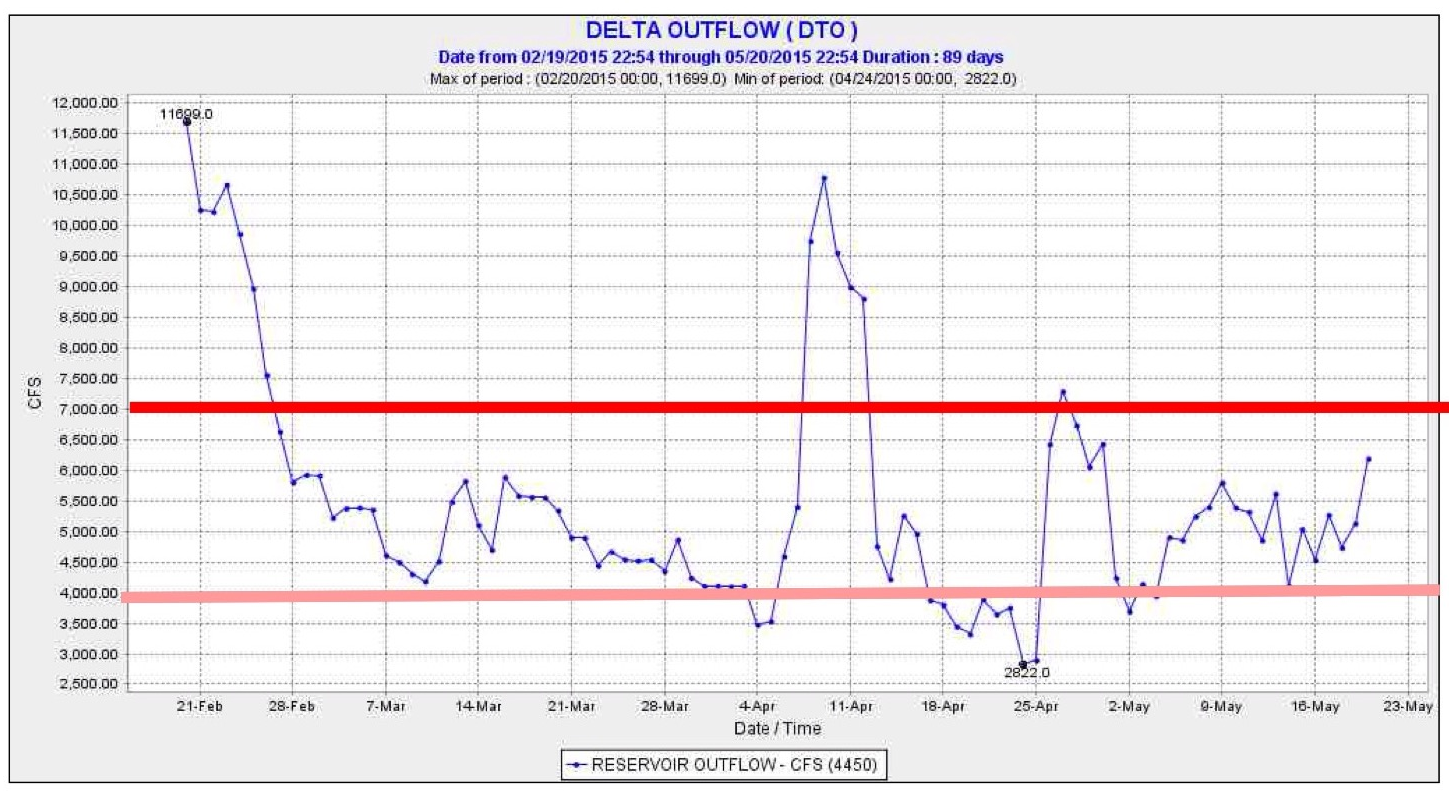
As we enter the second year of Temporary Urgency Changes for Delta operations, the State Water Board is leaving Delta fish with no protection from our waste and the summer heat while allowing the storage and diversion of millions of acre-feet of water for cities and farms. Little or no water left the Delta for the Bay this spring, and even less will leave this summer. The Smelt Working Group charged with protecting two species of endangered smelt is about to take its summer hiatus as South Delta water temperature hits 25°C. The State Board has recently been forced to reduce Shasta Reservoir agricultural releases for fear of running out of cool water for winter run salmon again this summer.
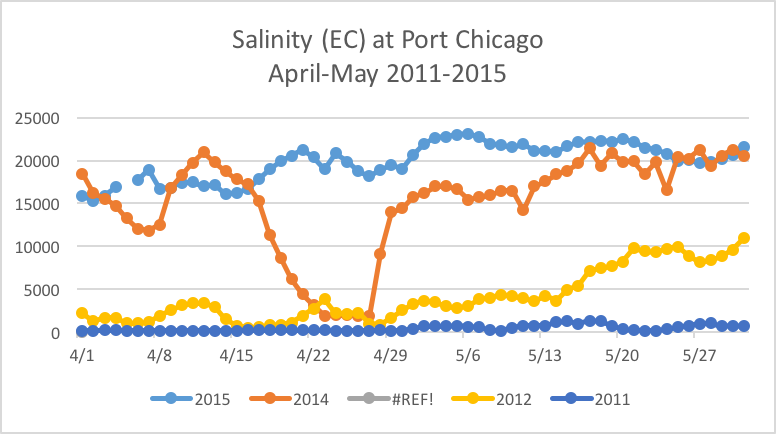
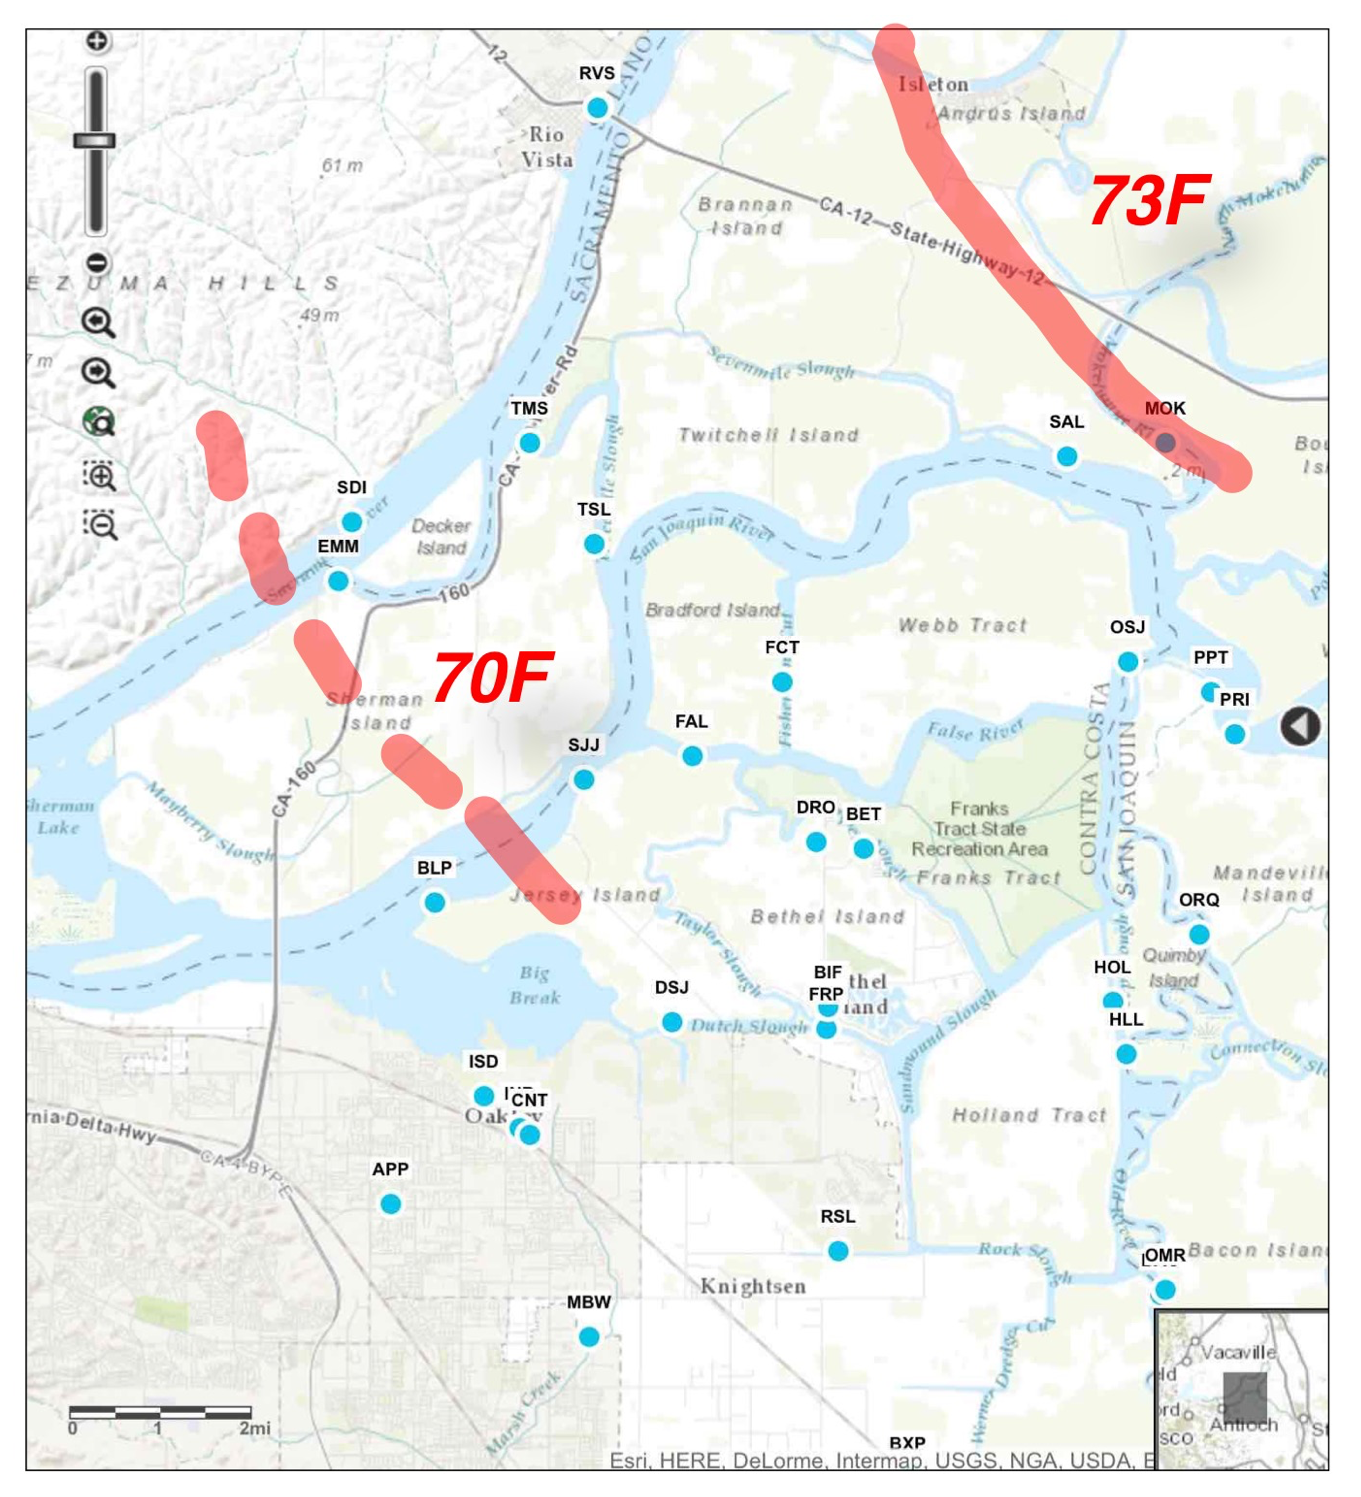
The State Board’s “drought relief” orders keep little water reaching the Bay and allow salt water to encroach into the Delta. The False River Barrier has been installed to keep salt out of south Delta water diversions at the expense of north Delta habitat. Interior, USFWS, NMFS, EPA, and CDFW, our resource protection agencies, have “concurred” with the Temporary Urgent Change Petitions from Reclamation and CDWR, and the State Water Board has complied. 1
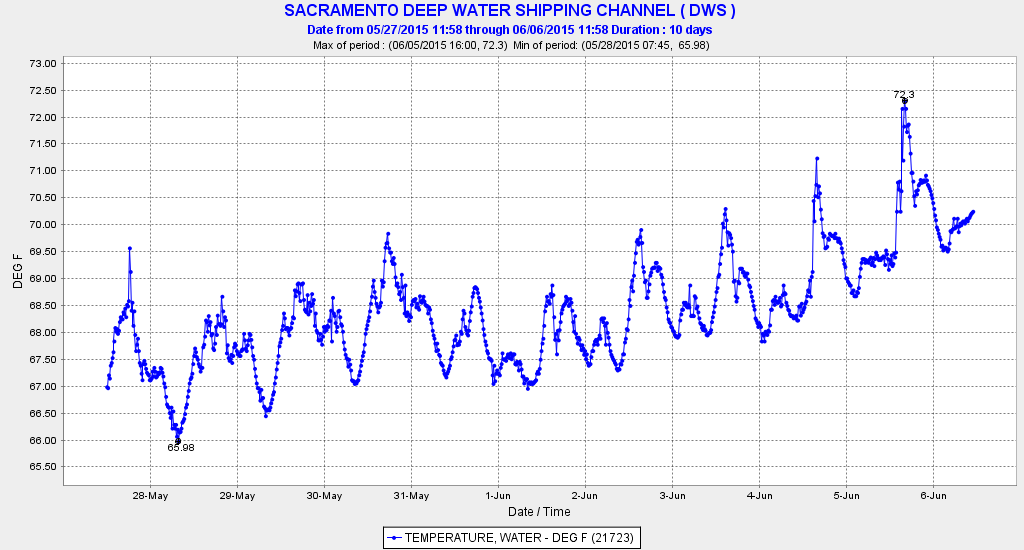
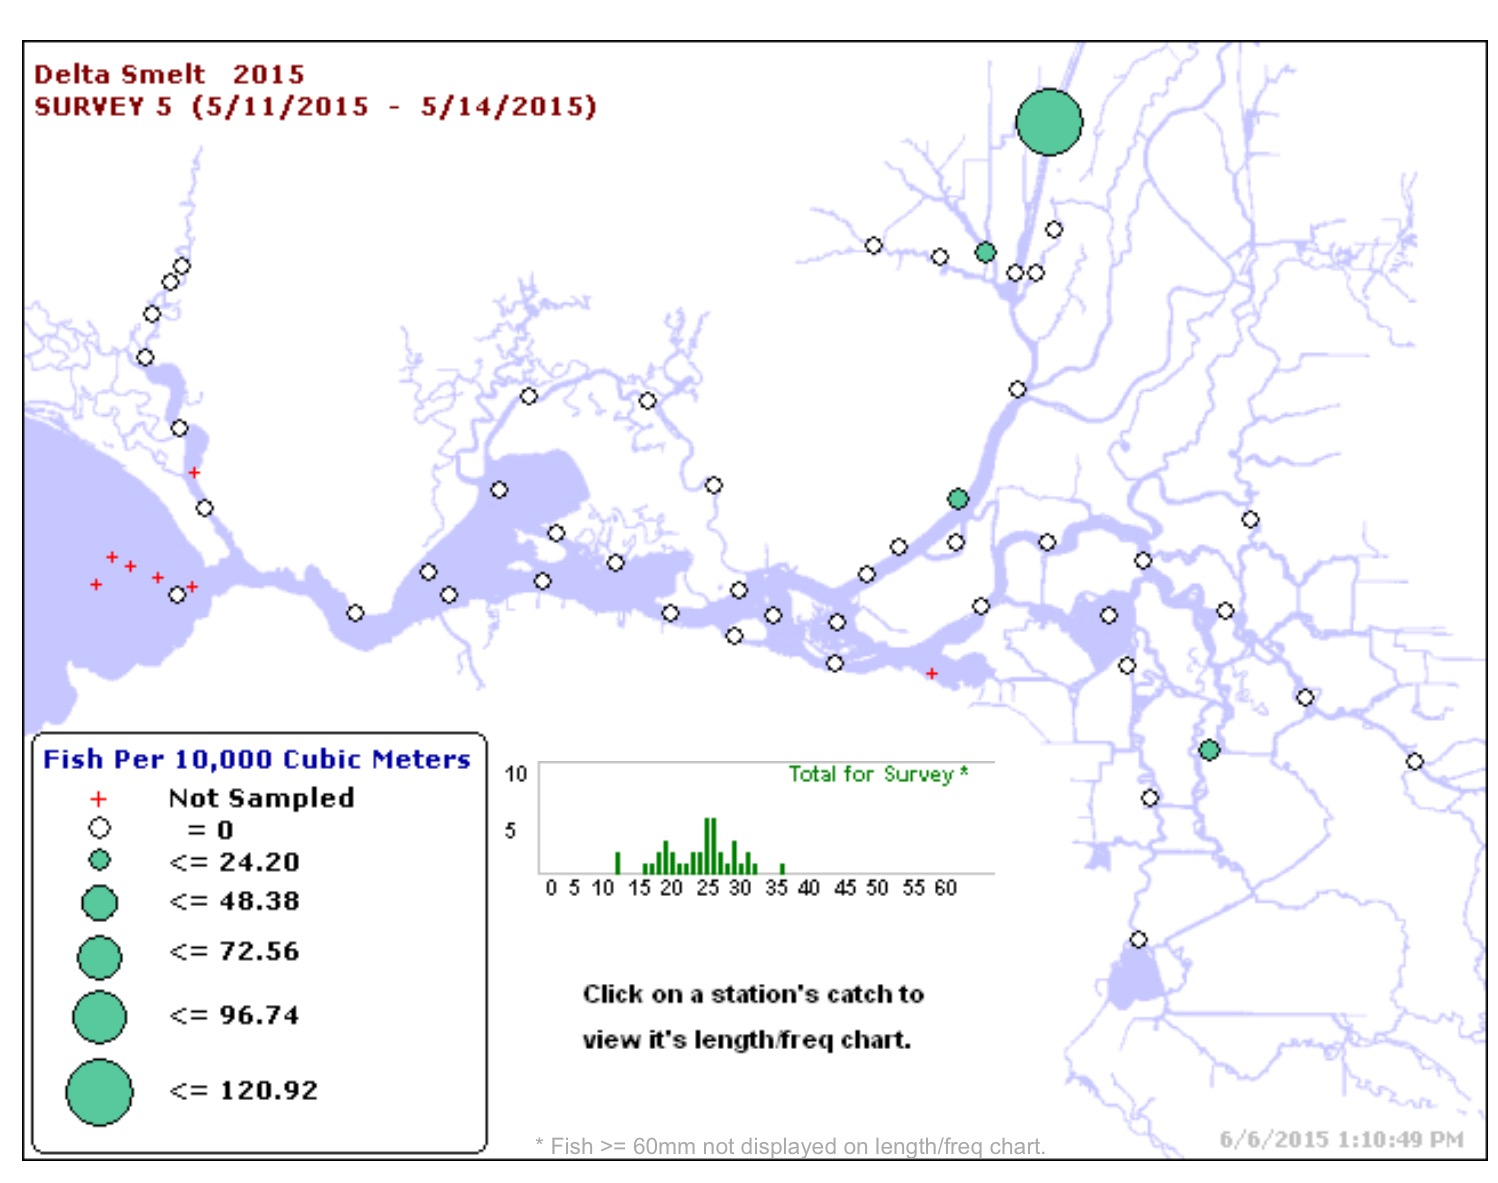
Meanwhile, the remnants of the Delta Smelt population have become isolated in the Sacramento Deep Water Ship Channel. Reclamation scientists assure us that the smelt will be fine and will descend into the cooler water at the bottom of the channel. The lack of smelt in their traditional designated critical habitat of Suisun Bay and the western Delta low-salinity-zone is apparently not a concern.
In the midst of all this “devastation”, the Delta Science Program held a Delta Challenges Workshop this past March.
“On March 16, 2015 the Delta Stewardship Council’s Delta Science Program hosted a workshop to summarize the risks and challenges facing the Bay-Delta system. These challenges include a multitude of stressors that threaten our ability to achieve the Delta Plan’s coequal goals. Numerous reviews, reports and articles describe the stressors and risks facing the contemporary Delta, but this information is spread across diverse publications, journal articles, and lengthy technical reports. The information has not yet been presented in a highly concise, readable way by an independent set of distinguished science experts.” 2
The Workshop
Dr. Moyle suggested that we prepare for the worst: “We have to prepare for the extinction of Delta smelt: “It seems very likely to happen in the next year or two,” Dr. Moyle said. “The Fall Midwater Trawl index has never been lower, we’re basically not getting any in any of our samples, and then most recently, the Kodiak Trawl sampling has found very few, even in places they normally aggregate.” He noted that the results of the most recent Kodiak Trawl, a survey aimed at catching smelt in the places where they’re supposed to be, and where they have been in the past, were pretty dismal. “They got 6 smelt, 4 females and 2 males. So the smelt are pretty much gone from this system. We don’t know yet but they could easily have reached a threshold that they can’t get back over, that they can’t survive. We need to be thinking now of answers to questions like: how will we know when the smelt is extinct in the wild? Who declares that? How can the captive populations present in Byron, how can these captive populations be used for re-introduction when better conditions return, at least temporarily, or even should they? And how does management of the Delta change if the Delta smelt are gone? What do we do, essentially, in the absence of Delta smelt?”
Others spoke on adaptive management: “Dr. Goodwin asked Maria Rea about doing large landscape-scale experiments. “To really do an experiment on the scale that needs to be done, and it’s an experiment so you don’t necessarily know what the outcome is, that puts people making decisions in a very difficult position, and I just wonder, how, as a science/policy/management community, what needs to be done to allow these landscape-scale experiments to go on?”
“We do need to get better at experimentation,” Maria Rea answered, noting that with salmon, they’ve done a bunch of tagged fish studies, some with active adaptive management. “The Vernalis Adaptive Management Program had an active component to it, but the number of fish tagged was insufficient to allow any real conclusions to be drawn from that, and so I think we’ve got quite a bit of work to do to. If we’re going to do a large-scale experiment and actually manipulate the system, then let’s make sure we’re growing enough fish and getting enough tags to put in the system that will actually be able to deduce something from the data that we get.”
The need for more money for more science came up: Dr. Luoma noted that since between 1997 and 2010, there was a large injection of science into the system, tens of millions of dollars. “That was a sign of what we need to keep things moving rapidly,” he said. “That money has dried up … If we’re going to really continue on this journey of trying to make progress, it’s obvious we need a big injection of science somewhere managed by the science program. We need an injection of science that allows us all to work together. That’s desperately needed now or else we’re just going to start flailing.”
“We need to explore performance measures, of having something that we can track that helps the policy makers understand the question, what has to happen next. “I think it was Bill Dennison who ran that workshop several years ago, showed us what you can do with a really organized system of performance measures that gets the public involved, gets the policy makers involved. We can do that, we just haven’t done it. I think this is something we really have to focus on doing right.”
Of course, there is always the concept that the Delta continues to evolve and remains hard to understand: Dr. Mike Healey began by noting that one of Jim Cloern’s comments especially resonated with him. “His comment that the Delta is a continually evolving system and we’re never going to be able to fully pin it down. Several people have been talking about wicked problems. Wicked problems have a formal definition in planning and management, and one of the characteristics of wicked problems is that they can’t be solved, they can only be managed. I think that’s probably what we’re looking at is coming up with a system of management that will be hopefully be relatively effective, rather than imagining that we can clearly define this problem and ultimately provide a solution.”
Then there is always the “reality check” and a “happy place somewhere down the road”:
“Once you’ve answered that question, you need to then concern yourself with what’s actually feasible but most of us want something that we’re really not going to be able to get, so we’re going to need to be able to make a reality check and decide what among the things we’d like to have we can actually accomplish, and then the final question is, how do we get to where we want to go from where we are now? And I think we still have a lot of work to do on those latter three questions,” he said. “We’re not anywhere near coming up with the final management plan for this problem as yet, I don’t think,” he said. “But I hope that whatever we can come up with can make some kind of a contribution to making progress, down the road towards that happy place.”
A potential for “boldness” from “outsiders” who can provide a “fresh look” at the problems:
“I really think there is an opportunity here for some boldness, and I hope that we as a foursome will be a bit bold,” he said. “I really do hope that we basically embrace ideas that we can agree upon and present them to you as things that would be the next steps moving forward, or at least our ideas of what that might be, because we need to move beyond just simply continuing to monitor this system. We really need to begin to actually implement some projects, some experiments, and really move that next step down the road to actually beginning to deal with some of the changes that are being imposed on the system and seeing if we can come up with a better and more beneficial ending with some of our attempts. I know it’s fraught with lots of difficulty, and we’re going to make lost of mistakes, but I think we need to be bold and move forward. And hopefully we can give you some ideas on how we think that might be best done.”
And finally, “something learned”, “fun”, and a “ridiculous challenge”:
After public comment, Letty Belin with the Department of the Interior then gave some final thoughts. “I think it’s been an extraordinary day,” she said. “I bet you there’s not a single person in this room that hasn’t learned something significant. I’m still amazed that we got this incredibly talented and experienced panel to accept what I acknowledge is a ridiculous charge. If I had this assignment, I would first turn it back to the teacher and say this is impossible, you cannot summarize this stuff in 15 to 20 pages, and then I’d ask what size can the font be, can it be like .333 but anyway I know it’s particularly fun to hear your reactions and use words like fun.
“I can’t tell you how important I think this effort is,” she continued. “I think it’s going to be incredibly helpful, because policy making in such a complex scientific environment, we need guideposts and people, you all who have both the scientific expertise and the wisdom gained through that, we really are fortunate to be able to get your expertise, so thank you so much.”
Not a word on the drought or changes to Delta water quality standards, or the effects of having no freshwater flow into the Bay.
- At a State Board drought workshop earlier this year, the Board chairperson asked the NMFS representative what “concurrence” meant. The NMFS rep responded by stating he had looked up the definition in a dictionary, but they really did not understand its meaning in this case. ↩
- http://mavensnotebook.com/2015/04/24/delta-challenges-workshop-part-4-fish-birds-and-habitat/ ↩