Does the Central Valley Need a Predator Removal Program?

The Columbia River Pikeminnow Sport Reward Program just finished another year.  A near-record 200,000 adult pikeminnow were harvested and $1.7 million rewards paid.  The goal of the program is to harvest 10-20% of the population each year to reduce the population about 50%.  Harvest rates in recent years reached as high as 17% as compared to this year’s 11%.

So why after 25 years is the program still harvesting near-record numbers of pikeminnow?  The likely reason is that the program is not based on sound science.  The Columbia pikeminnow population dynamics likely are best described with a standard Ricker-Type Population Model (see chart below), with reduced recruitment of young at high adult population levels because of competition and cannibalism.  The introduction of a light harvest can actual increase recruitment of young by reducing competition and cannibalism, with the increased recruitment replacing the harvest, even providing a constant harvest or yield.  This is how fishery quotas may be sustained year after year, such as in Alaska’s Bristol Bay Sockeye salmon fishery.

This same dynamic likely applies to pikeminnow and some other predators in the Central Valley.  Pikeminnow are likely near their saturation level in the Central Valley.  Any light harvest such as from a sport-reward or removal program would likely have little or no effect.  Increasing harvest on non-native predators like largemouth bass by reducing sport-fishing harvest regulations would likely also have a limited benefit.  However, striped bass, the most popular sport fish in the Delta, has a population that is already seriously depressed by long-term loss of juveniles to water diversions.  Striped bass may respond more directly to increased harvest, further reducing recruitment and further depressing the population.

Thus the species composition of fish that eat other fish could change, satisfying those who vilify stripers and infuriating those who fish for them.  But the potential for reduced overall loss of juvenile salmon or other native species that might follow from “predator removal” is far more complex and questionable than its proponents maintain.

Ricker-type stock-recruitment population dynamics model that likely applies to Columbia River and Sacramento River pikeminnow populations

Ricker-type stock-recruitment population dynamics model that likely applies to Columbia River and Sacramento River pikeminnow populations

Predation

“While state and federal wildlife agencies, university researchers, and water users all agree that predation from non-native fishes is a major stressor on salmon populations, we have done nothing to try to directly curb its impact.”

This statement in a recent Fishbio blog post is simply not true.

In 1995, the state removed limits on summer Delta exports that had been in place for decades to protect young striped bass. Stocking of striped bass ended at the beginning of this century. Both actions contributed to record low production of striped bass over the past decade. 1 The Bay-Delta population of striped bass is now greatly depressed. The river population is sustained by the continuing policy of releasing hatchery salmon smolts in the spring at the hatcheries, an unnatural process that simply feeds the river stripers.2

The real problem is spring water management in the Sacramento and San Joaquin rivers that brings unnaturally low flows and warm, clear water that favors the predators. All the salmon runs naturally have juveniles migrating to the Bay in high cold flows from late fall to early spring when predators are inactive and ineffective. But with dams holding the water from winter rains and snows, the rivers lack natural winter flows and spring snowmelt.

Largemouth bass production in the Delta has increased because of habitat changes from water management, droughts, and invasive aquatic plants that have turned the Delta into an “Arkansas lake.” Smallmouth bass production has increased in the rivers with lower, warmer flow conditions from spring through fall.3

The native pikeminnow also benefit from the habitat changes in the rivers and Delta, as well as the abundance of spring hatchery smolts. Huge schools migrate from the Delta into the rivers in spring and summer to spawn. The tailwaters downstream of dams favor pikeminnow. The adults feed on young salmonids and the juveniles compete with juvenile salmonids. Juvenile pikeminnow that return to the Delta feed on smelt.

It is these habitat changes that have resulted in more effective predation on native salmon, steelhead, and smelts. Ignoring the cause won’t solve the problem. Focusing on the predators will not work. The basses and native pikeminnow have prolific reproductive systems. Killing more of them by removing regulations on their harvest or even putting bounties on them (like pikeminnow on the Columbia River) will not solve the root problem – habitat change. And without the predators, what would be left to control all the non-native forage and “trash-fish” that already plague the Delta and rivers?

In the future, if we continue to take more of the river flows and further degrade habitats, there will always be the temptation and the drumbeat to directly remove predators or inhibit their migrations. We can stop salvaging millions of these predators every year at the South Delta export facilities, stop returning all the bass caught in fishing tournaments, and truck all the remaining salmon produced only in hatcheries to the Bay. In the end we will still have abundant predators, an “Arkansas-like lake,” hatchery salmon, and at best novelty populations of endangered wild salmon, steelhead, sturgeon, smelts, complemented by likely newly listed species of native fishes like splittail, blackfish, hitch, etc.

Delta Update – August 1, 2016

Just a quick update on Delta fisheries on August 1, 2016. Delta outflow this spring-summer for this below-normal water year was as expected, except for the pulse of up to 14,000 cfs in the July experiment to help Delta Smelt (Figure 1). Year 2000, an above-normal year and a pre-Pelagic Organism Decline year, is shown for comparison.

Figure 1. Delta outflow May-July 2000 and 2016.

Figure 1. Delta outflow May-July 2000 and 2016.

Striped Bass

My earlier optimism for this year’s striped bass production continues to fade.  I continue to believe that the poor success is related to poor early summer Delta outflow based on comparison with year 2000, the last decent year class produced by striped bass in the Bay-Delta as determined by the June Summer Townet Survey.  Figures 2 and 3 show abundance and distribution in 2000 and 2016, respectively.  Densities were an order of magnitude higher in 2000, after spring larvae abundances were similar between the two years.  Figures 4 and 5 show spring-summer salvage at south Delta pumps for 2000 and 2016, respectively.  Again, much higher salvage in 2000 reflects the order of magnitude greater abundance in 2000 than in 2016.

Delta Smelt

Delta Smelt continue to be virtually extinct in the Bay-Delta.  Figures 6 and 7 show abundance and distribution in 2000, the last near normal abundance year (pre-Pelagic Organism Decline), and 2016, respectively.  Figures 8 and 9 show spring-summer salvage at south Delta pumps for 2000 and 2016, respectively.  The relatively high salvage in 2000 reflects the general abundance at the end of the 90’s.  The fact that there are no longer Delta Smelt in the 2016 Townet Survey or in salvage is a very clear indication that Delta Smelt are virtually extinct.  The July experiment, though well intended, was a little too late.

Figure 2. Striped Bass catch per 10,000 cubic meters in June 2000.

Figure 2. Striped Bass catch per 10,000 cubic meters in June 2000.

Figure 3. Striped Bass catch per 10,000 cubic meters in June 2016.

Figure 3. Striped Bass catch per 10,000 cubic meters in June 2016.

Figure 4. South Delta salvage of Striped Bass May-July 2000.

Figure 4. South Delta salvage of Striped Bass May-July 2000.

Figure 5. South Delta salvage of Striped Bass May-July 2016.

Figure 5. South Delta salvage of Striped Bass May-July 2016.

Figure 6. Delta Smelt catch per 10,000 cubic meters in June 2000.

Figure 6. Delta Smelt catch per 10,000 cubic meters in June 2000.

Figure 7. Delta Smelt catch per 10,000 cubic meters in June 2016.

Figure 7. Delta Smelt catch per 10,000 cubic meters in June 2016.

Figure 8. South Delta salvage of Delta Smelt May-July 2000.

Figure 8. South Delta salvage of Delta Smelt May-July 2000.

Figure 9. South Delta salvage of Delta Smelt May-July 2016. (Salvage was zero.)

Figure 9. South Delta salvage of Delta Smelt May-July 2016. (Salvage was zero.)

Striped Bass Comeback Stalls in June

In a June 1 post, I wrote of an apparently strong year class of striped bass developing in 2016.  This analysis was based on May surveys.  I suggested then the comeback could fall short after higher exports began in June.

The results of the two DFW 20-mm Surveys for June are in, and these results indeed show a sharp decline in the densities of juvenile striped bass between early and late June (Figure 1), coincident with a rise in south Delta exports over the month (Figure 2).  Some of the greatest changes occurred in the interior Delta (900 stations), where the effect of exports would be greatest.

The late June densities, though higher than 2014 and 2015, are consistent with densities over the previous decade of striped bass decline and are lower than the prior decade of striped bass recovery.  With the demise of the Delta smelt population, it may be appropriate to consider striped bass once again as the Delta’s “canary-in-the-coal-mine.”

 Figure 1. Striped bass juvenile density in the Delta in June 2016 20-mm surveys. The 700 stations are from the lower Sacramento River channel of the west and north Delta. The 800 stations are from the lower San Joaquin River channel of the west and central Delta. The 900 stations are from interior Delta channels. ( http://www.dfg.ca.gov/delta/data/20mm/stations.asp )


Figure 1. Striped bass juvenile density in the Delta in June 2016 20-mm surveys. The 700 stations are from the lower Sacramento River channel of the west and north Delta. The 800 stations are from the lower San Joaquin River channel of the west and central Delta. The 900 stations are from interior Delta channels. ( http://www.dfg.ca.gov/delta/data/20mm/stations.asp )

Figure 2. Reverse flow in Old and Middle Rivers in central Delta in June 2016. Reverse flows are representative of the direct effects of south Delta exports on central Delta channels. The survey periods of the two DFW 20-mm surveys are shown.

Figure 2. Reverse flow in Old and Middle Rivers in central Delta in June 2016. Reverse flows are representative of the direct effects of south Delta exports on central Delta channels. The survey periods of the two DFW 20-mm surveys are shown.

June Update and Possible Solution to 2016 Fish Woes

Over the past month I related water issues involving Delta and longfin smelt, striped bass, green and white sturgeon, and winter-run and spring-run salmon. All of these species need river flow and cooler water over the next several months. Shasta releases to the upper Sacramento River need to be cold, stable, and sufficient to sustain winter-run salmon eggs in the river near Redding and to sustain moderate flows and cooler water temperatures for 200 miles of river to protect sturgeon and other lifestages of salmon. Sufficient flows needs to pass through the Delta to keep the low salinity zone downstream of the Delta in the cool waters of eastern Suisun Bay, away from Delta exports.

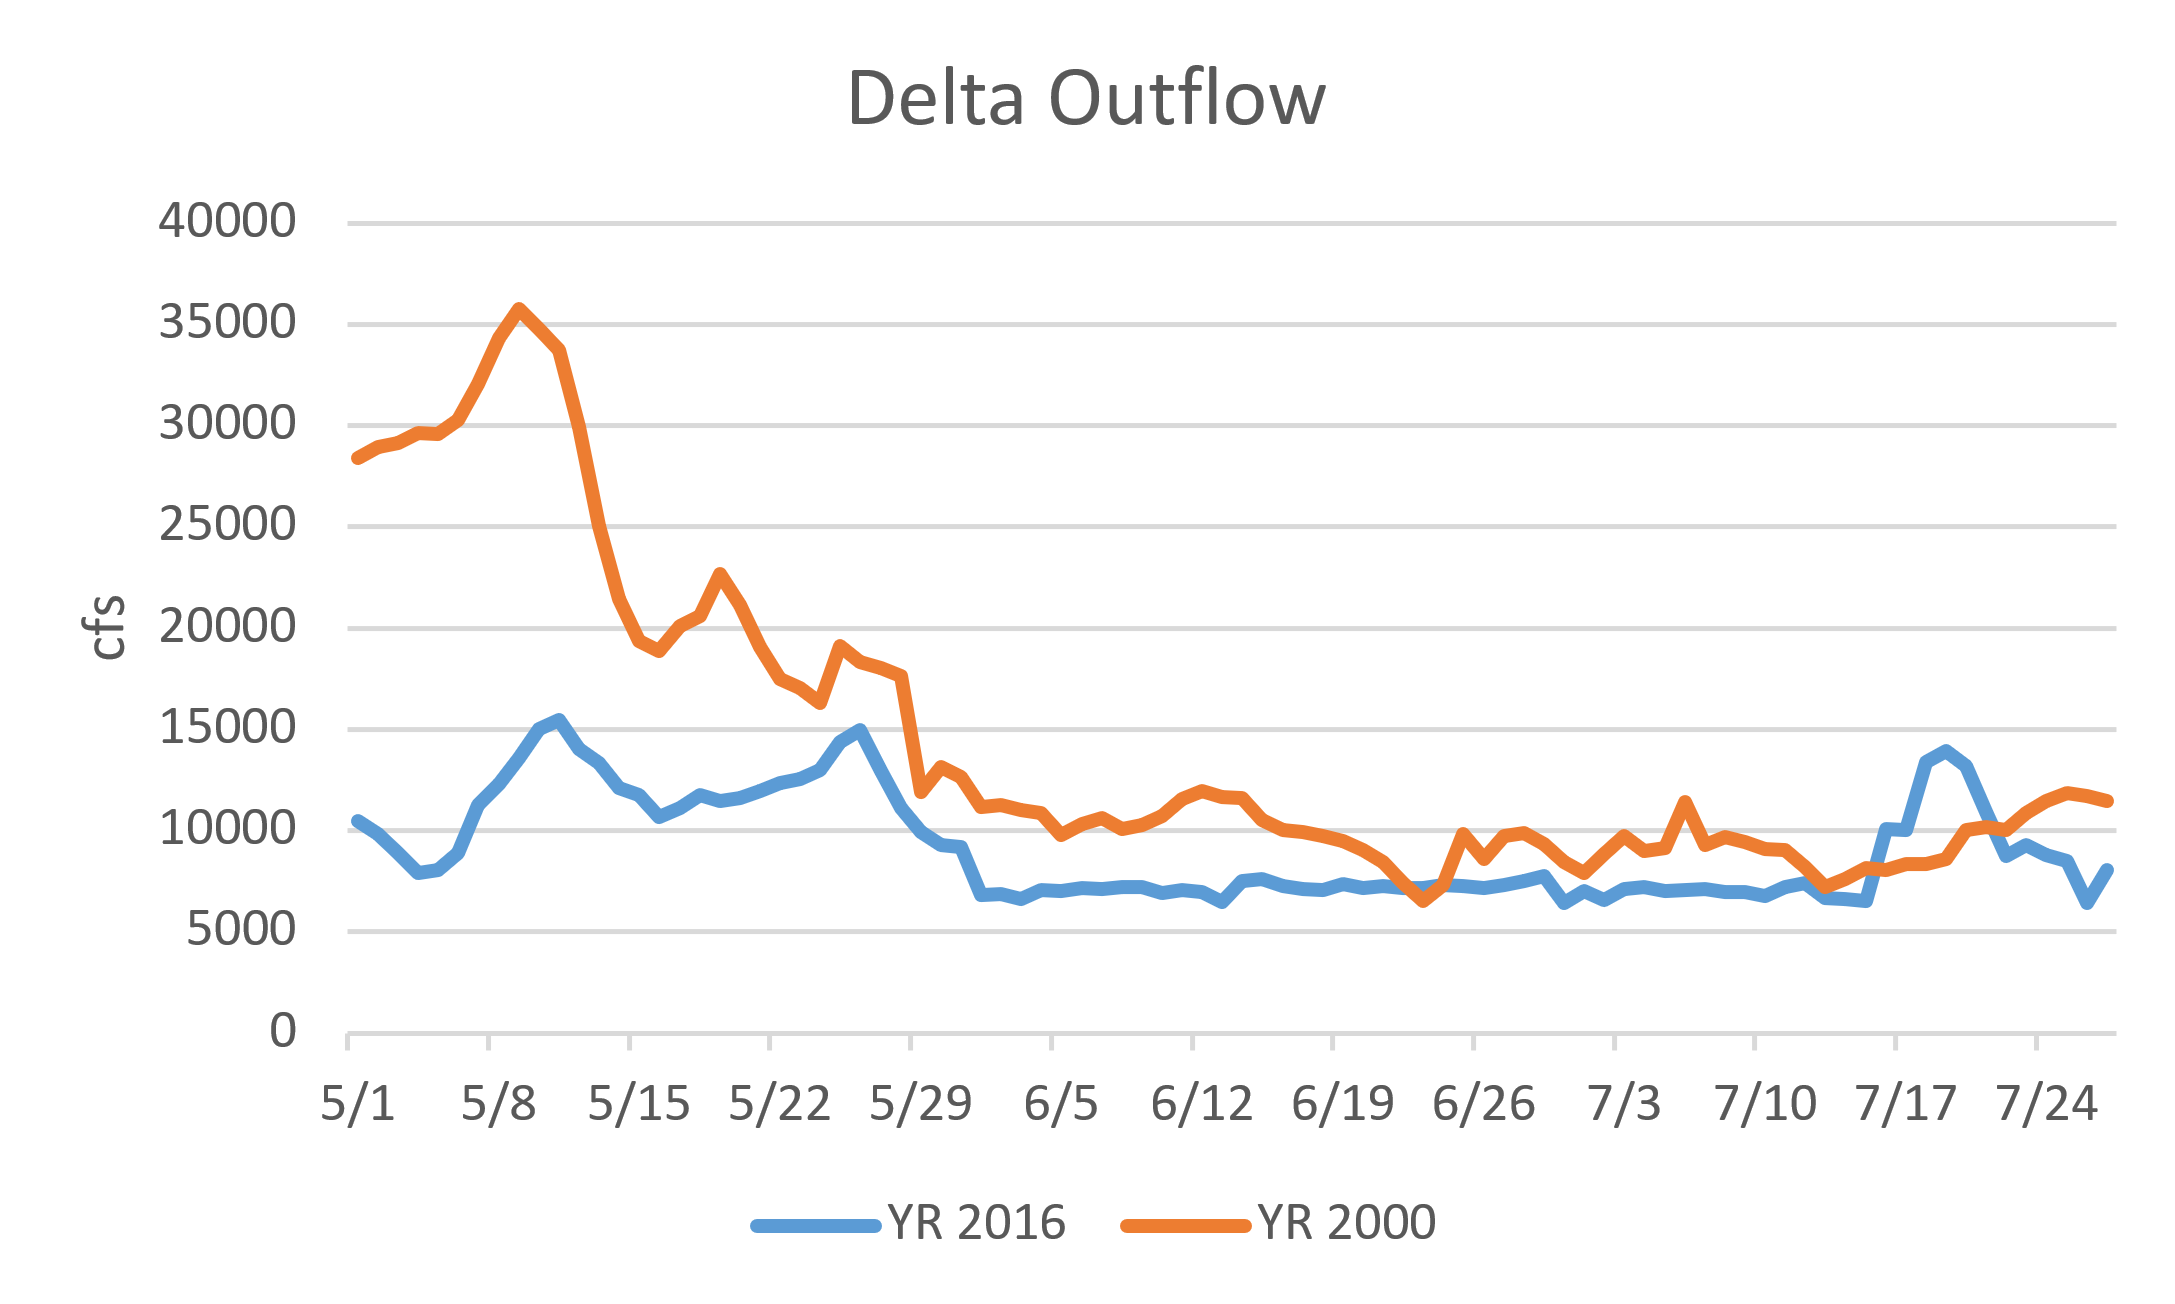
Shasta releases are now 8000 cfs, with Bend Bridge water temperature near the Red Bluff target of 56°F. In June and July of drought years 2012 and 2013, releases were 11,000-14,000 cfs. However, concern over carryover storage and sustaining cold-water releases through summer has led to a more conservative management strategy in 2016. The cold-water pool in Shasta Reservoir is being rationed to make it through the summer. Flows will rise over the next six weeks to 9,000 or 10,000 cfs to satisfy irrigation demands in the upper river.

Flows in the lower Sacramento River at Wilkins Slough need to be greater than 5000 cfs in summer, if only to keep water temperature down closer to the Basin Plan’s 68°F. Flows are now 3000-4000 cfs, with water temperatures up to 75°F. In dry years 2012 and 2013, flows at Wilkins Slough were 6000-9000 cfs, and water temperatures were cooler, as some of Shasta’s storage was allocated for Delta export. This year’s management strategy to hold back Shasta releases will, if continued, keep both Wilkins Slough flows and Delta exports down.

Delta outflows need to be sustained near 10,000 cfs to keep the low salinity zone and X2 (2 ppt salinity) near Collinsville in eastern Suisun Bay. However, July outflow to the Bay required by water quality standards will be only about 8000 cfs. To help save the last of the two smelt species, 10,000 cfs would be far better.

A reasonable solution is apparent: raise Shasta releases through most of the summer by 2000 cfs to 10,000-12,000 cfs and require that the extra release be passed down the river to and through the Delta. While such a management strategy would benefit the fish, it would decrease Shasta storage by 120,000 acre-ft of water per month. At present, Shasta is 90% full at 4.1 million acre-feet (the cold-water pool volume is about 2.4 maf). At 12,000 cfs, the total Shasta release would rise to 600,000 acre-feet per month, which is about the current total release from Oroville (Feather River) and Folsom (American River) reservoirs. NMFS and USBR have determined that a 10,000 cfs Shasta cold-water release can be sustained through the summer, while a 12,000 cfs release could be problematic. Protests would no doubt come from water users who would want the extra 2000 cfs. But note that of the 20,000 cfs being released today from the three main Sacramento Valley reservoirs, only 8000 cfs is reaching the Bay.1

This solution of raising total reservoir releases to 22,000-24,000 and Bay outflow to 10,000 cfs is reasonable to help the fish after four years of drought. In 2014-2015, water quality standards were drastically reduced, with catastrophic effects to fish. The continuing legacy of these catastrophic effects creates the urgency to do better in 2016.

If higher releases from Shasta become problematic for whatever reason, then some compromise should be achievable, noting that water deliveries of Shasta water are to be provided only after the needs of the fish are first considered, including conservation of Shasta’s cold-water pool through the summer and early fall (Water Rights Orders 90-05 and 92-02). Further, Central Valley water rights are provided via the Trinity River trans-basin diversion to Keswick Reservoir on the Sacramento River below Shasta Dam, but the Trinity supply is much in doubt because Trinity storage has failed to recover after the drought, unlike Shasta storage. A lack of Trinity supply this summer will further limit water available for irrigation in the Central Valley. Yet another constraint is whether the available storage in Oroville and Folsom reservoirs is able to satisfy Delta demands without compromising the needs of endangered fish in the Feather and American rivers.

Sorting out these conflicts and needs is the responsibility of the State Water Resources Control Board. The Board’s top priority should be the basic needs of the endangered salmon, sturgeon, and smelts of the Central Valley. At minimum, the Board should require the following conditions this summer:

  1. Below Shasta – Stable flows of 9,000 to 10,000 cfs and 56°F average daily water temperatures near Red Bluff (Jellys Ferry or Bend Bridge).
  2. Lower Sacramento River – minimum 5000 cfs at Wilkins Slough (RM 125 on the Sacramento River)
  3. Delta Outflow – 9,000 cfs in July, 5,000 cfs in August, and 4,000 cfs in September.
  1.  A further complication is that South Delta export criteria allow an increase from 35% of inflow to 65% starting July 1.  Exports in June are limited to 5000 cfs.  In July, exports can be raised to 65% of inflow, but only if outflow is kept at 8000 cfs.  Delta ag diversions are also near 4000 cfs.  Thus July Delta inflow of  20,000 cfs or more (compared to the present inflow of 15,000 cfs) would be needed to allow 10,000 cfs of Delta export.